



Related Tags
You sit down at your terminal, your technical setup looking pristine. The moving averages line up, support levels hold firm, and your stop-loss is placed with textbook precision. Ten seconds later, a sudden spike in red candles wipes out your account margin before you can even react—all because a central bank announced an unexpected rate hike while you were staring strictly at candlestick charts.
Technical indicators show where price has been, but macroeconomic drivers dictate where it is about to go. This is where TradingEconomics comes in. As one of the world's most comprehensive financial databases, it gives traders and analysts instant access to millions of official economic indicators, market prices, and central bank data, helping you anticipate market-moving releases rather than getting caught off guard.
What Is TradingEconomics and How Is It Used?
TradingEconomics is a global macro research and financial data platform that aggregates primary economic statistics across 196 countries. Unlike retail news aggregation sites that curate commentary or second-hand summaries, TradingEconomics compiles raw economic metrics—including Gross Domestic Product (GDP) growth rates, Consumer Price Index (CPI), unemployment figures, trade balances, and government debt levels—directly from primary sources.
The platform is used primarily by global traders, economists, research analysts, and institutions to assess macroeconomic trends, evaluate currency fundamentals, and prepare for high-impact market releases. By providing direct historical data alongside current consensus figures, it allows market participants to analyze how economies perform over multi-year cycles.
Data accuracy is critical when trading macro events. TradingEconomics pulls its metrics directly from verified official institutions—such as the US Bureau of Labor Statistics, the Federal Reserve, Eurostat, the Department of Statistics Malaysia (DOSM), and national central banks—rather than scraping unverified third-party feeds. This direct-sourcing model ensures that the figures you analyze reflect official government records.
Tracking 20+ Million Economic Indicators Across 196 Countries
The core value of TradingEconomics lies in its raw quantitative scale. The platform catalogs over 20 million indicators, covering everything from Tier-1 metrics like Non-Farm Payrolls (NFP) and CPI to micro-level industrial production indexes and consumer sentiment statistics.
For traders operating in Southeast Asia, tracking localized metrics is just as vital as following major US releases. Through TradingEconomics, regional traders can actively monitor figures from Bank Negara Malaysia (BNM)—including the Overnight Policy Rate (OPR) decisions, foreign exchange reserves, and domestic CPI reports—alongside regional indicators from Singapore, Indonesia, and Thailand.
When evaluating foreign exchange pairs like USD/MYR, analyzing regional policy decisions against US Federal Reserve rate expectations provides essential context for medium-term currency movements. For deeper insights on incorporating real-time data into your trade execution, review our guide on the economic calendar.
How to Navigate the TradingEconomics Economic Calendar
Now that you understand how to navigate the platform and filter for high-impact events, the next critical question for traders is: how reliable are these forecasts? Let's examine the accuracy and limitations of TradingEconomics forecast models.
The economic calendar is the most frequently used tool on TradingEconomics. It displays scheduled macroeconomic announcements worldwide, complete with exact release times, historical figures, market expectations, and previous readings.
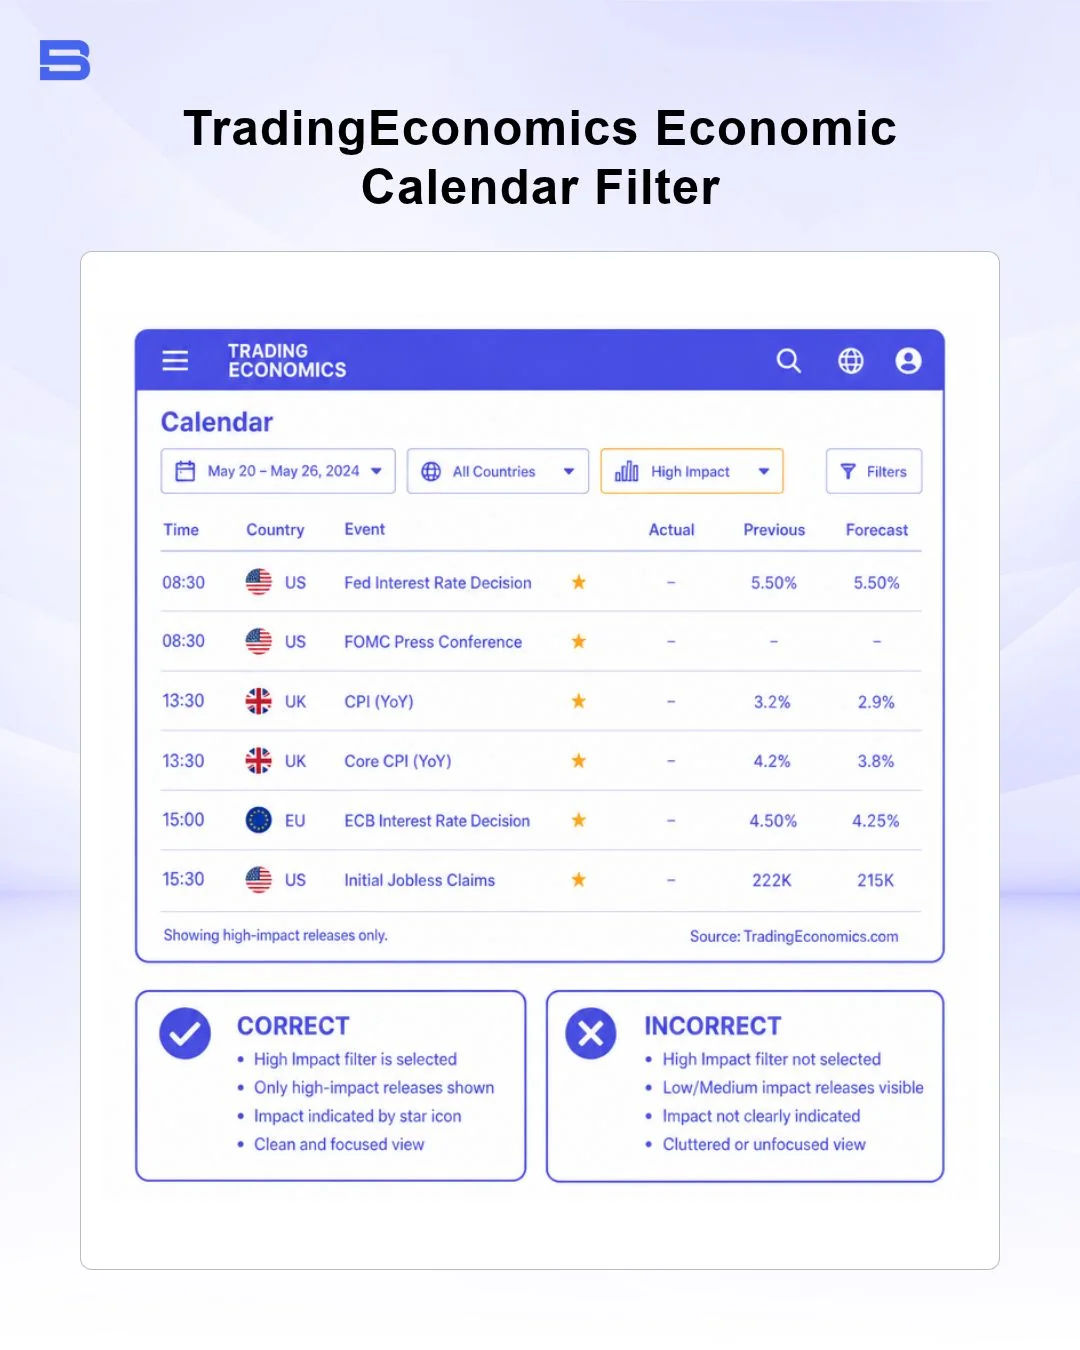
To use the calendar effectively without suffering from information overload, follow this structured filtering workflow:
- Select Jurisdiction: Filter the view to display only countries that directly impact your active watchlist (e.g., United States, Eurozone, Malaysia, Japan).
- Set Impact Filters: Sort releases by impact level—Low, Medium, or High (represented by color-coded indicators or star ratings). Focus your primary attention on High-impact events.
- Compare Figures: Observe three core metrics for any event: Previous (last period's result), Consensus (market consensus estimate), and Actual (the official figure released in real time).
Scenario Analysis: Trading a Central Bank Rate Release
Consider a real-world scenario involving a Bank Negara Malaysia (BNM) monetary policy decision. Markets have priced in a consensus expectation that the Overnight Policy Rate (OPR) will remain unchanged at 3.00%.
When the decision is announced, the Actual figure arrives at 3.25%—an unexpected 25 basis point hike. Because the actual figure diverged sharply from the market consensus, institutional repricing occurs immediately. USD/MYR experiences sharp downward pressure as the Ringgit strengthens on the higher yield outlook.
Trading high-impact economic releases involves substantial execution risk. During major releases, market liquidity can thin out dramatically as liquidity providers widen their spreads to mitigate risk.
This environment often leads to slippage—where market orders fill at prices significantly worse than requested—and order execution gaps that can bypass stop-loss levels. To manage market volatility safely, ensure your open positions are sized conservatively ahead of scheduled releases.
How Accurate Are TradingEconomics Forecasts?
In addition to reporting historical and real-time statistics, TradingEconomics provides proprietary forecasts for major indicators over weekly, quarterly, and multi-year horizons. Understanding how these projections are generated is vital for proper application.
TradingEconomics forecasts are derived using automated econometric models, historical time-series analysis, and consensus poll aggregations. These models evaluate long-term structural trends, seasonal adjustments, and leading economic indicators to project future readings.
It is critical to distinguish between official economic data and forward-looking projection models:
- Official Economic Statistics: Verified historical facts published directly by government statistical agencies and central banks.
- Forecast Models & Estimates: Statistical projections and opinions subject to continuous revision as new economic data becomes available.
Forecast models serve as valuable baseline expectations to help gauge market consensus, but they are not accurate predictions of future price action. Unforeseen geopolitical events, policy shifts, and sudden commodity price spikes frequently disrupt econometric projections. Use forecasts as context for market expectations rather than guaranteed directional signals.
TradingEconomics vs. Investing.com, Forex Factory, and Other Platforms
While TradingEconomics excels in raw macroeconomic data depth, retail traders often utilize alternative tools depending on their specific trading style and workflow. The comparison below illustrates how it stacks up against other widely used research tools:
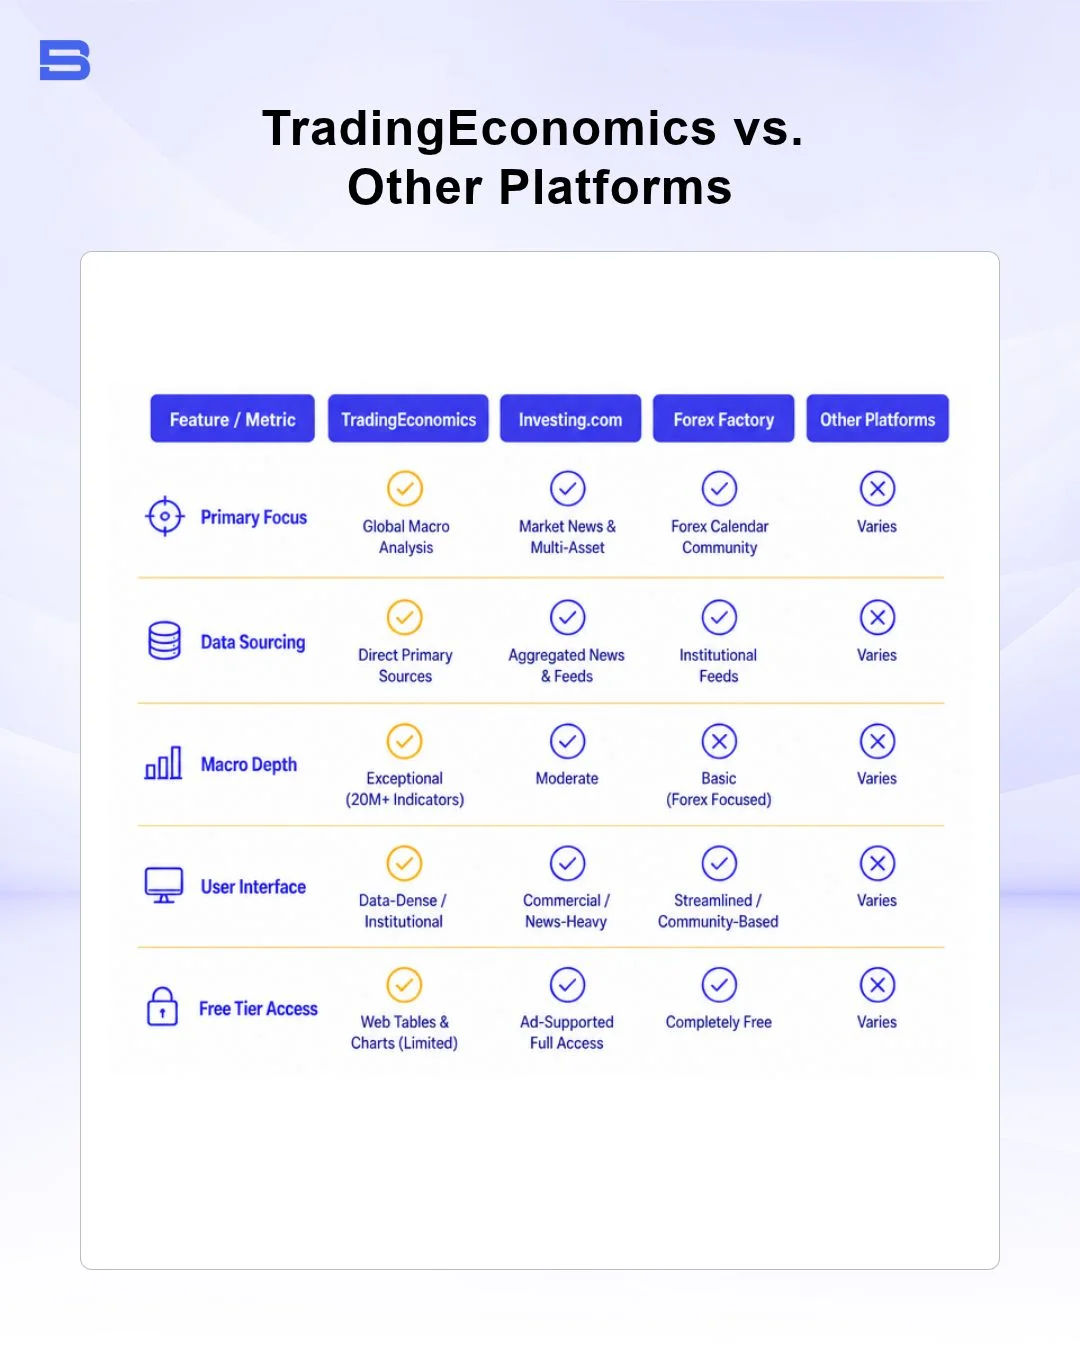
For traders evaluating distinct platform capabilities, selecting the right utility depends entirely on your daily analysis requirements:
- Choose TradingEconomics if you need direct, unedited historical economic data, international policy statistics, or institutional-level research across global jurisdictions.
- Choose Forex Factory if you require a simple, fast-loading economic calendar focused strictly on major currency pairs alongside active forum discussions. For a full guide on utilizing community-driven tools, check our breakdown on Forex Factory.
- Choose Investing.com or Yahoo Finance for quick retail stock coverage, multi-asset watchlist tracking, and breaking financial news summaries.
- Choose Myfxbook when you need to audit trading account performance, analyze equity curves, or evaluate trading journal statistics.
Is TradingEconomics Free to Use? Core Features vs. Paid Subscriptions
TradingEconomics operates on a freemium model. The public website allows free access to a massive archive of economic indicator tables, fundamental country pages, basic charting tools, and the economic calendar.
For casual retail users, the free web interface provides sufficient coverage to track scheduled central bank decisions and monitor key macroeconomic trends. However, free web access comes with rate limits, export restrictions, and limited historical charting depth.
Monitoring Sovereign Credit Ratings and Government Bond Yields
One of the most valuable features available on the platform is the sovereign credit rating matrix. TradingEconomics tracks national credit ratings across all three major credit rating agencies: Standard & Poor's (S&P), Moody's, and Fitch Ratings.
Alongside credit ratings, the platform monitors 10-year government bond yields across major developed and emerging economies. Comparing yield differentials—such as the spread between US 10-Year Treasury yields and Malaysian Government Securities (MGS)—provides macro traders with critical insights into cross-border capital flows and foreign exchange valuation trends.
TradingEconomics API and Data Export Capabilities
For quantitative traders, institutional funds, and developers building automated trading bots, TradingEconomics offers enterprise API solutions.
The TradingEconomics API provides programmatically structured access to millions of historical series, live indicators, and exchange rates. Users can query the API using JSON or CSV interfaces to build custom macroeconomic models in Python, feed algorithmic execution scripts, or stream live data directly into custom Excel financial sheets.
Final Thoughts
Understanding macroeconomic fundamentals is an essential component of long-term trading survival. In simpler terms, knowing what is happening in the economy helps traders understand the forces behind market movements and manage their trading decisions more effectively over time.
While short-term technical entries determine your risk-reward parameters, broader macroeconomic trends dictate the directional momentum of currency pairs, commodities, and equity markets.
Incorporating it into your pre-market routine ensures you remain informed on central bank policies, sovereign yields, and scheduled volatility events before placing capital at risk.
- Proprietary Trading Explained: What It Is and Its Key Benefits
- TradingView: Features, Broker Integration, and Strategies
- cTrader: How It Works and How It Compares
- What Is a VPS for Trading and Do You Need One?
- Thinkorswim Trading: Features, Tools, and Availability
- Trading Platform Malaysia: What to Look For
- Bursa Anywhere: A Guide to Managing Shares in Malaysia
- What Is Forex Factory and How Do Traders Use It?
- Delta App: Multi-Asset Portfolio Tracker for Crypto & Stocks
- What Is Trading Central and How to Use It?
- What Is Simply Wall St and How to Use It
- What Is Seeking Alpha and How to Use It
- What Is MarketWatch and How to Use It
- What Is Barchart and How to Use It
- Google Finance Explained: How to Track Stocks and Markets
- What Is Finviz and How to Use It for Stock Screening
- What Is Yahoo Finance and How to Use It
- What Is TradingEconomics and How to Use It
- StockCharts Review 2026: Features, Pricing, and Performance
- What Is ZuluTrade and How Does Copy Trading Work on It?
- What Is Investing.com and How to Use It?
- What Is Myfxbook and How Do Traders Use It?
- What Is CoinGecko? A Complete Guide to Crypto Data Tracking
- What Is CoinMarketCap and How to Use It
- What Is CoinStats and How to Use It for Portfolio Tracking
- What Is Sharesight and How to Use It for Portfolio Tracking
- What Is Personal Capital and How to Use It
- What Is a Low Spread Broker? How It Affects Your Trading
- What Is an Introducing Broker (IB) in Forex?
- What Is Social Trading? How Copy Trading Platforms Work
- What Is a PAMM Account? How Managed Forex Accounts Work
- What Is a Margin Account and How Does Margin Trading Work?
- What Are Trading Signals and How Do They Work?
- What Is an Expert Advisor (EA) in Forex Trading?
Disclaimer: The content on this page is intended for educational and informational purposes only. It does not constitute financial, investment, tax, or legal advice, and should not be interpreted as a recommendation to buy, sell, or hold any financial instrument or asset. Trading and investing involve significant risk, including the possible loss of your entire capital. Products such as forex, CFDs, and cryptocurrencies carry additional risks due to leverage, high volatility, and limited regulatory protection in some jurisdictions. Past performance of any financial instrument does not guarantee future results. Any market views, forecasts, or opinions expressed are those of the author at the time of writing and may not reflect current market conditions. Platform features, fees, and regulatory status are subject to change — always verify information directly with the relevant provider or regulator before making any financial decision. BrokerSpecs may receive compensation from third parties featured on this site. Always conduct your own due diligence and consider seeking advice from a licensed financial professional before investing. Portions of this article were prepared with the assistance of AI tools and reviewed by our editorial team before publication.