


Related Tags
You are sitting in front of your screen, watching a currency pair or stock you just bought. For hours, the price creeps along in a tight, predictable range, moving just a few cents at a time. Then, at precisely 8:30 AM, an economic report drops.
Within 40 seconds, the price spikes up by 2%, plummets down by 4%, and bounces right back to where it started. Your heart races, your stomach drops, and you watch your unmanaged profit turn into an unexpected margin call.
That sudden, aggressive movement isn't market chaos—it is volatility in action. For beginner traders, market conditions are often terrifying. For experienced market participants, it is the fundamental fuel that powers trading profits. Understanding what volatility is, what causes it, and how to manage its risks is the exact turning point where a trader moves from gambling to disciplined speculation.
What Is Volatility in Trading?
At its core, volatility measures the speed and magnitude of price changes for a financial asset over a given period. When market analysts talk about what is volatility in trading, they are referring to how wildly and rapidly price action swings away from its average value.
To keep it simple, market conditions break down into two distinct states:
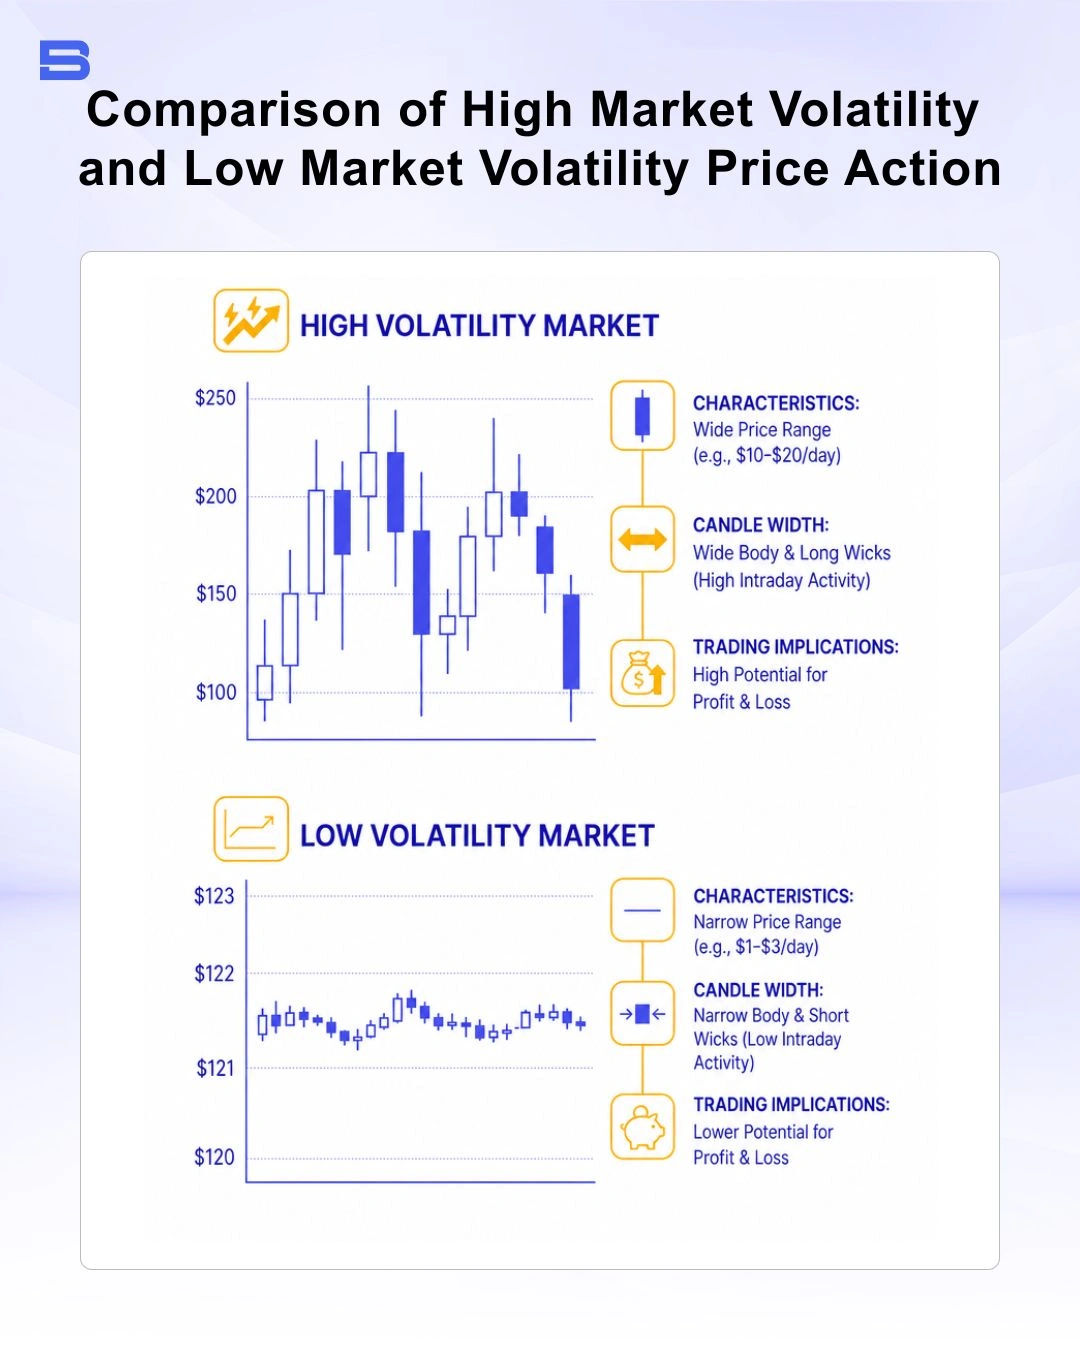
- High Volatility: Prices move rapidly over short timeframes, making large price swings in either direction. Spreads can widen, and market risk increases significantly.
- Low Volatility: Prices move slowly and stay within a narrow range. The market is calm, predictable, and moves smoothly, but profit opportunities per trade are generally smaller.
In statistical terms, analysts measure this using standard deviation—calculating how far prices disperse from their mean. However, you don't need a math degree to evaluate market conditions on your trading platform.
Worked Example: High vs. Low Volatility Impact
To see how volatility directly affects your portfolio, consider two hypothetical stocks trading at $100 per share:
- Stock A (Low Volatility): Typically moves within a range of $2 a day. A standard intraday swing might push the price from $100 to $102 before settling back down.
- Stock B (High Volatility): Experiences daily fluctuations of $10. Within hours, the price can swing between $90 and $110.
If you buy 100 shares of Stock A, your account equity fluctuates by roughly $200 throughout the day. You have plenty of time to execute your strategy without extreme emotional pressure.
If you buy 100 shares of Stock B, your account equity swings wildly by $1,000 within the same period. If you do not adjust your risk controls, Stock B can trigger a stop-loss order almost immediately simply due to normal market noise, whereas Stock A lets your trade setup play out gracefully. High volatility increases both your potential reward and your potential for rapid losses.
In highly volatile markets, a drawdown can deepen quickly, depleting your account equity well before a margin call is triggered.
What Causes Market Volatility?
Markets do not move randomly; price swings spike when new information disrupts the consensus price of an asset. Understanding the root drivers of market volatility allows traders to anticipate turbulent market conditions before they hit their open positions.
Key Drivers of Market Volatility
- Economic Data Releases: Major macroeconomic indicators—such as Consumer Price Index (CPI) inflation reports, Non-Farm Payrolls (NFP) employment data, and central bank interest rate decisions—frequently ignite sudden price spikes across forex, equities, and commodities.
- Corporate Earnings Reports: When a public company reports quarterly earnings that wildly beat or miss Wall Street consensus estimates, the stock price can jump or gap downward significantly overnight.
- Geopolitical Events: Political elections, international trade disputes, policy shifts, and global conflicts introduce widespread uncertainty, causing investors to panic-sell risk assets and rush into safe havens.
- Liquidity Shortages: When there are few buyers or sellers in a market (low liquidity), even a modest institutional buy or sell order can sweep through the order book, creating massive, sudden price gaps.
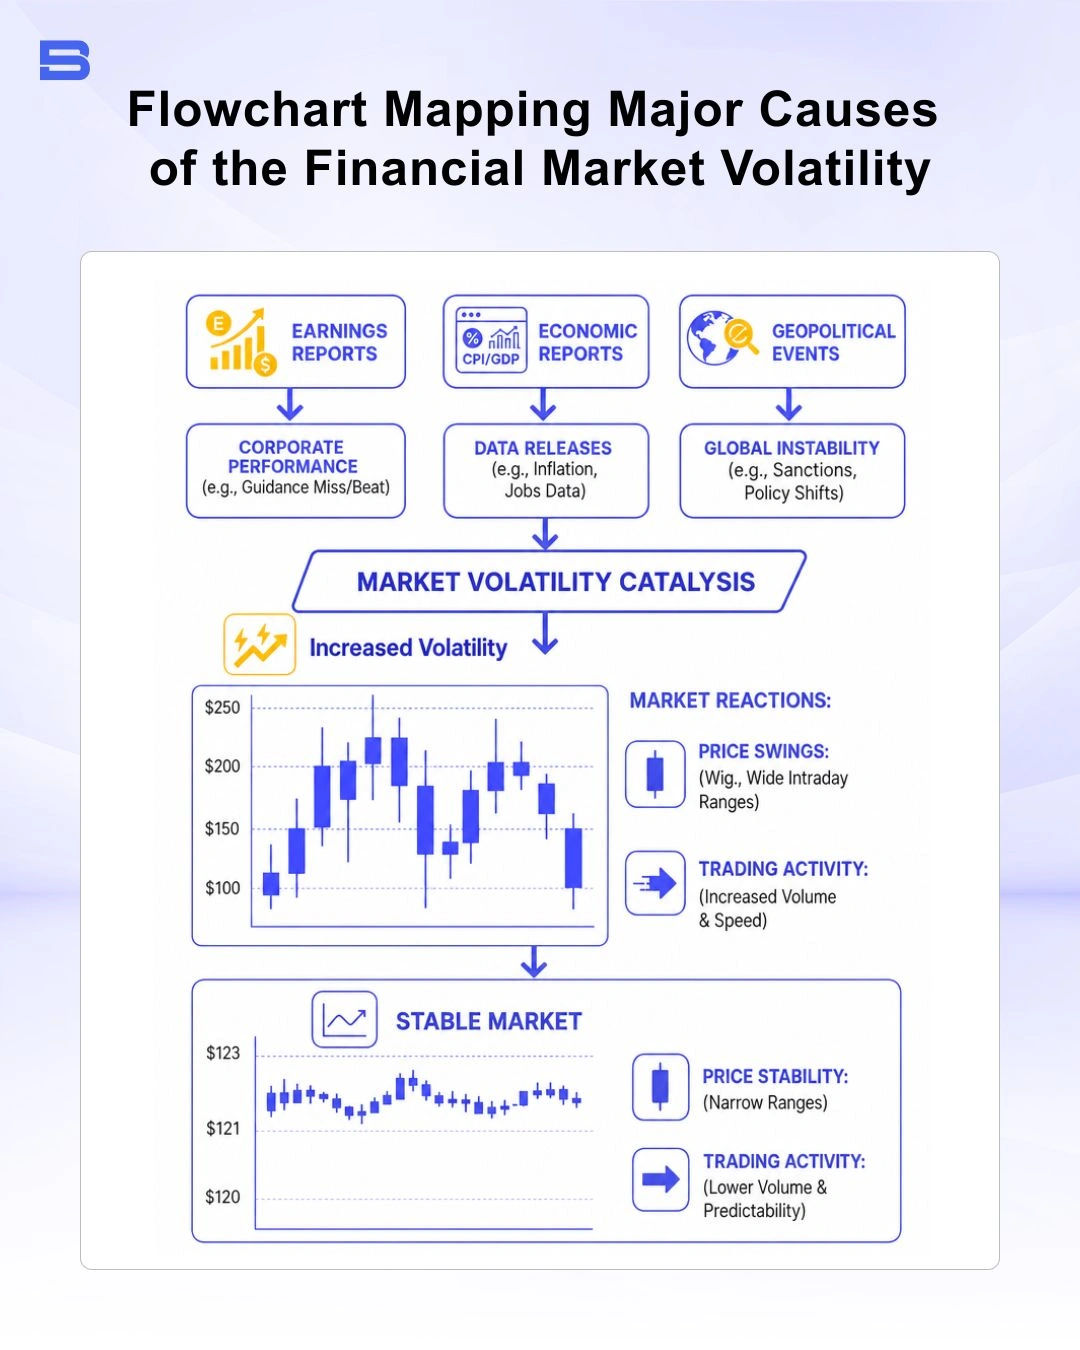
Knowing when these events occur is the first line of defense in effective market risk control.
Is High Volatility Good or Bad for Trading?
Whether market turbulence is your greatest ally or your worst enemy depends entirely on your strategy, risk discipline, and trading timeframe.
The Double-Edged Sword
For active day traders and swing traders, volatility is essential. Without price movement, short-term trading is virtually unviable; you need price expansion to catch meaningful moves and realize profits within short holding periods. A completely flat market yields very little room for capital growth.
Conversely, for long-term buy-and-hold investors, short-term volatility is often just background noise—or a potential psychological trap that causes premature panic selling.
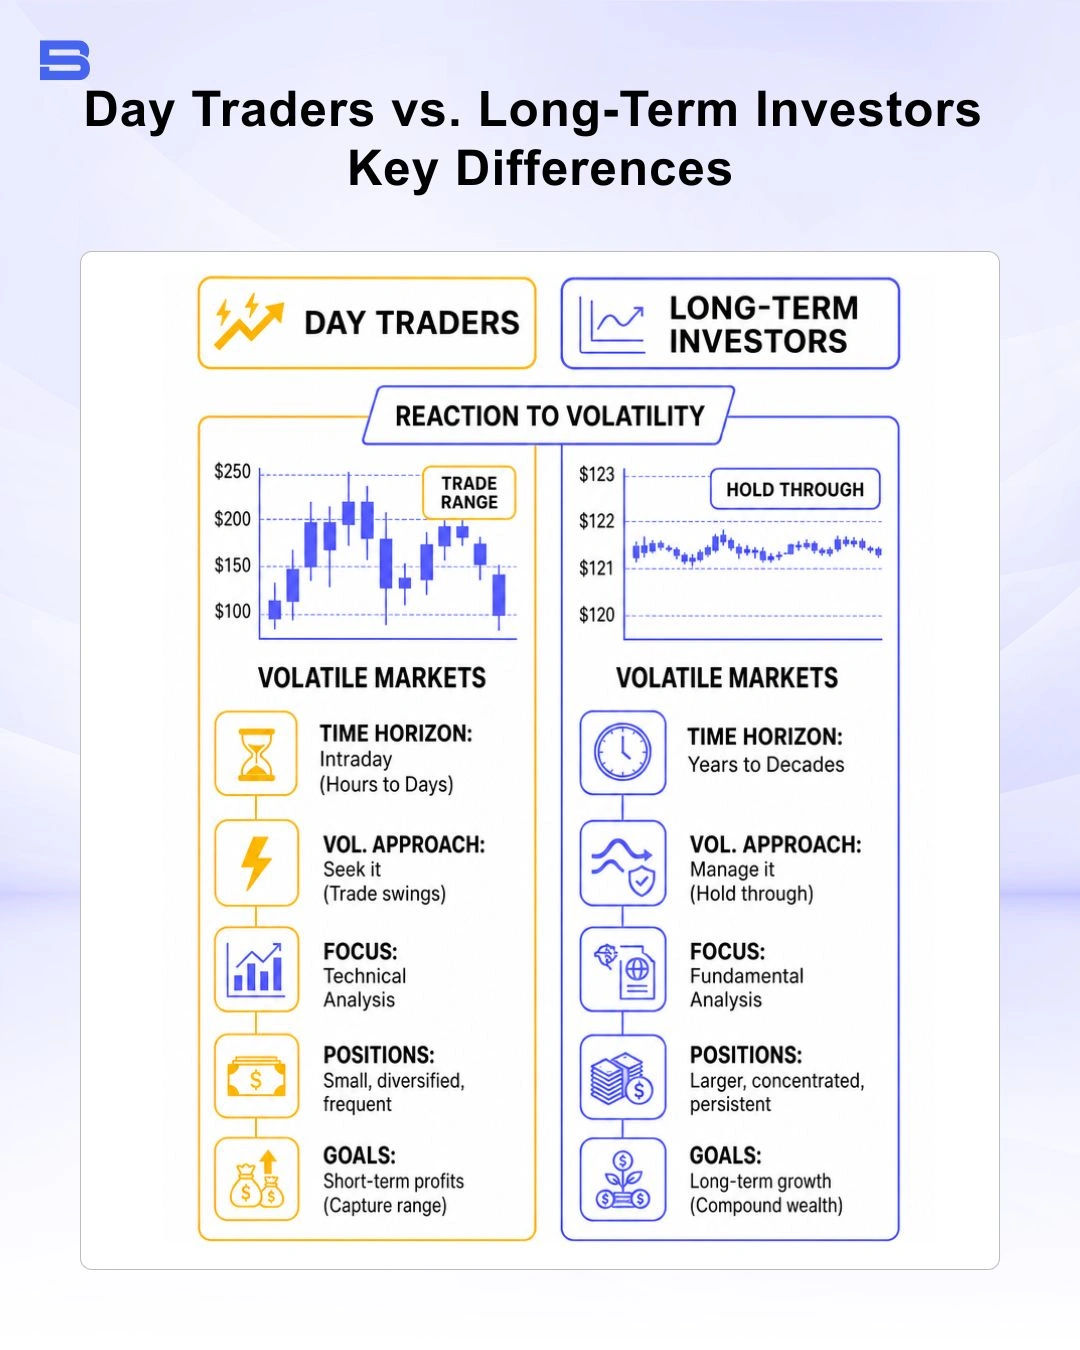
The key takeaway is clear: high volatility isn't inherently bad, but it acts as an amplifier. It rewards precise strategy execution and ruthlessly punishes bad risk management.
Managing Volatility Risk in Your Portfolio
Trading during turbulent conditions without a plan is a fast track to account blowouts. Successful traders rely on disciplined techniques for managing volatility risk to protect capital when prices swing wildly.
Essential Volatility Management Tools
- Adjust Position Sizing: When market volatility rises, widen your stop-loss distance to avoid being prematurely stopped out by market noise—and reduce your trade size proportionally to maintain identical dollar risk.
- Utilize Stop-Loss Orders: Most traders define their exit point before entering a position, though the exact placement depends on your individual strategy and risk tolerance.
- Track the Volatility Index (VIX): Monitor market-wide fear gauges like the CBOE (Chicago Board Options Exchange) Volatility Index (VIX). High VIX readings indicate elevated market anxiety and expected wider price swings.
- Diversification and Hedging: Spread capital across uncorrelated asset classes or open temporary hedging positions to offset downside exposure during market turbulence.
Worked Scenario: Protecting Capital in Volatile Markets
Imagine your trading account has a balance of $10,000, and your strict risk rule is to risk no more than 1% ($100) on any single trade.
Scenario A (Normal Market Conditions):
Asset Price: $100
Stop-Loss Distance: $2 below entry ($98)
Position Size: 50 shares ($100 total risk / $2 stop distance = 50 shares)
Scenario B (High Volatility Event):
Asset Price: $100
Expected Price Swings: Increased volatility requires a wider stop-loss of $5 below entry ($95) to give the trade room to breathe.
Position Size Calculation: $100 total risk / $5 stop distance = 20 shares
By scaling down your position size from 50 shares to 20 shares, you give your trade the required breathing room to survive wild price swings while maintaining your exact maximum risk parameter ($100). That is how systematic risk management keeps you in the game.
Key Takeaways: Market Volatility Explained
Market volatility is neither inherently good nor inherently bad—it is simply a fundamental reality of financial markets. While unpredictable price swings can wipe out unprepared traders who over-leverage their positions, those same movements offer exceptional risk-reward opportunities for disciplined traders who respect risk controls.
By learning to identify the causes of market volatility, tracking key volatility indicators, and adjusting your position sizing to fit prevailing market conditions, you transform volatility from an intimidating threat into a calculated trading advantage.
- What Is Trading and How Does Trading Work?
- Trading Fundamentals: A Guide for Beginners
- Trading vs. Investing: What Are the Key Differences?
- Trading Terms and Terminologies Every Beginner Should Know
- Common Trading Mistakes Beginners Make and How to Avoid
- Understanding Risk and Reward in Trading: A Complete Guide
- Guide to the Different Types of Financial Markets
- Investment Basics: Definition, Strategies, and How to Invest
- Benefits of Investing: Financial Growth and Security
- What Is Swing Trading? A Practical Guide For Beginners
- What Is Spot Trading? A Guide for Beginners
- What Are Futures in Trading? A Guide for Beginners
- Understanding Bull Markets: Growth & Strategy
- How to Read a Candlestick Chart: A Guide for Beginners
- Is Trading Gambling? The Truth About Risk
- Pip in Forex: How It Works & How to Calculate It
- What Is the Bid-Ask Spread in Trading? A Guide for Beginners
- What Is a Margin Call? A Guide for Beginners
- Market Volatility Explained: What It Is and How to Trade It
- Drawdown in Trading: Meaning, Math, and Risk
- Understanding Slippage in Trading: Causes and Control
- Forex Lot Size Explained: Standard, Mini & Micro
- Trailing Stop vs Stop Loss: Essential Risk Strategy
- How Asset Allocation Works: Strategies Explained
- Understanding Market Trading Hours & Sessions
- Market Makers Explained: A Trader's Guide
- Portfolio Diversification: A Strategy Guide
- Capital Gains Explained: How Investment Taxes Work
- Stock Market Circuit Breakers: How Trading Halts Work
- What Is an IPO? How Initial Public Offerings Work
- What Is a Secondary Market? A Complete Guide
- What Is a Stock Exchange? Functions and Overview Explained
- Understanding Ticker Symbols: A Market Guide
- How Clearing Houses Work in Financial Markets
- Stock Market After Labor Day: Trends and What To Expect
Disclaimer: The content on this page is intended for educational and informational purposes only. It does not constitute financial, investment, tax, or legal advice, and should not be interpreted as a recommendation to buy, sell, or hold any financial instrument or asset. Trading and investing involve significant risk, including the possible loss of your entire capital. Products such as forex, CFDs, and cryptocurrencies carry additional risks due to leverage, high volatility, and limited regulatory protection in some jurisdictions. Past performance of any financial instrument does not guarantee future results. Any market views, forecasts, or opinions expressed are those of the author at the time of writing and may not reflect current market conditions. Platform features, fees, and regulatory status are subject to change — always verify information directly with the relevant provider or regulator before making any financial decision. BrokerSpecs may receive compensation from third parties featured on this site. Always conduct your own due diligence and consider seeking advice from a licensed financial professional before investing. Portions of this article were prepared with the assistance of AI tools and reviewed by our editorial team before publication.