
site logo
Background

Beginners

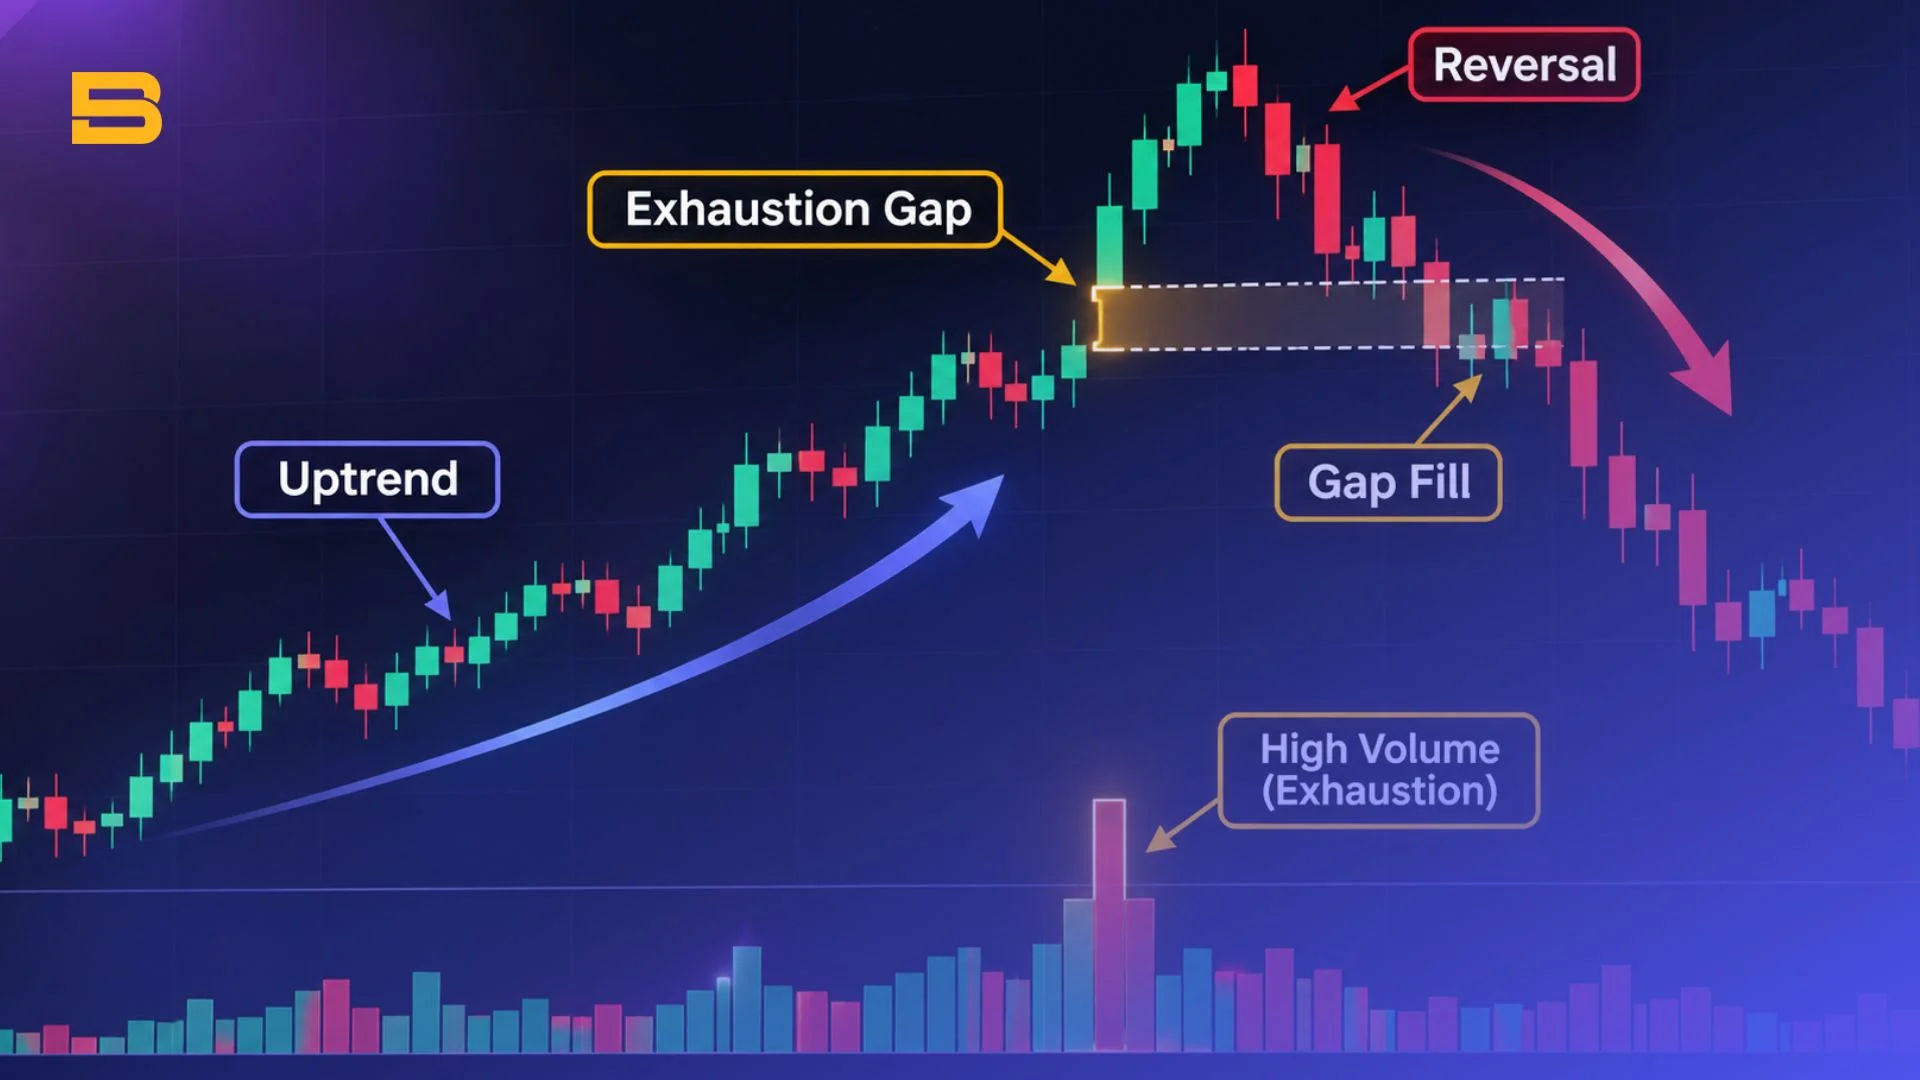
Candlestick chart illustrating an exhaustion gap at the top of an uptrend followed by a gap fill reversal

Exhaustion Gap: A Warning Sign of a Trend Reversal

Learn what an exhaustion gap is, how to spot it on price charts, and how to separate it from runaway gaps with disciplined risk rules. Read more.

Last Updated:
Price chart illustrating a bullish runaway gap forming mid-trend with increased trading volume

What Is a Runaway Gap? Confirming Trend Continuation

Learn what a runaway gap is, how to spot mid-trend momentum shifts, calculate measuring-gap targets, and manage gap slippage risks. Find out how today.

Last Updated:
Price chart illustrating the transition from a downtrend into a sideways accumulation phase and upward breakout

Accumulation Phase: How Smart Money Builds a Position

Learn what the accumulation phase is in trading, how to spot Wyckoff stages and volume signals, and how to avoid false breakdowns. Read the guide.

Last Updated:
Chart diagram illustrating a bullish breakaway gap escaping a consolidation range on high volume

What Is a Breakaway Gap? A Signal of a New Trend Starting

Learn what a breakaway gap is in trading, how to confirm it with volume, and how to set stop-loss levels across stocks and forex. Find out how it works.

Last Updated:
Chart diagram illustrating a bull trap false breakout above resistance and subsequent price drop

What Is a Bull Trap? How False Breakouts Fool Buyers

Learn what a bull trap is, why false breakouts happen near key resistance, and how to manage risk with volume and stop-loss rules. Find out more.

Last Updated:
Chart diagram illustrating a bear trap false breakdown below support followed by a bullish reversal

What Is a Bear Trap? How False Breakdowns Fool Sellers

Learn what a bear trap is in trading, how false breakdowns below support squeeze short sellers, and how to confirm reversals. Find out how to manage risk.

Last Updated:
Thanksgiving trading hours schedule across US stocks, forex, commodities, and crypto

Thanksgiving Trading Hours Guide for Retail Traders

Explore 2026 Thanksgiving trading hours for US stocks, bonds, forex, gold, and crypto in ET and MYT, plus market closures, early sessions, and spread risks.

Last Updated:
Gravestone doji candlestick forming at resistance on a financial price chart

Gravestone Doji Candlestick: A Bearish Reversal Signal

Learn how the gravestone doji candlestick signals buyer exhaustion at resistance, spot false breakouts, and place disciplined stops. Learn more.

Last Updated:
Anatomy of a dragonfly doji candlestick showing long lower shadow and equal open high close

What Is a Dragonfly Doji? A Bullish Reversal Candlestick Signal

Master the dragonfly doji candlestick pattern. Learn how to identify its structure, confirm bullish reversals, and place precise stop-loss orders.

Last Updated:
Blue and gold full-bodied blocks illustrating bullish and bearish marubozu candlesticks

What Is a Marubozu Candlestick? A Sign of Strong Momentum

Learn what a Marubozu candlestick is, how its full-body anatomy signals strong momentum, the three variations to spot, and how to manage risk. Learn more.

Last Updated:
Forex liquidity provider order routing diagram from retail trader to Tier 1 interbank market

Liquidity Provider Forex Guide: How Broker Pricing Works

Liquidity provider forex basics: learn how retail brokers access wholesale interbank pricing, route orders via FIX API, and manage slippage risk.

Last Updated:
Diagram comparing public lit exchange order book with private dark pool midpoint execution

Dark Pool Trading: How Institutions Trade Off-Exchange

Discover how dark pool trading works, why institutions use off-exchange midpoint execution, and the regulatory oversight governing hidden liquidity. Learn more.


Last Updated: