


Related Tags
Navigating corporate earnings reports, balance sheet filings, and valuation multiples can quickly turn overwhelming for retail investors. While financial statements are full of essential data, raw numbers rarely tell a clear story at first glance. Simply Wall St approaches stock analysis differently by transforming institutional-level financial data into structured visual charts, helping you evaluate listed companies without getting buried in spreadsheets.
What Is Simply Wall St?
Simply Wall St is an online stock analysis and screening platform designed to simplify visual fundamental analysis for equity investors. The platform automatically ingests raw financial statements, analyst consensus estimates, and insider trading records, converting them into standardized graphical reports.
The tool relies on data provided by S&P Global Market Intelligence—a Tier 1 financial data vendor used by institutional investment banks—to cover over 100,000 listed stocks globally. Instead of requiring you to manually compile financial ratios or build Discounted Cash Flow (DCF) spreadsheets, it processes historical financial data, forward projections, and risk metrics automatically to output visual summaries.
Who Is Simply Wall St Best Suited For?
Simply Wall St is primarily designed for beginner to intermediate long-term equity investors who want to assess stock fundamentals visually. If you are a swing trader or day trader looking for real-time technical indicators, order flow data, or intra-day charts, this platform will not fit your trading style.
Instead, it serves investors building long-term portfolios who want a fast, standardized way to screen candidates across profitability, balance sheet strength, dividend reliability, and fair value metrics before conducting deeper manual due diligence.
How the Snowflake Model Works
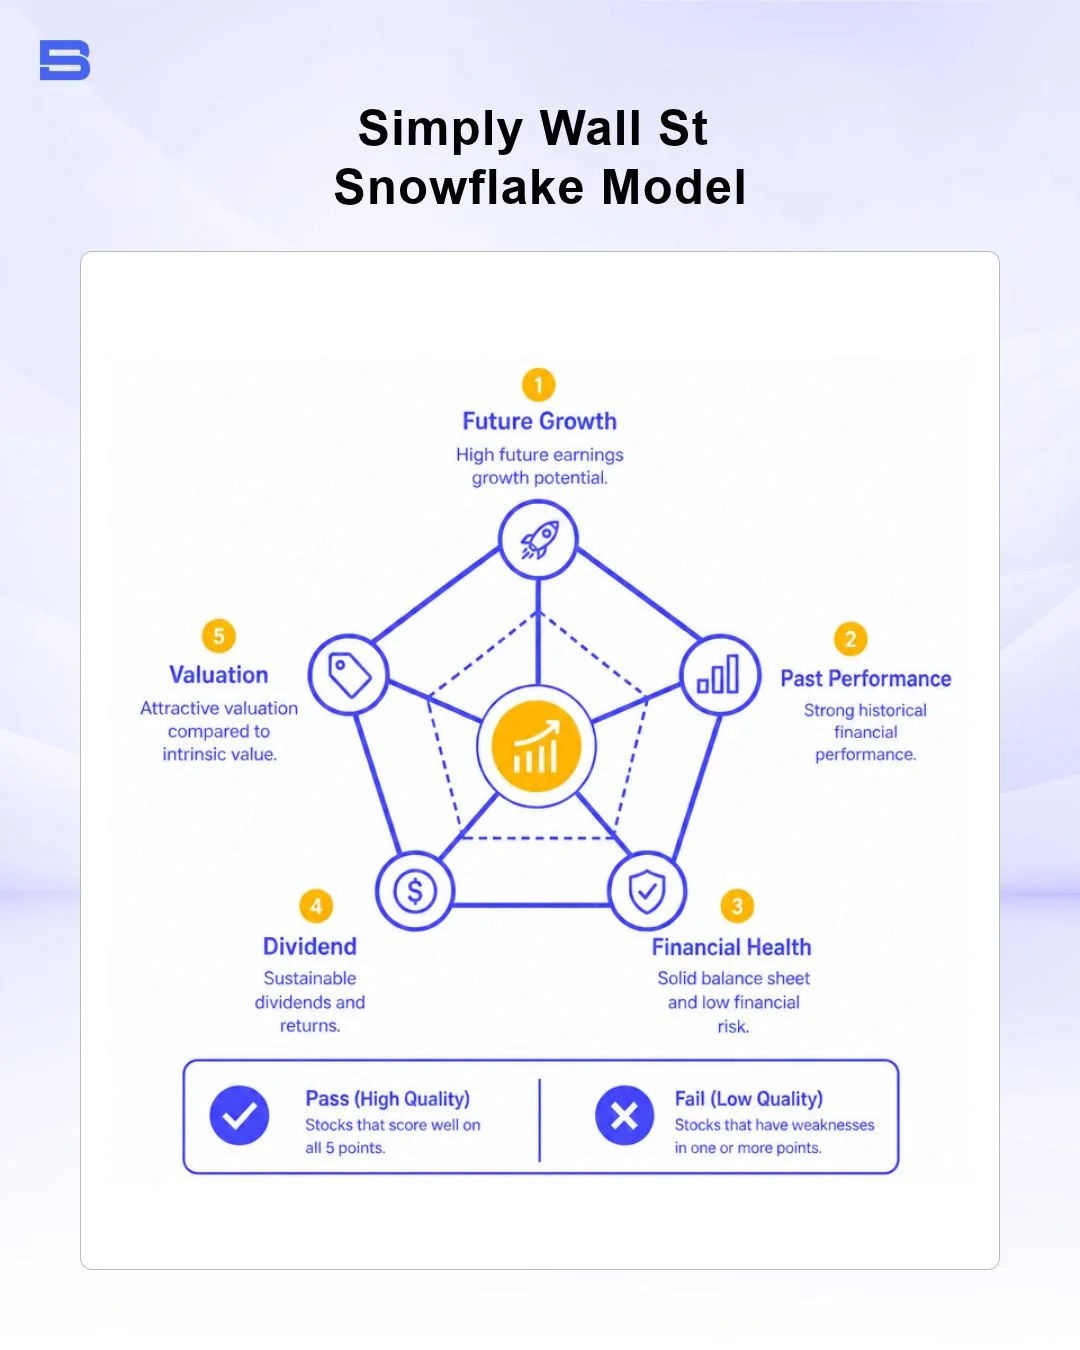
At the heart of Simply Wall St’s visual engine is its proprietary "Snowflake" chart. The Snowflake is a 5-axis radar chart that visually summarizes a company’s fundamental status across five core dimensions:
- Valuation: Assesses whether a stock is trading above or below its calculated fair value based on cash flow projections and comparative multiples.
- Future Growth: Evaluates expected revenue, earnings, and return on equity (ROE) trajectories over the next 1 to 3 years using sell-side analyst estimates.
- Past Performance: Checks historical earnings growth, profit margins, and return metrics over 1-year and 5-year trailing periods.
- Financial Health: Analyzes balance sheet leverage, interest coverage, liquidity, and long-term vs. short-term debt obligations.
- Dividend Quality: Examines dividend yield, payout ratios against both net profit and free cash flow, and historical payout stability over 10 years.
Reading the 5 Core Metrics
Each axis on the Snowflake chart contains up to 6 distinct pass/fail quantitative checks (a total of 30 underlying checks across the entire graphic).
When a stock meets a specific check—such as maintaining short-term assets greater than short-term liabilities—it earns a point on that axis. The more checks a company passes, the farther outward the Snowflake expands along that specific vector. A perfectly balanced, high-scoring stock displays a broad, symmetrical shape, whereas a company burdened by high debt or weak growth shows a collapsed or truncated visual profile.
Data Accuracy and DCF Valuation Methodology
A central question investors ask when evaluating research tools is: Is Simply Wall St accurate?
From a raw data perspective, the platform maintains high accuracy because its underlying corporate filings, historical balance sheets, and analyst forecasts are pulled directly from S&P Global Market Intelligence. However, accuracy in fundamental analysis depends heavily on the assumptions embedded within automated valuation models.
How Automated DCF Fair Value Is Calculated
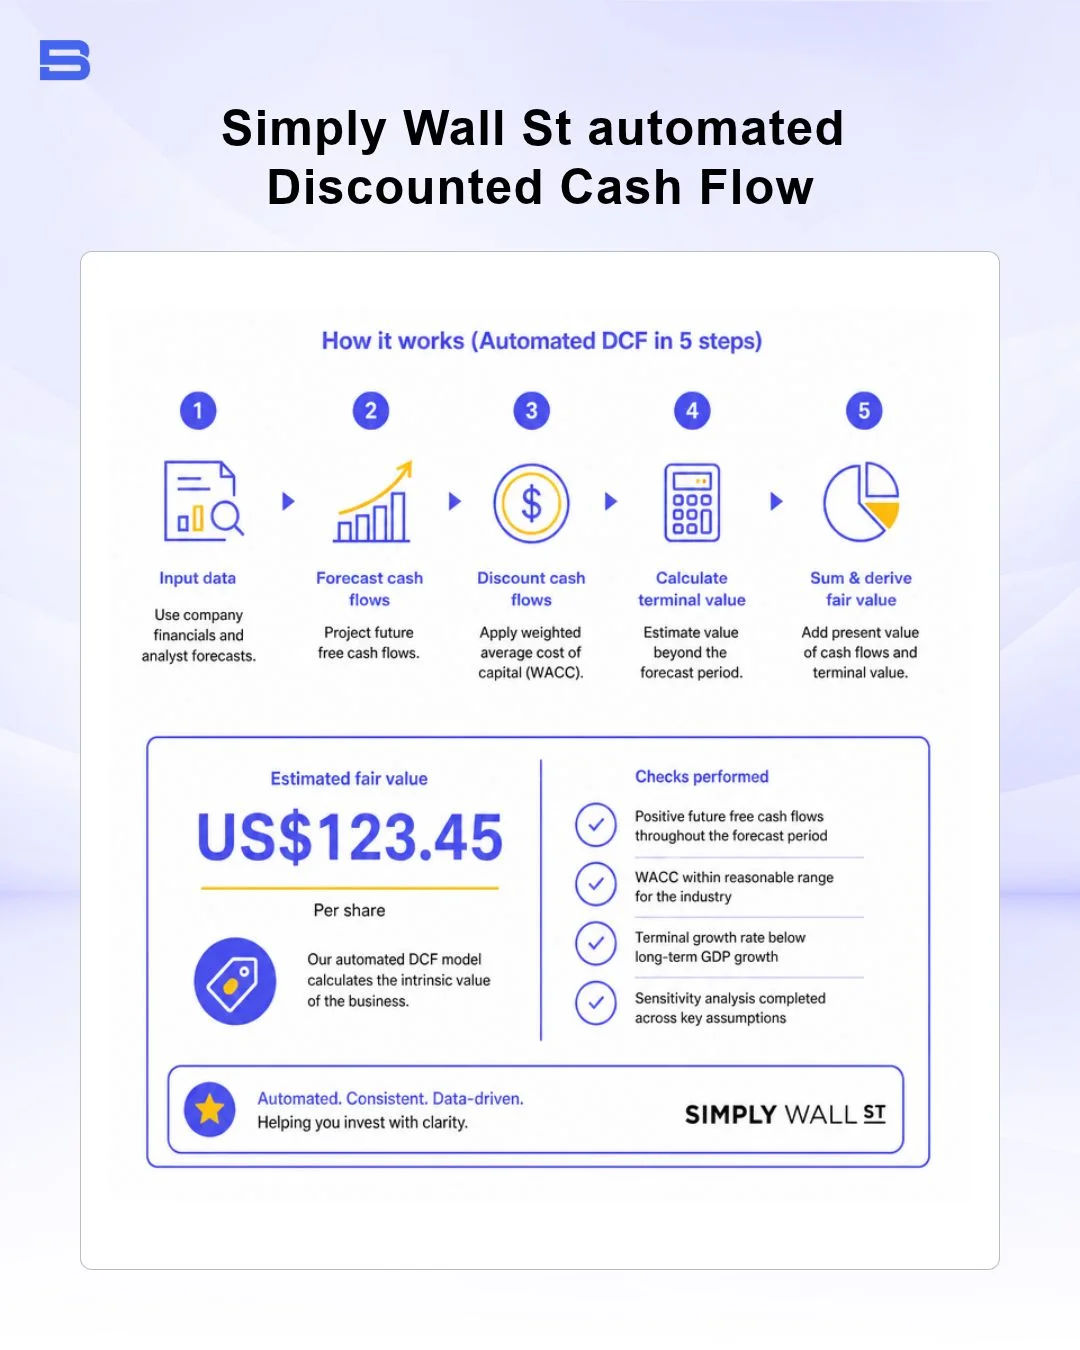
To estimate whether a stock is trading at a discount or premium, Simply Wall St uses an automated 2-stage Discounted Cash Flow (DCF) model for non-financial equities.
- Stage 1 (High Growth Period): The platform takes analyst consensus forecasts for leveraged free cash flow (FCF) over the next 3 to 5 years. If analyst estimates are unavailable for subsequent years, the platform extrapolates FCF growth using historical averages or industry benchmarks.
- Stage 2 (Terminal Value Period): Beyond the explicit forecast period, the platform calculates a terminal value by projecting cash flows into perpetuity using a terminal growth rate (typically tied to long-term government bond yields, such as 2.0% to 2.5%).
- Discounting Cash Flows: Future cash flows are discounted back to present value using a calculated Cost of Equity derived from the Capital Asset Pricing Model (CAPM).
Worked Valuation Scenario:
Consider a hypothetical stock trading at $100 per share with current annual Free Cash Flow per share of $5.00.
- Stage 1 (Years 1–5): Analysts project FCF to grow at 10% annually ($5.50, $6.05, $6.66, $7.32, $8.05). Discounted at an 8.5% Cost of Equity, the present value of Stage 1 cash flows equals $26.42.
- Stage 2 (Terminal Value): Assuming a 2.5% terminal growth rate and 8.5% discount rate, the terminal value is calculated as $8.05 × (1 + 0.025) / (0.085 - 0.025) = $137.52. Discounted back 5 years to present value, Stage 2 equals $91.46.
- Calculated Fair Value: $26.42 + $91.46 = $117.88 per share.
- Result: The automated model indicates the stock ($100) is trading at a 15.2% discount to fair value.
Limitations of Automated Valuation Models
While automated DCF models offer a helpful starting baseline, relying entirely on automated valuation outputs carries distinct risks:
- Sensitivity to Discount Rates: Small tweaks to the Cost of Equity or Beta inputs can swing calculated fair values by as much as 20% to 40% in some scenarios, depending on the underlying assumptions.
- Financial Sector Inapplicability: Traditional DCF models are ineffective for banks, insurance firms, and Real Estate Investment Trusts (REITs) because cash flow definitions differ. The platform uses Dividend Discount Models (DDM) or Price-to-Earnings/Net Asset Value multiples for these sectors instead.
- Analyst Consensus Lag: When market conditions change rapidly, sell-side analyst forecasts may lag behind current economic realities, distorting Stage 1 growth projections.
Simply Wall St Pricing: Free vs. Paid Tiers
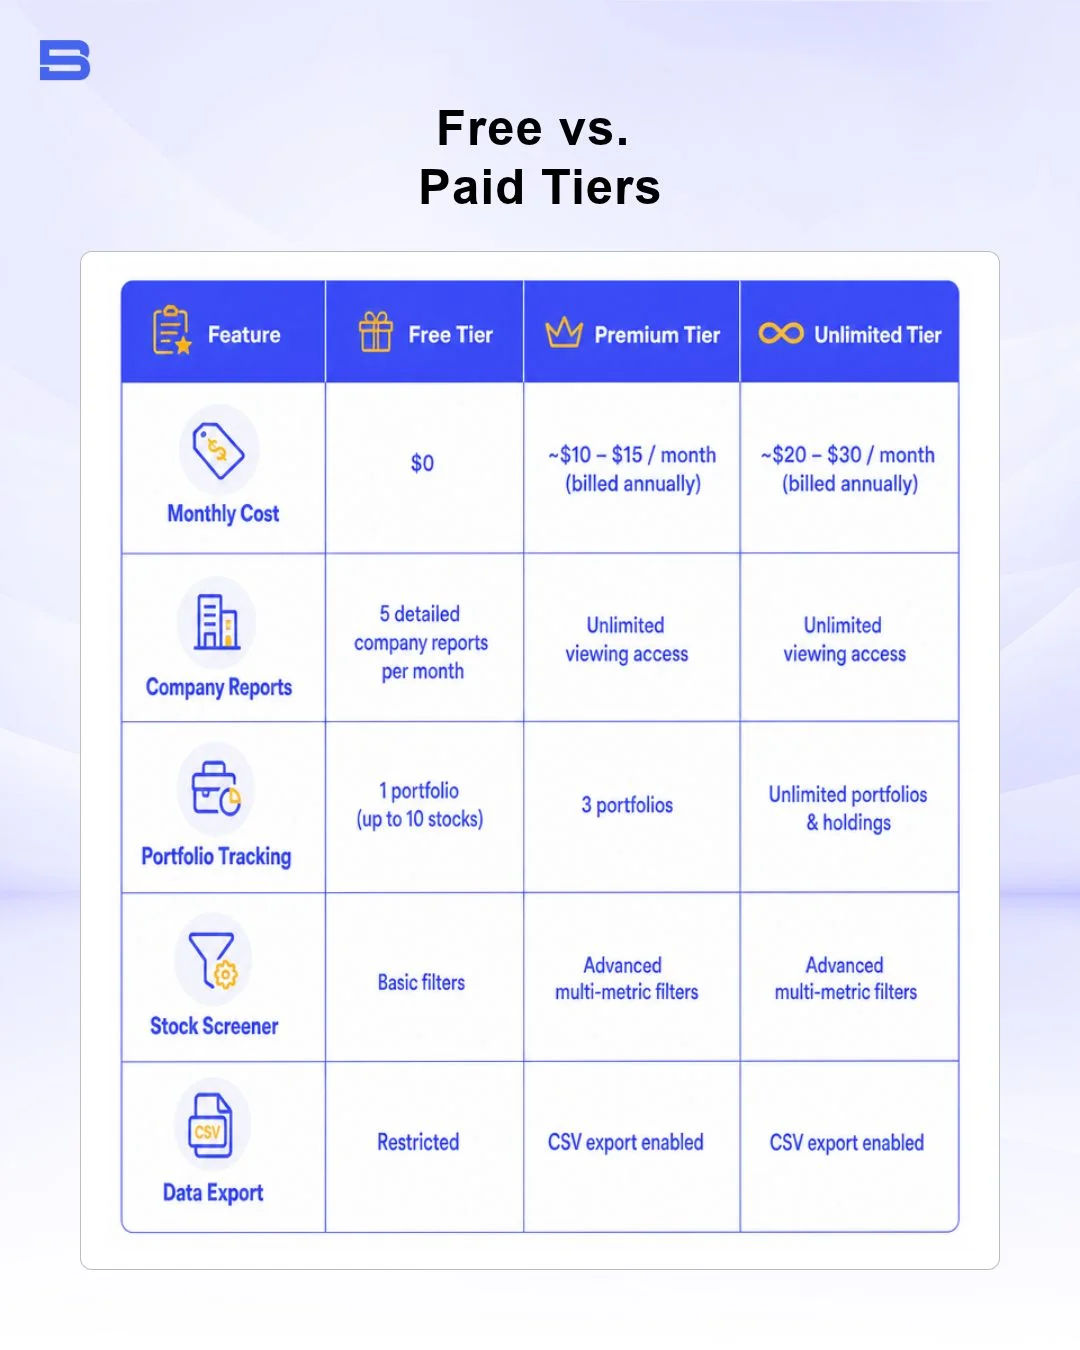
It operates on a freemium subscription model. If you are exploring the platform, you can access core features without providing credit card details, though report volume is capped.
Is Simply Wall St Worth Paying For?
For casual long-term investors managing a single personal portfolio, the Free tier provides sufficient monthly reports to check quarterly earnings updates or research new ideas.
If you actively manage multiple portfolios, perform extensive stock screening across international exchanges, or require raw CSV exports to integrate into personal spreadsheets, upgrading to a paid plan provides substantial utility by removing strict viewing limits.
Simply Wall St vs. Alternatives: Seeking Alpha and Finviz
When selecting stock screening tools, comparing Simply Wall St to other popular research hubs helps determine which platform matches your workflow.
- Simply Wall St vs. Seeking Alpha: Seeking Alpha emphasizes crowdsourced contributor research, qualitative thesis building, and earnings call transcripts, whereas Simply Wall St focuses more heavily on quantitative fundamental metrics and visual scoring models. Each platform caters to different research styles. Seeking Alpha is better for qualitative analysis, while Simply Wall St offers faster visual scanning of fundamental health.
- Simply Wall St vs. Finviz: Finviz is a quantitative stock screener favored by traders interested in technical filters, heatmaps, and chart pattern recognition, as well as fundamental metrics like balance sheet composition and valuation multiples.
- Simply Wall St vs. Yahoo Finance & Google Finance: Free portals like Yahoo Finance and Google Finance provide raw quote streaming, corporate press releases, and fundamental summary statistics. They lack the automated DCF modelling and standardized visual Snowflake scoring found on Simply Wall St.
- Simply Wall St vs. Investing.com, MarketWatch & TradingEconomics: Platforms like MarketWatch, Investing.com, and TradingEconomics excel at real-time global macroeconomic headlines, economic calendars, and market news streams. Simply Wall St zeroes in specifically on company-level fundamental health rather than macro news tracking.
For example, a retail investor using Simply Wall St's DCF model might discover that a mid-cap technology stock trading at $45 per share carries a fair value estimate of $62, signaling 38% upside potential. The platform's automated Snowflake scoring provides a visual flag—red or green—to confirm whether the stock is trading below its intrinsic value, helping the investor prioritize research efforts.
Conclusion
Simply Wall St provides retail investors with a clean, highly visual approach to understanding balance sheets, analyst projections, and valuation metrics. By standardizing thousands of financial data points into intuitive Snowflake charts and automated DCF models, the platform streamlines the screening process for long-term equity portfolios.
However, because automated valuation models depend heavily on standardized growth and discount assumptions, visual scoring tools should complement—not replace—your own qualitative research and thorough due diligence.
- Proprietary Trading Explained: What It Is and Its Key Benefits
- TradingView: Features, Broker Integration, and Strategies
- cTrader: How It Works and How It Compares
- What Is a VPS for Trading and Do You Need One?
- Thinkorswim Trading: Features, Tools, and Availability
- Trading Platform Malaysia: What to Look For
- Bursa Anywhere: A Guide to Managing Shares in Malaysia
- What Is Forex Factory and How Do Traders Use It?
- Delta App: Multi-Asset Portfolio Tracker for Crypto & Stocks
- What Is Trading Central and How to Use It?
- What Is Simply Wall St and How to Use It
- What Is Seeking Alpha and How to Use It
- What Is MarketWatch and How to Use It
- What Is Barchart and How to Use It
- Google Finance Explained: How to Track Stocks and Markets
- What Is Finviz and How to Use It for Stock Screening
- What Is Yahoo Finance and How to Use It
- What Is TradingEconomics and How to Use It
- StockCharts Review 2026: Features, Pricing, and Performance
- What Is ZuluTrade and How Does Copy Trading Work on It?
- What Is Investing.com and How to Use It?
- What Is Myfxbook and How Do Traders Use It?
- What Is CoinGecko? A Complete Guide to Crypto Data Tracking
- What Is CoinMarketCap and How to Use It
- What Is CoinStats and How to Use It for Portfolio Tracking
- What Is Sharesight and How to Use It for Portfolio Tracking
- What Is Personal Capital and How to Use It
- What Is a Low Spread Broker? How It Affects Your Trading
- What Is an Introducing Broker (IB) in Forex?
- What Is Social Trading? How Copy Trading Platforms Work
- What Is a PAMM Account? How Managed Forex Accounts Work
- What Is a Margin Account and How Does Margin Trading Work?
- What Are Trading Signals and How Do They Work?
- What Is an Expert Advisor (EA) in Forex Trading?
Disclaimer: The content on this page is intended for educational and informational purposes only. It does not constitute financial, investment, tax, or legal advice, and should not be interpreted as a recommendation to buy, sell, or hold any financial instrument or asset. Trading and investing involve significant risk, including the possible loss of your entire capital. Products such as forex, CFDs, and cryptocurrencies carry additional risks due to leverage, high volatility, and limited regulatory protection in some jurisdictions. Past performance of any financial instrument does not guarantee future results. Any market views, forecasts, or opinions expressed are those of the author at the time of writing and may not reflect current market conditions. Platform features, fees, and regulatory status are subject to change — always verify information directly with the relevant provider or regulator before making any financial decision. BrokerSpecs may receive compensation from third parties featured on this site. Always conduct your own due diligence and consider seeking advice from a licensed financial professional before investing. Portions of this article were prepared with the assistance of AI tools and reviewed by our editorial team before publication.