

site logo
Background

Risk Management

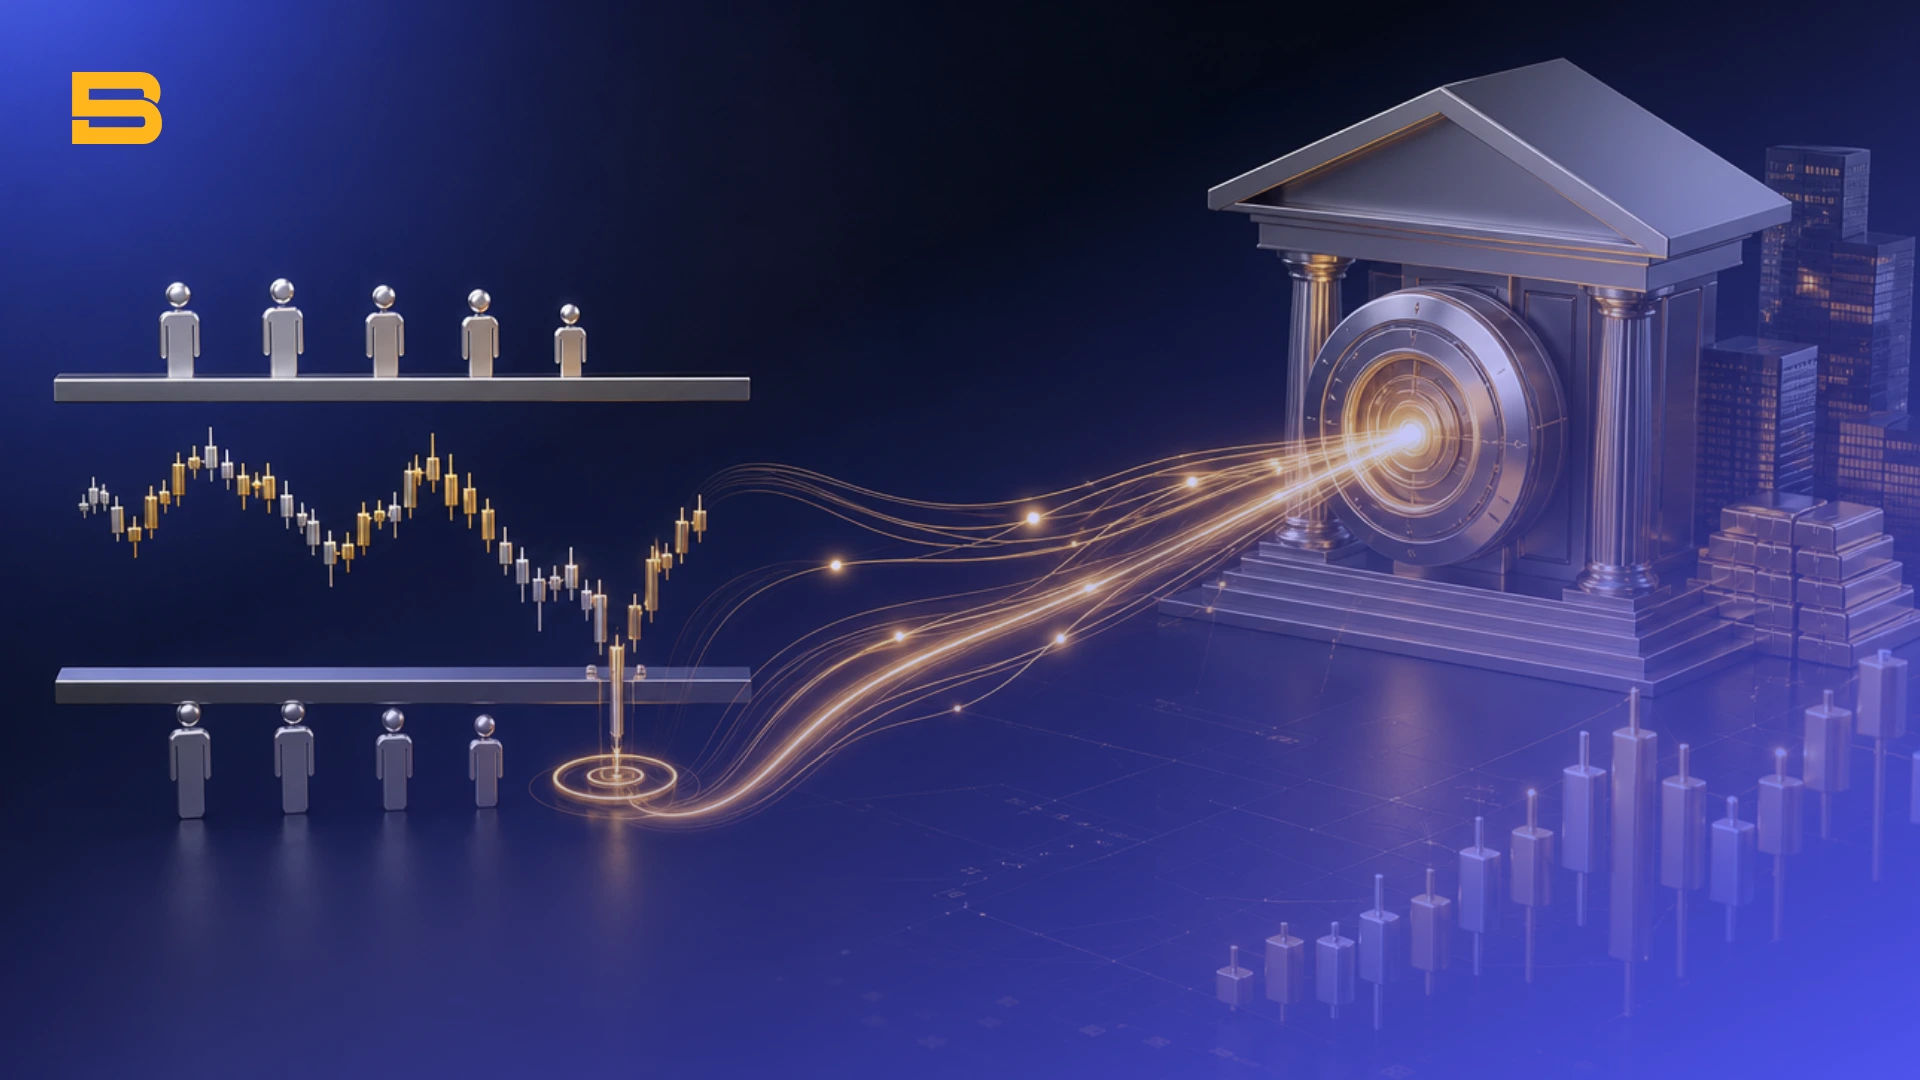
Conceptual cover illustration of order block trading, institutional accumulation base, and price reversal.

Order Block Trading: Spotting Institutional Footprints

Learn order block trading with our guide to spotting institutional footprints, market structure shifts, and breaker blocks. Find out how to manage your risk.
Last Updated:
Conceptual cover illustration of Smart Money Concepts (SMC), institutional liquidity sweeps, and bank order absorption.

Smart Money Concept (SMC): How Institutions Trade Markets

Learn how the smart money concept explains institutional liquidity, order blocks, and market structure. Discover how banks trade and manage risk effectively.
Last Updated:
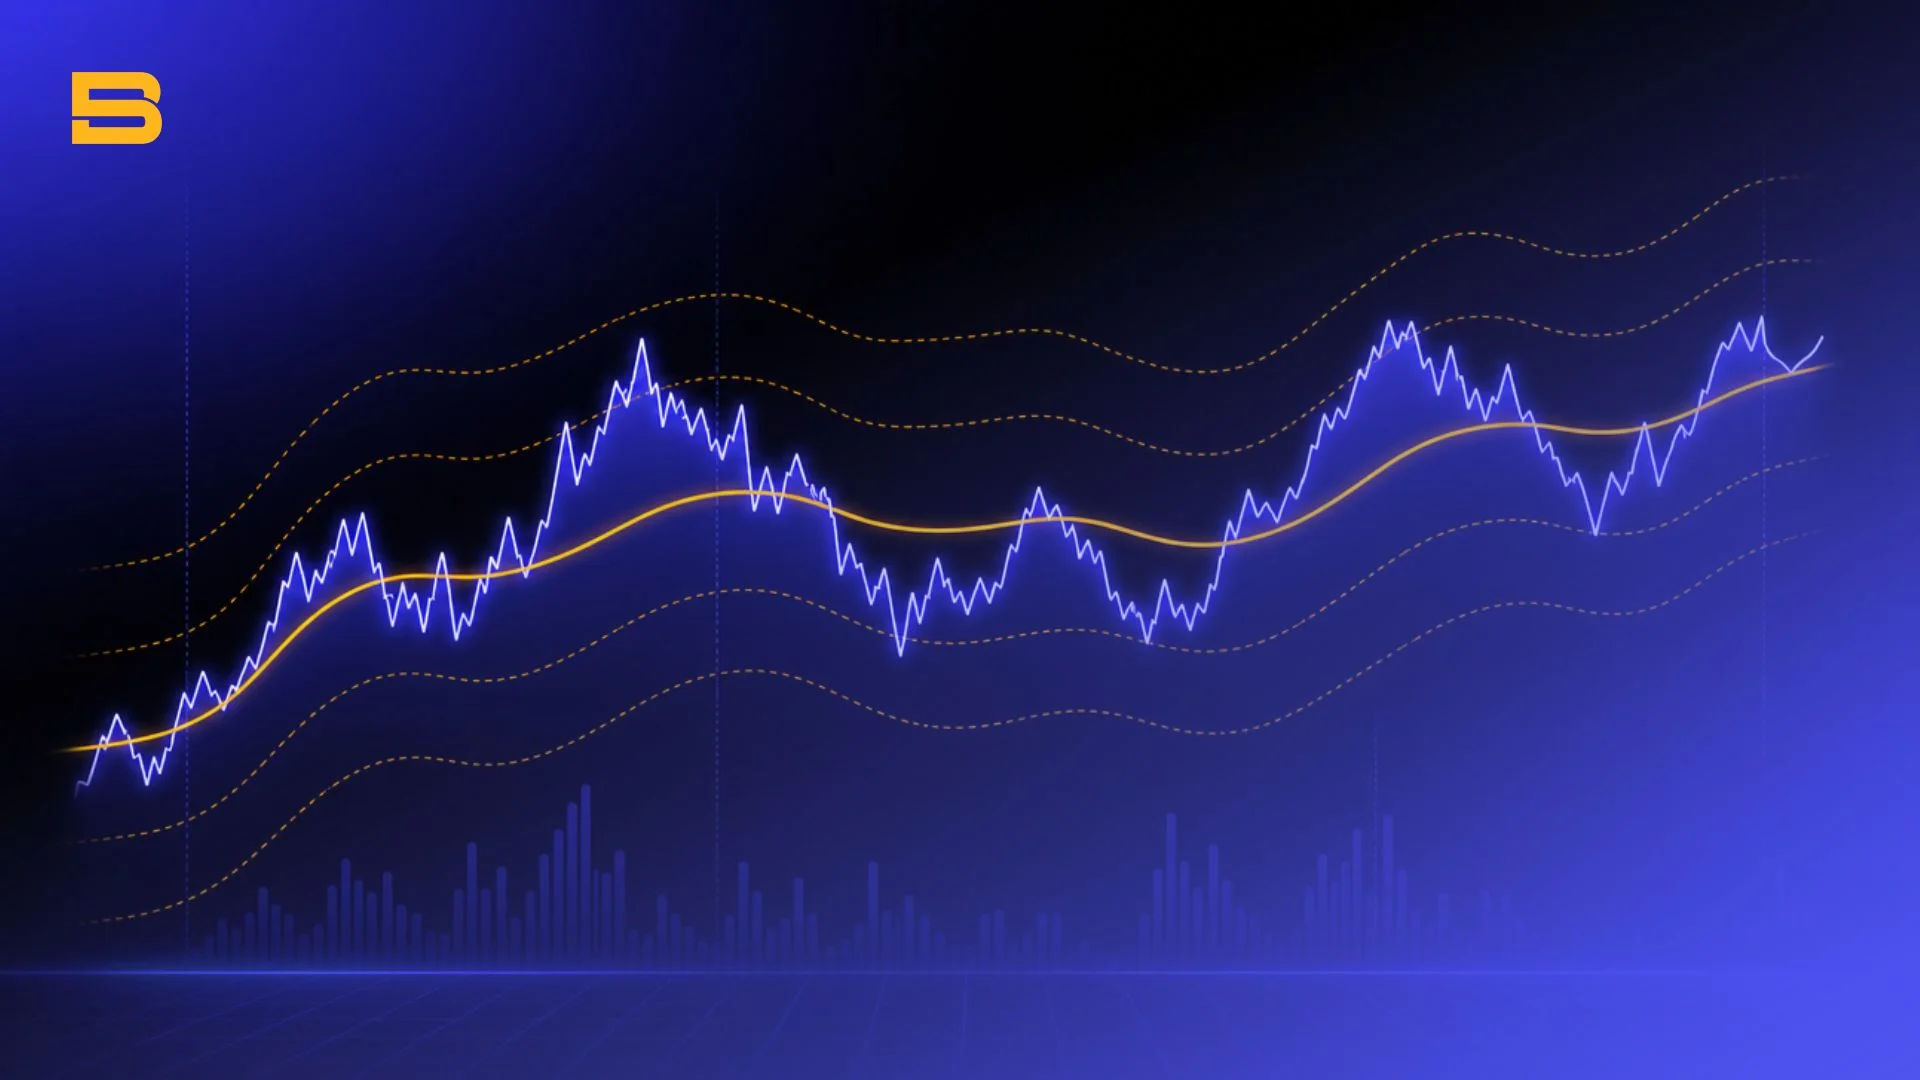
Intraday stock chart showing price moving around the VWAP indicator line and deviation bands

What Is the VWAP Indicator? A Day Trader's Key Factor

Learn what the VWAP indicator is, how to calculate the volume-weighted average price, and master intraday trading strategies. Read our complete guide now.
Last Updated:
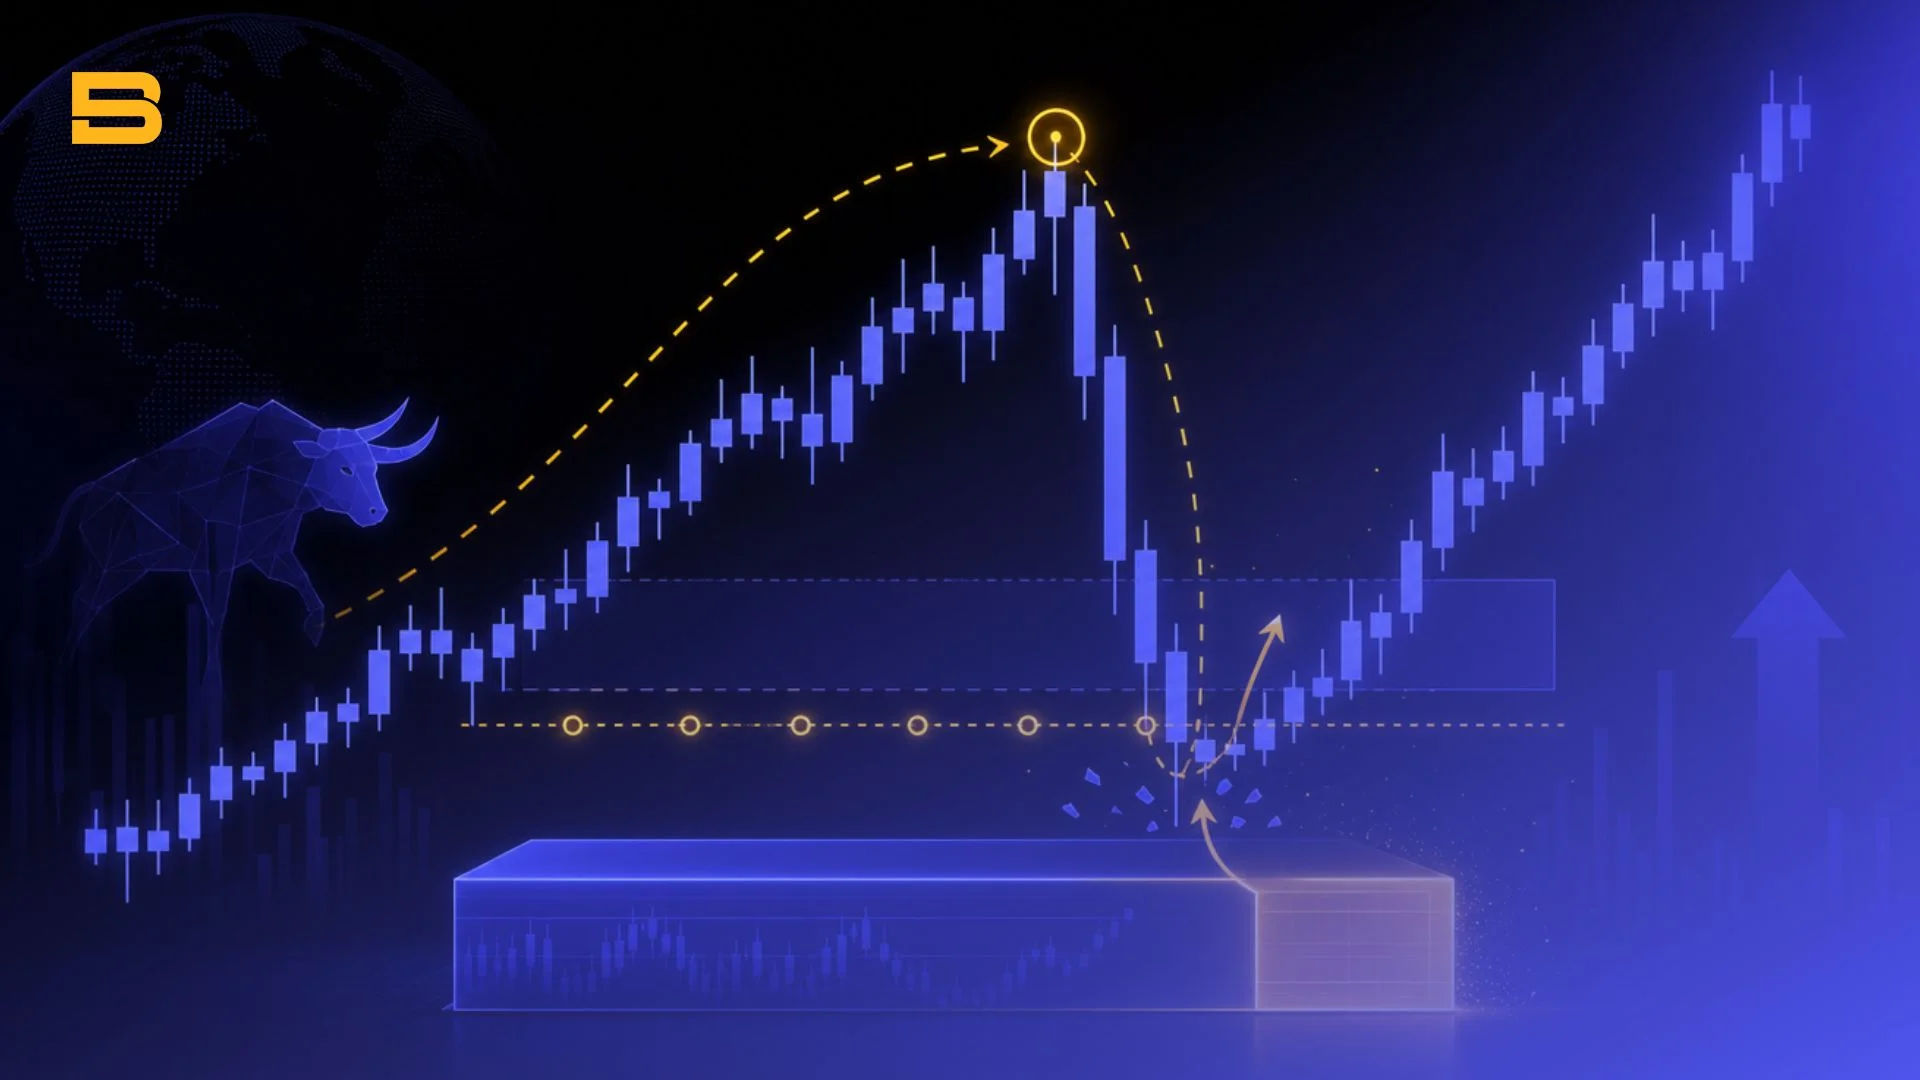
Diagram showing inducement trap sweeping retail stop loss before order block fill in forex chart

Inducement in Trading: How Smart Money Traps Retail Traders

Learn how inducement in trading works in Smart Money Concepts (SMC). Discover how institutions trap retail traders, sweep liquidity, and how to spot setups.
Last Updated:
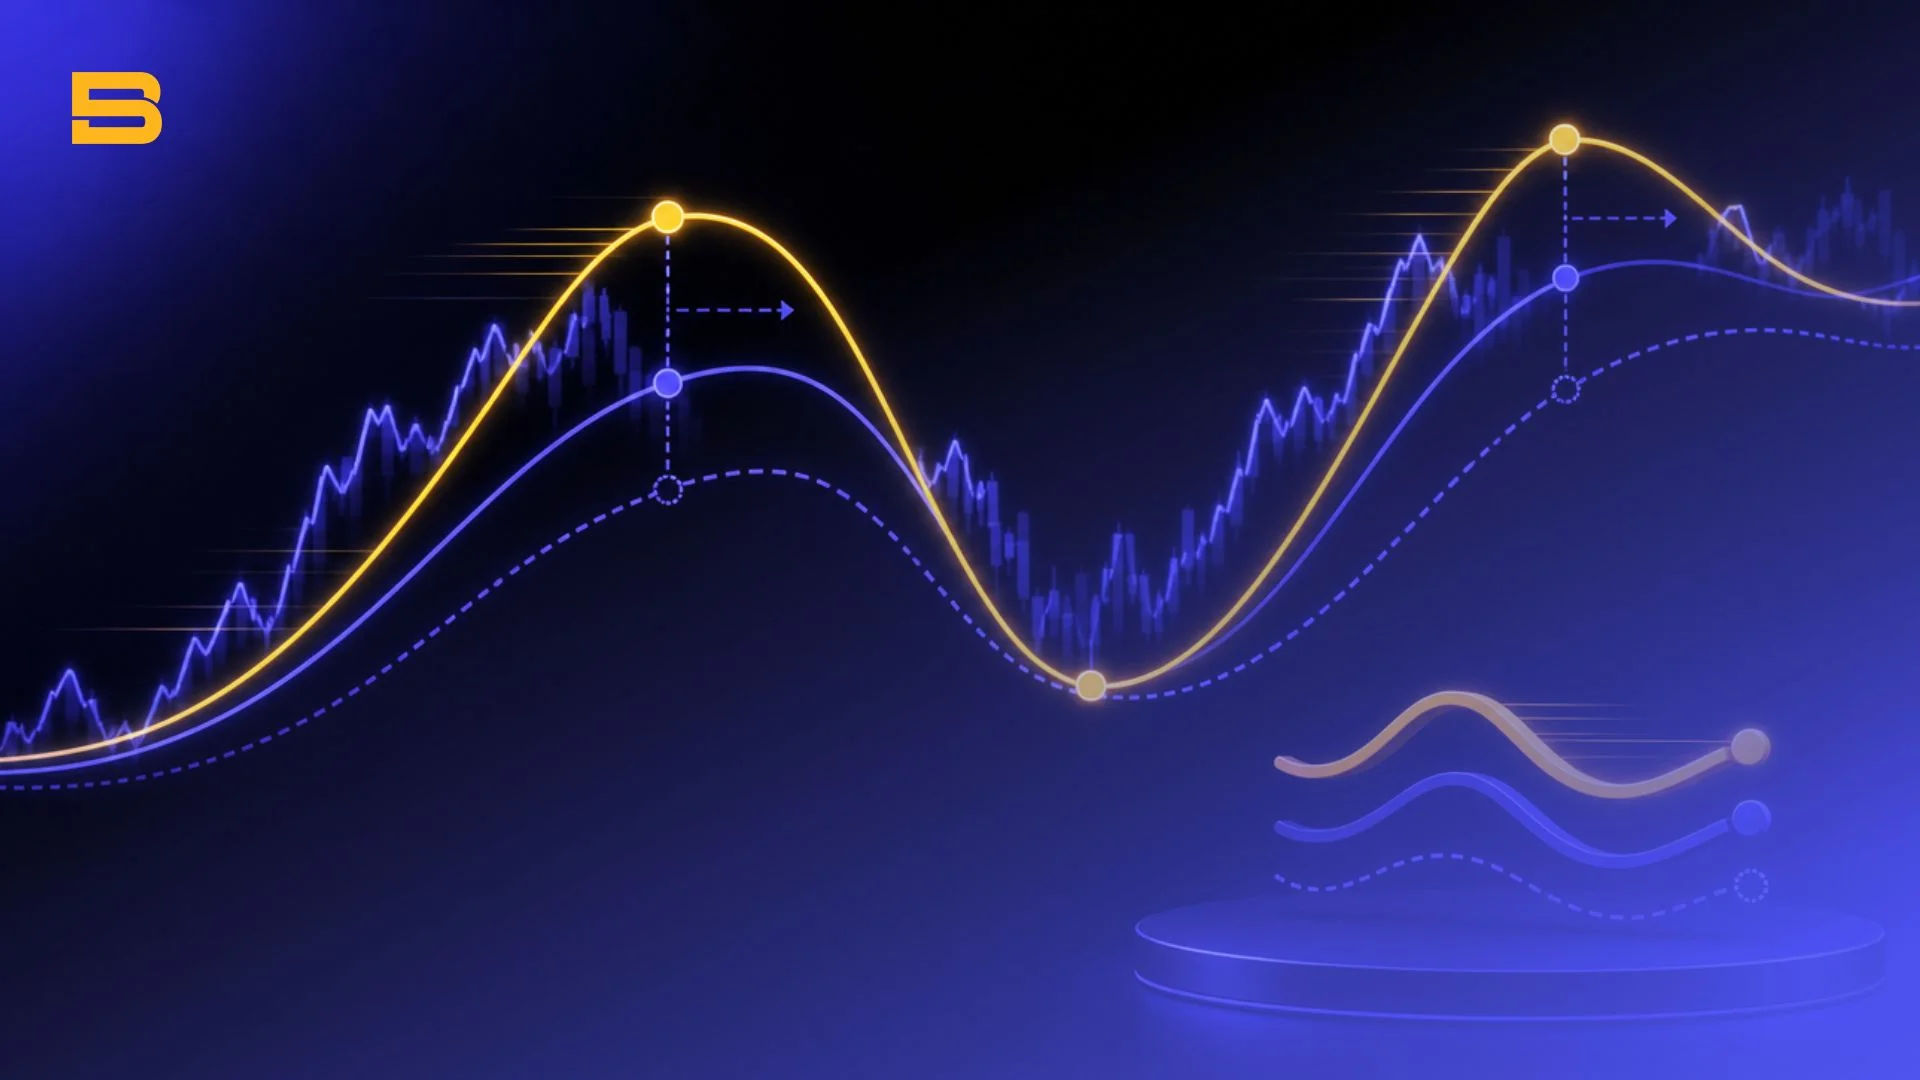
Comparison of Hull Moving Average against SMA and EMA showing lag reduction

Hull Moving Average: Math, Lag Reduction, and Strategies

Discover how the Hull Moving Average eliminates technical indicator lag while maintaining curve smoothness. Learn the math, settings, and trading setups.
Last Updated:
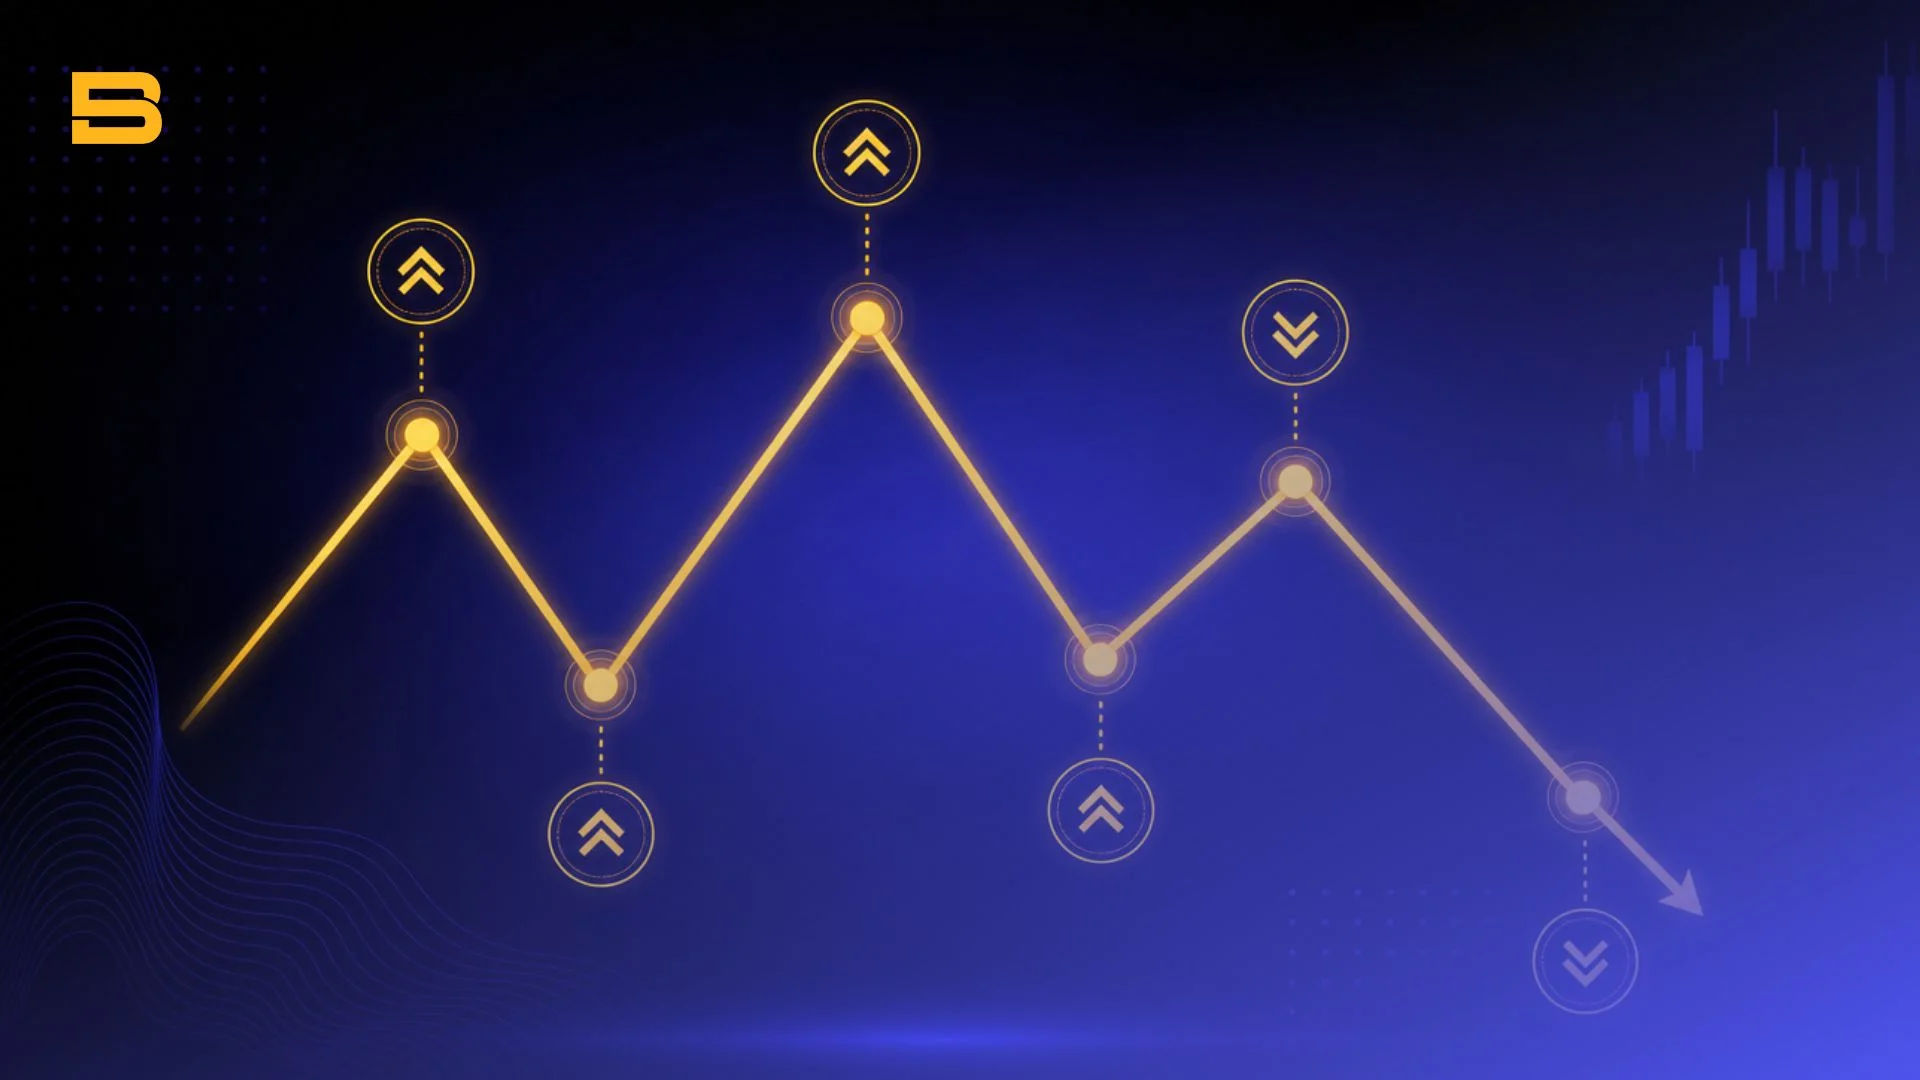
Market structure trading diagram showing bullish and bearish swings

Market Structure: Reading Trend Direction Like a Pro

Master market structure trading to identify market direction using swing highs, BOS, and CHoCH without lagging indicators. Learn more with BrokerSpecs.
Last Updated:
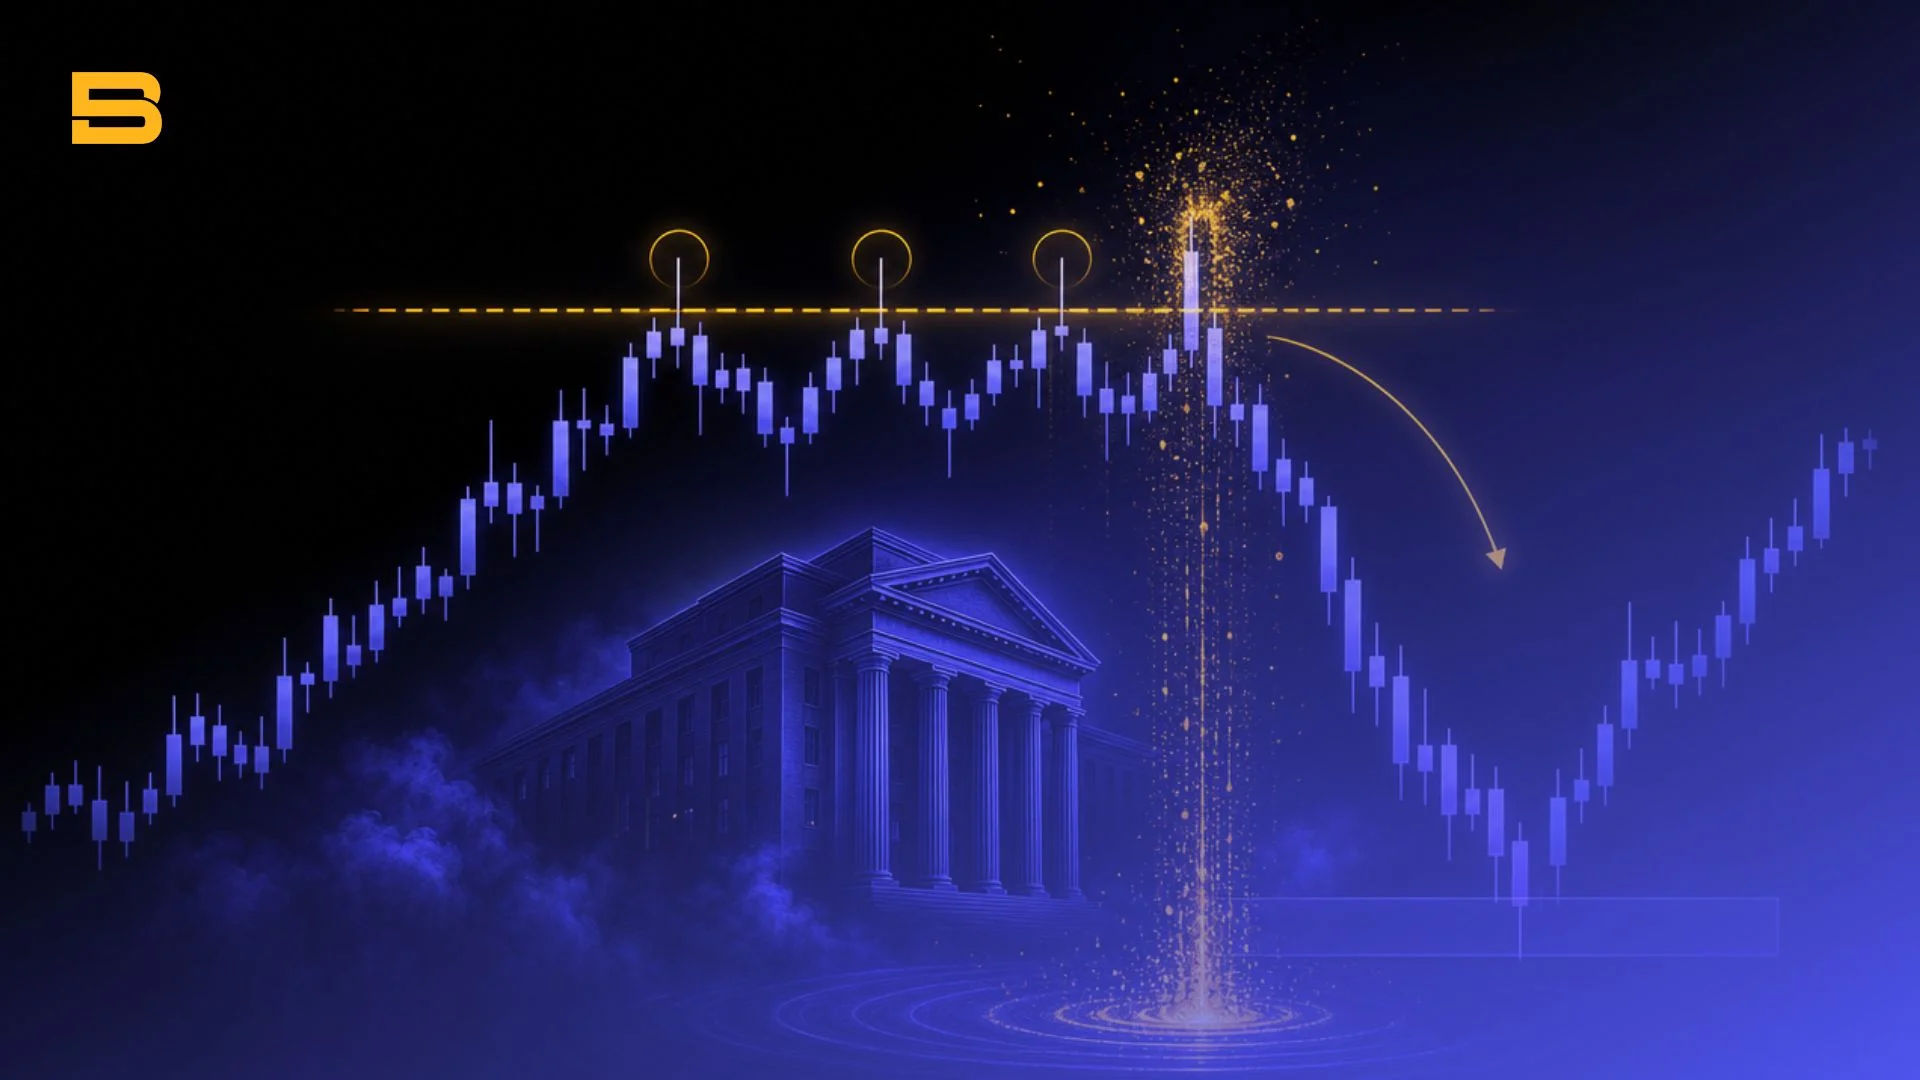
Liquidity grab diagram showing price sweeping buy-side liquidity above equal highs before reversing downward

What Is a Liquidity Grab? How Smart Money Hunts Stop Losses

Learn what a liquidity grab is, how institutional smart money executes stop sweeps, and how retail traders can identify liquidity pools. Learn more.
Last Updated:
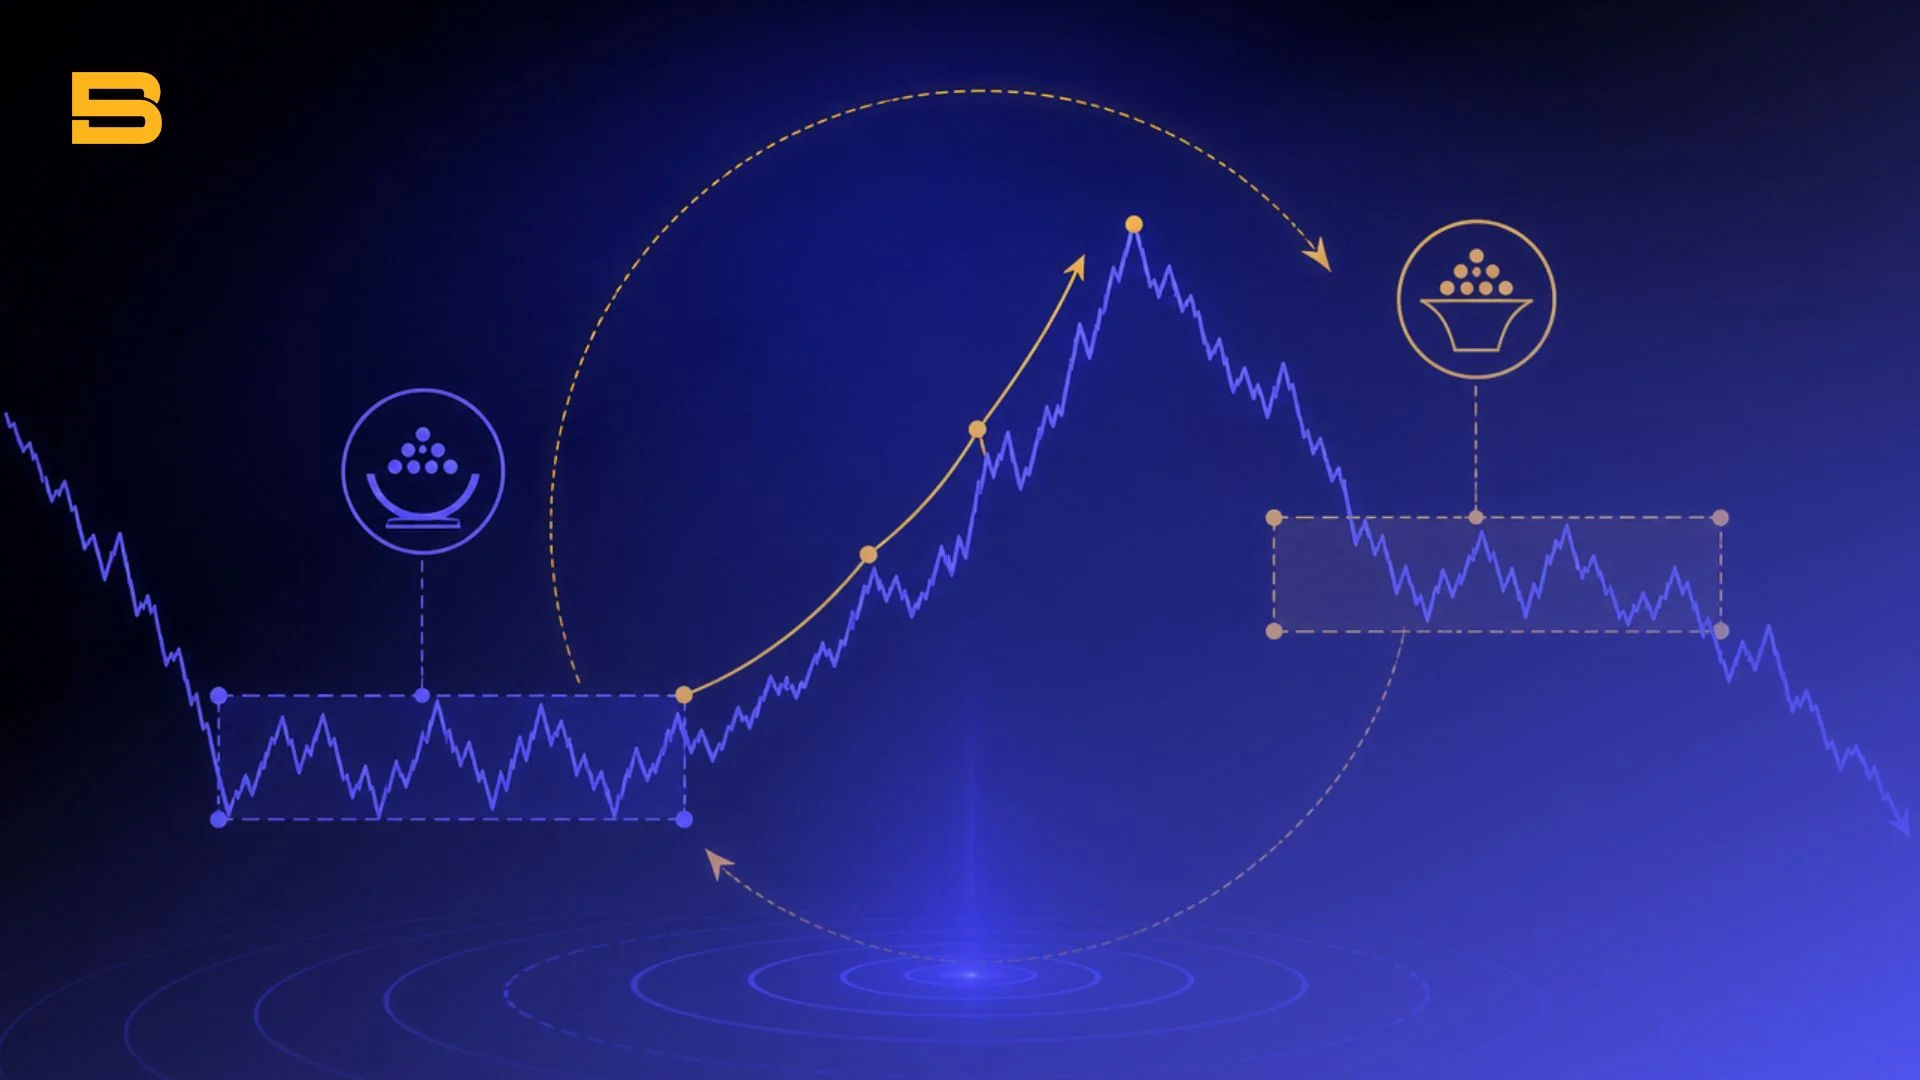
Wyckoff method market cycle diagram showing accumulation and distribution phases

Wyckoff Method Explained: Accumulation & Distribution

Master the Wyckoff method price cycle, accumulation, and distribution schematics to align your trading strategy with institutional market volume.

Last Updated:
Bank Negara Malaysia OPR rate transmission diagram

OPR Malaysia: How Interest Rate Changes Affect Investments

Discover how OPR Malaysia shifts affect housing loans, fixed deposit rates, and investment portfolios. Learn how to manage your financial strategy.

Last Updated:
Visual diagram illustrating emotional trading vs disciplined systematic execution

Building a Disciplined Trading Mindset for the Long-Term

Mastering your trading mindset requires strict risk control, journaling, and emotional discipline. Discover how to avoid emotional traps and execute cleanly.

Last Updated:
Trader taking a break from charts to avoid emotional revenge trading

What Is Revenge Trading and How Can You Stop It?

Learn what revenge trading is, the psychological triggers behind emotional losses, and 3 practical circuit-breaker rules to protect your capital. Learn more.

Last Updated:
Diagram comparing forex account types execution models

Forex Account Types Explained: A Complete Guide for Traders

Compare Standard, ECN, STP, Cent, and Islamic forex account types. Learn execution models, fees, and leverage to choose the right setup. Learn more.


Last Updated: