


Related Tags
You spot an asset that has staged an aggressive multi-day rally, and your charting software flashes an alert that the oscillator has breached its upper boundary. Anticipating an immediate price exhaustion, you enter a short trade, only to watch the price continue climbing another 8% while the indicator remains glued to the top of its scale. That frustrating whipsaw is one of the most common pitfalls among traders who misinterpret momentum oscillators as automatic reversal triggers.
What Is the Williams Percent Range and How Does It Measure Momentum?
The Williams Percent Range, commonly known as Williams %R, is a bounded momentum oscillator that measures where an asset's latest closing price sits relative to its highest high and lowest low over a specified lookback period. Developed by veteran market analyst Larry Williams, the tool is primarily utilized by traders to gauge market momentum, anticipate potential cycle exhaustion, and spot structural momentum divergences.
Unlike trend-following tools that lag behind market shifts, Williams Percent Range is engineered to highlight price extremity before secondary trend changes materialize. It does this by evaluating whether buyers can consistently hold price near the top of the recent range, or if sellers are actively forcing closes toward the lower boundaries.
Professional standards compiled by bodies like the CFA Institute emphasize that momentum oscillators should serve as context-dependent gauge tools rather than standalone buy or sell mandates. When trading high-volatility financial instruments like leveraged forex pairs or index contracts, treating momentum readings as absolute truth without broader market context frequently produces false signals.
The Williams %R Formula and How to Calculate the Inverted Scale
The mathematical formula behind the Williams Percent Range compares the distance between the period's highest high and the current close against the total high-low span across N periods:
%R = Highest High_N - Close / Highest High_N - Lowest Low_N x -100
The standard default setting for N is 14 periods, which can be applied to daily bars, 4-hour candles, or 15-minute intraday intervals. The primary quirk that confuses new users is the negative multiplier, which causes the scale to range from 0 (maximum bullish extremity) down to -100 (maximum bearish extremity).
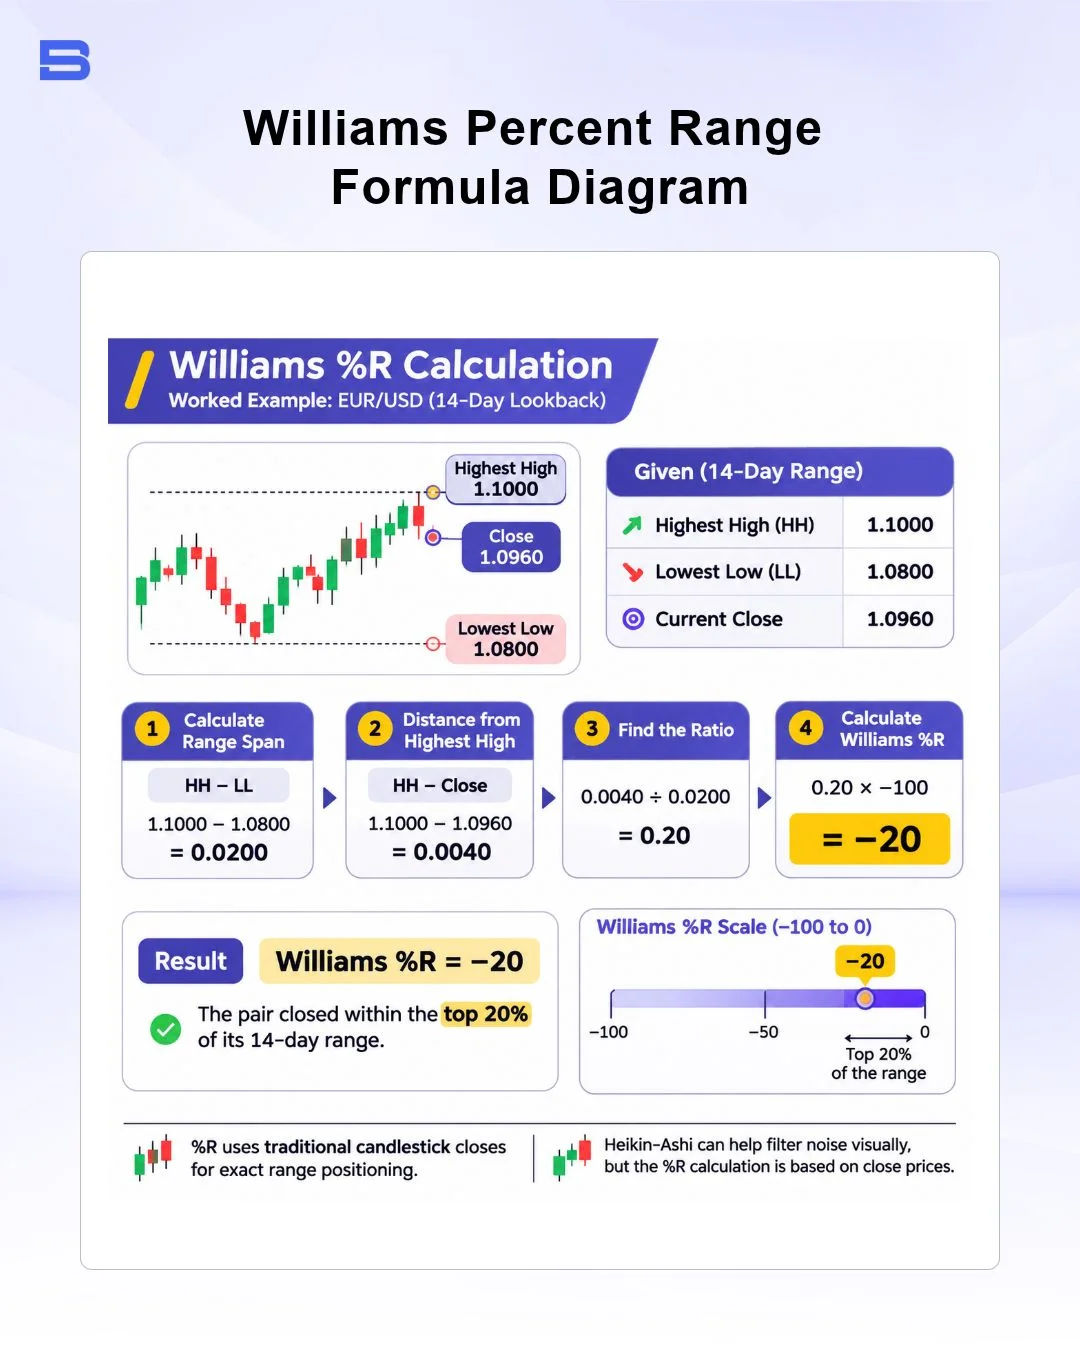
To see how this works in practice, consider a worked scenario using EUR/USD daily data over a 14-day lookback window:
- Highest High over 14 days: 1.1000
- Lowest Low over 14 days: 1.0800
- Current Close: 1.0960
Subtracting the lowest low from the highest high gives a total range span of 0.0200 (1.1000 − 1.0800). Next, subtract the current close from the highest high, yielding 0.0040 (1.1000 − 1.0960). Dividing 0.0040 by 0.0200 results in 0.20, which is then multiplied by -100 to yield a final Williams %R reading of -20.
This indicates the pair closed within the top 20% of its 14-period range. While some traders chart this price action using a Heikin-Ashi chart to filter noise, calculating %R directly from traditional candlestick closes provides precise visibility into exact range positioning.
Reading Overbought and Oversold Levels Without Getting Trapped
The standard parameters for Williams %R establish two primary boundary zones:
- 0 to -20 (Overbought): Signals that the market is closing within the top 20% of its recent trading range.
- -80 to -100 (Oversold): Signals that the market is closing within the bottom 20% of its recent trading range.
The central trap for retail traders is assuming that "overbought" means an asset is destined to drop immediately, or that "oversold" guarantees an upward bounce. In strong directional markets, momentum often pins the indicator at extreme readings for prolonged stretches.
If you enter a short trade solely because %R crosses above -20 during an aggressive secular bull trend, you risk standing in front of institutional buying volume. As established in foundational market concepts like Dow theory, a market moving into new high ground indicates persistent structural demand, not automatic exhaustion.
To avoid false breakout traps, experienced market participants filter oscillator signals with a directional trend gauge, such as a 200-period moving average or a Hull Moving Average. If the broader trend is pointing upward, traders treat an oversold dip below -80 as an opportunity to join the dominant direction on pullbacks, while ignoring overbought readings.
Regulatory warnings published by the Financial Conduct Authority (FCA) highlight that retail accounts face significant drawdown risks when attempting to pick tops and bottoms in leveraged derivative markets. Using %R as an isolated counter-trend trigger remains one of the quickest routes to capital erosion.
Williams %R vs. Stochastic Oscillator vs. RSI: What Is the Difference?
Williams Percent Range is structurally related to the Stochastic Oscillator, but it operates with critical distinct differences in calculation, scale orientation, and internal smoothing. Understanding how it compares to both the Fast Stochastic and the Relative Strength Index (RSI) helps you determine which indicator fits your trading style.
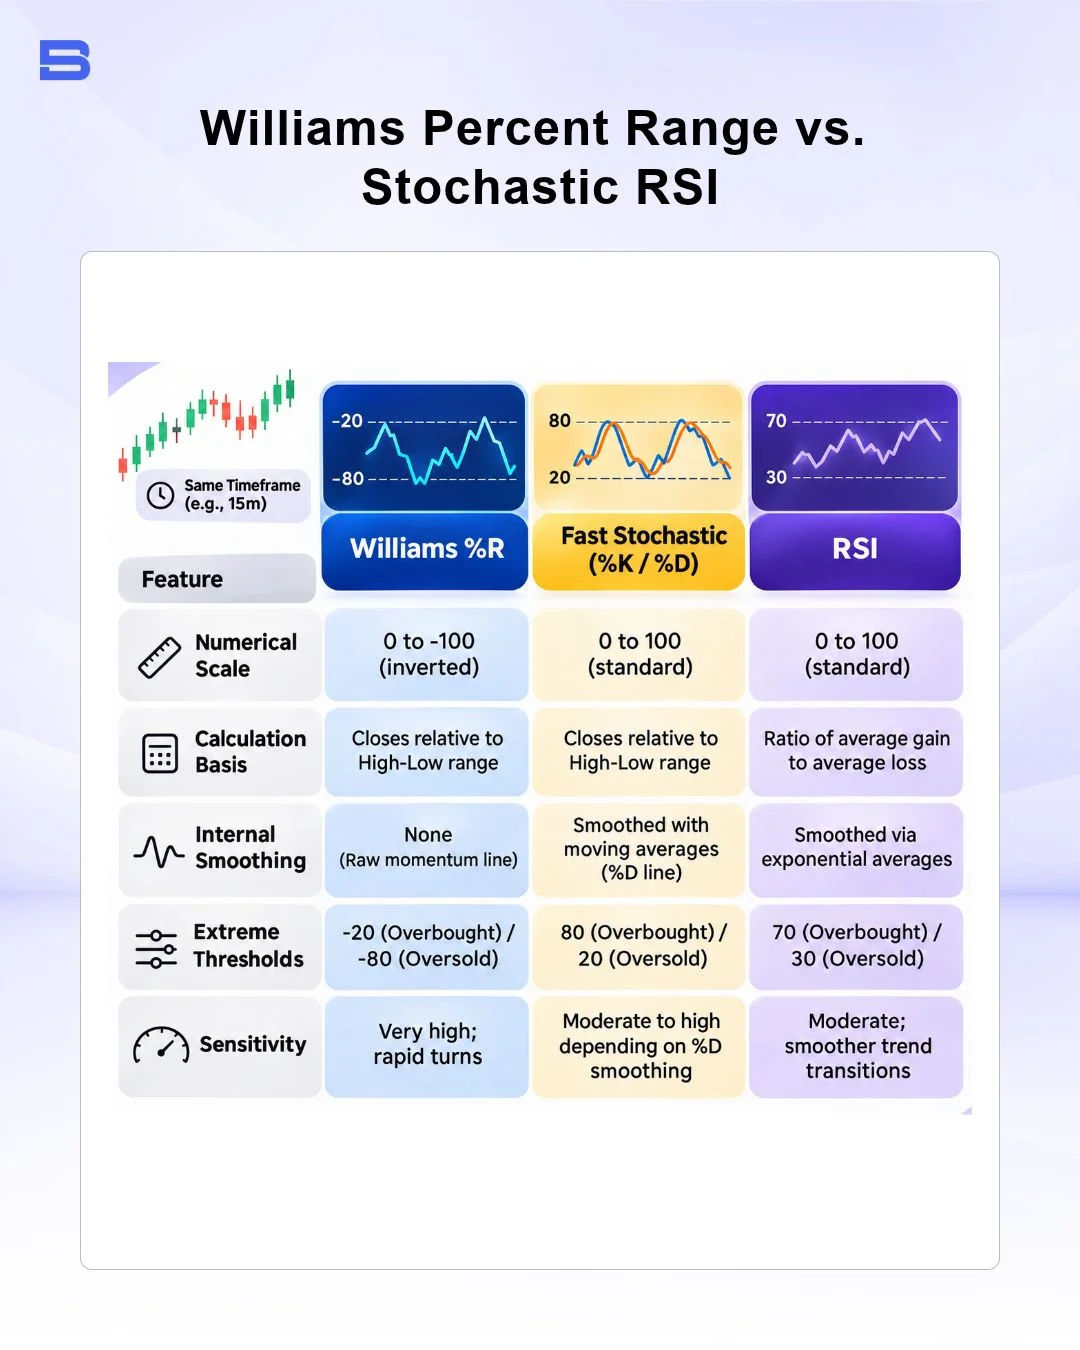
Mathematically, Williams Percent Range is identical to an inverted version of the raw Fast Stochastic %K line. The Fast Stochastic tracks proximity to the low (scale 0 to 100), while Williams %R measures proximity to the high (scale 0 to -100). Because %R incorporates no built-in smoothing line, it reacts considerably faster to sudden price impulses than RSI.
While rapid responsiveness lets swing traders spot immediate exhaustion, it also adds more noise in choppy, non-trending regimes. Many traders resolve this by incorporating systematic structural frameworks like an Ichimoku Cloud strategy to ensure trades align with macro trend momentum before acting on an oscillator hook.
Practical Williams %R Trading Strategies: Divergences, Failure Swings, and Centerlines
Applying Williams Percent Range effectively requires waiting for structural trade confirmations rather than executing on raw boundary touches. Confluence with secondary volume tools like the Volume Weighted Average Price (VWAP) indicator or dynamic horizontal references like Pivot points trading substantially reduces whipsaws.
Spotting Weakening Momentum with Failure Swings
A failure swing occurs when an asset reaches a price extreme, but the %R oscillator fails to re-enter its corresponding overbought or oversold boundary zone. In a bullish failure swing, price action prints a lower swing low on the chart, but Williams %R forms a distinct higher low above the -80 line.
This indicates that selling pressure is failing to push closes into the lower range boundary, signaling internal supply exhaustion. When combined with volume absorption dynamics described in the Wyckoff method (a classic price-and-volume framework for reading accumulation and distribution), failure swings provide reliable warning of prospective trend reversals.
Using the -50 Centerline for Trend Confirmation
The -50 centerline serves as the midpoint between buyer control and seller control. When %R crosses above -50, it demonstrates that price is closing in the upper half of the lookback range, indicating active bullish control. Conversely, breaking below -50 confirms that sellers have pushed price into the lower half of the range.
Trend-continuation traders often wait for price to pull back toward the -50 mark during an established trend, taking entry confirmation only when %R pivots off the centerline and accelerates back in the primary direction.
Final Thoughts
Williams Percent Range offers an intuitive window into market momentum by tracking closing prices against recent ranges. Its raw sensitivity gives active traders an early look at market exhaustion, but that same sensitivity demands disciplined risk execution.
Rather than treating overbought and oversold levels as standalone trade triggers, pair the indicator with broader market structure, multi-timeframe trend filters, and strict stop-loss rules to maintain consistent risk control across changing market conditions.
- How to Build an Investment Plan That Actually Works for You?
- What Is the MACD Indicator and How to Use It
- What Is a Wedge Pattern in Trading?
- What Is Ichimoku Cloud Strategy? A Complete Trading System
- Mastering Elliott Wave Theory: Rules and Trading Strategies
- News Trading: Strategies, Execution Risks, and Risk Control
- What Is an Iron Condor Options Strategy?
- Backtesting Explained: What It Is and Why It Really Matters
- Grid Trading: Mechanics, Parameters, and Risk Strategies
- What Is Breakout Trading and How Does It Work?
- Mean Reversion: Technical Strategies and Risk Frameworks
- Momentum Trading: Indicators, Strategies, and Risk Control
- Hammer Candlestick: Structure, Meaning, and Strategy
- Doji Candlestick: Types, Signals, and Trading Strategies
- What Is the Sharpe Ratio and How to Calculate It
- What Is VWAP and How Do Traders Use It?
- Trade the Ascending Triangle: A Step-by-Step Practical Guide
- What Is the Stochastic Oscillator and How to Use It
- How to Trade the Descending Triangle Pattern
- High Frequency Trading: Speed, Algorithms, and Market Impact
- What Is Volume Profile and How to Use It in Trading
- What Is a Morning Star Pattern Candlestick?
- Trade with Parabolic SAR: A Practical Analysis Guide
- Evening Star Pattern: Structure, Rules, and Risk Controls
- Kelly Criterion: Formula, Position Sizing, and Risk
- What Is the NYSE Minimum Trading Price? Rules Explained
Disclaimer: The content on this page is intended for educational and informational purposes only. It does not constitute financial, investment, tax, or legal advice, and should not be interpreted as a recommendation to buy, sell, or hold any financial instrument or asset. Trading and investing involve significant risk, including the possible loss of your entire capital. Products such as forex, CFDs, and cryptocurrencies carry additional risks due to leverage, high volatility, and limited regulatory protection in some jurisdictions. Past performance of any financial instrument does not guarantee future results. Any market views, forecasts, or opinions expressed are those of the author at the time of writing and may not reflect current market conditions. Platform features, fees, and regulatory status are subject to change — always verify information directly with the relevant provider or regulator before making any financial decision. BrokerSpecs may receive compensation from third parties featured on this site. Always conduct your own due diligence and consider seeking advice from a licensed financial professional before investing. Portions of this article were prepared with the assistance of AI tools and reviewed by our editorial team before publication.