


Related Tags
Imagine watching a stock rally strongly for five consecutive trading sessions. Buyers push the price up with confidence, only for momentum to grind to a halt on the sixth day. The price swings wildly between highs and lows throughout the session, but by the closing bell, it settles almost exactly where it started. The chart leaves behind a thin cross—a visual marker of hesitation where neither bulls nor bears could gain control.
In technical analysis, this distinct price pattern is known as a Doji candlestick. Recognizing when buyers and sellers reach a temporary deadlock helps you anticipate potential trend exhaustion or impending price reversals before they unfold.
What Is a Doji Candlestick Pattern?
A Doji candlestick is a single-candle chart pattern formed when a security's open and close prices are virtually identical, resulting in a nearly nonexistent real body with upper or lower wicks.
To understand what a doji candlestick means on a chart, you need to break down its visual components:
- Real Body: The small rectangle connecting the open and close price. On a Doji, this body appears as a thin horizontal line because price moved away during the session but returned to the starting level.
- Upper Wick (Shadow): The line extending above the body, representing the highest price buyers managed to push during the session.
- Lower Wick (Shadow): The line extending below the body, representing the lowest price sellers dragged the market down to.
When you see a Doji, it signifies market equilibrium. Neither the buying pressure nor the selling pressure was strong enough to maintain control by the close of the trading period.
What Does a Doji Candlestick Tell You?
A Doji candlestick reflects equal strength—or equal hesitation—between buyers and sellers. During an active market session, bulls attempt to drive prices higher while bears try to push them lower. When the session closes at the open price, it indicates that the aggressive party was pushed back to square one.
According to technical analysis principles outlined by the CFA Institute, individual candlestick patterns like the Doji should never be analyzed in isolation. Context determines whether this hesitation leads to a trend reversal or a brief consolidation before the prior trend continues. A Doji appearing in a flat, sideways market carries little significance because volume and directional momentum are already low.
However, when a Doji appears after an extended trend, it serves as an early warning that the prevailing momentum is weakening.
Is a Doji Candle Bullish or Bearish?
By itself, a Doji candlestick is strictly neutral. It represents neither bullish nor bearish dominance.
Its directional bias depends entirely on where it forms relative to surrounding market structure:
- At Key Resistance Levels (Potential Bearish Reversal): If a Doji forms at a major resistance level after a sustained uptrend, it indicates buyers are losing momentum and failing to break through higher prices.
- At Key Support Levels (Potential Bullish Reversal): If a Doji forms at a strong support level after a prolonged downtrend, it signals that selling pressure is drying up and buyers are stepping in to defend the floor.
Consider a practical example:
Suppose you enter an RM1,000 position in a stock following a 5-day rally toward an RM10.00 resistance level. On day six, the stock opens at RM9.90, pushes to a high of RM10.15, drops to a low of RM9.70, but closes right back at RM9.90.
This Doji signals that buyers failed to hold the breakout above RM10.00. While it is not an immediate command to exit, it warns you to tighten your risk parameters or wait for a price drop before opening new long positions.
What Are the Four Types of Doji Candles?
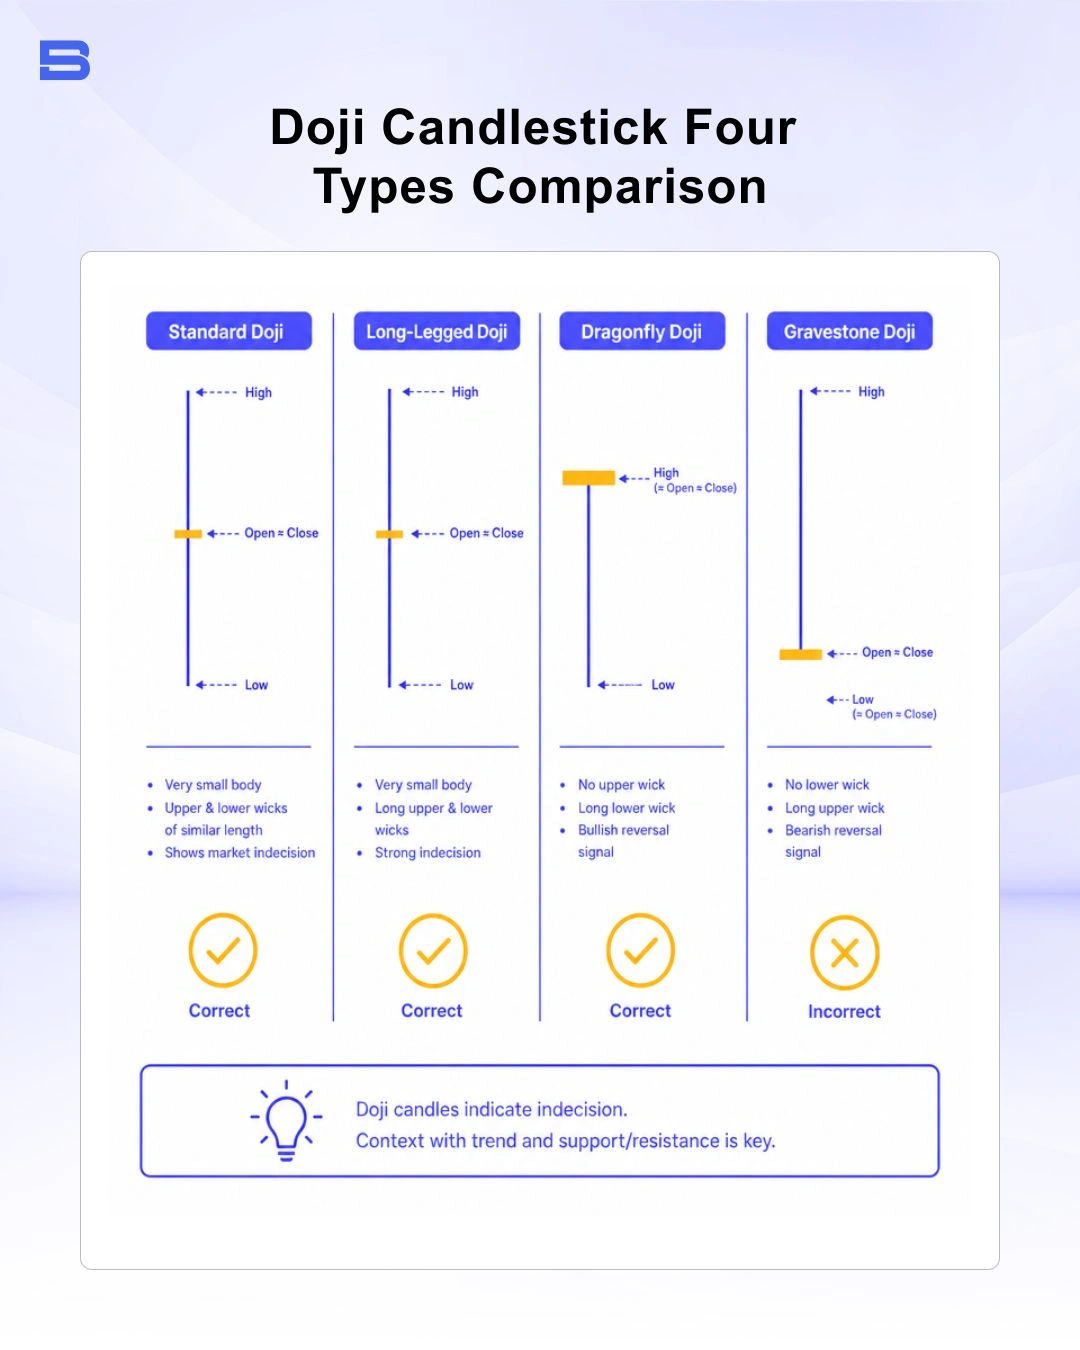
While all Doji candles share the trait of matching open and close prices, variations in their wicks offer different insights into market psychology.
Standard Doji & Long-Legged Doji
- Standard Doji: Features relatively short upper and lower wicks of roughly equal length. It reflects a quiet period of indecision with moderate price range fluctuation.
- Long-Legged Doji: Features significantly extended upper and lower wicks. This shape indicates intense market volatility where both buyers and sellers made aggressive moves during the session, but neither could hold their ground by the close.
Dragonfly Doji & Gravestone Doji
- Dragonfly Doji: Features a long lower wick with little to no upper wick, forming a "T" shape. It shows that sellers drove prices significantly lower during the session, but buyers stepped in aggressively to push the price back up to the open level. When found at a downtrend support level, it offers a bullish rejection signal.
- Gravestone Doji: Features a long upper wick with little to no lower wick, resembling an inverted "T." It indicates that buyers pushed prices higher earlier in the session, but sellers took control and forced the price back down to the opening level. When found at an uptrend resistance level, it signals a bearish rejection.
How Do You Trade a Doji Candlestick?
Trading a Doji requires a systematic approach focused on confirmation rather than premature anticipation. Entering a trade immediately upon seeing a Doji often leads to false signals, as the market can easily break out in the direction of the original trend.
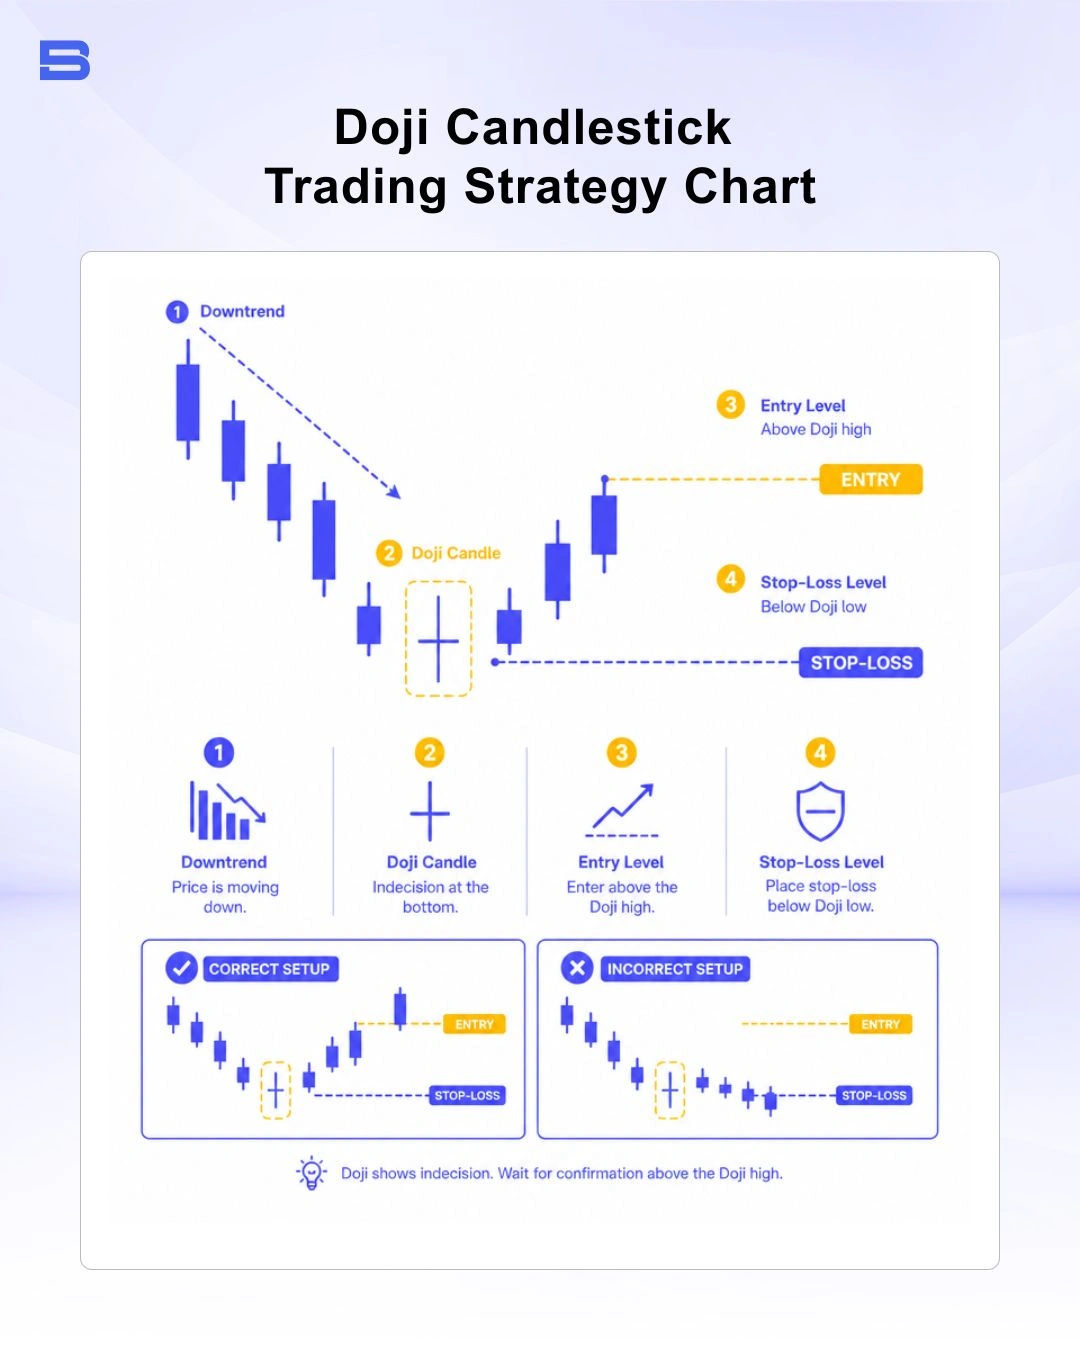
To trade a Doji effectively, follow a simple three-step strategy:
- Identify the Market Context: Locate a Doji that forms after an established uptrend or downtrend, ideally aligning with a major technical support or resistance zone.
- Wait for Confirmation: Never trade on the Doji session itself. Wait for the following candle to close. For a bearish reversal setup, wait for a strong red candle closing below the Doji’s low. For a bullish reversal setup, wait for a green candle closing above the Doji’s high.
- Place Clear Risk Controls: Set your stop loss just beyond the highest wick of the Doji (for short trades) or below the lowest wick (for long trades). Calculate your position size to ensure you do not risk more than 1% to 2% of your overall trading capital on the setup.
Retail financial markets carry significant volatility risks. Regulators like the Securities Commission Malaysia (SC) emphasize the necessity of disciplined risk parameters. Always guard against false signals, which occur frequently in low-volatility or choppy, sideways markets where Doji candles reflect a lack of trading interest rather than a true trend reversal.
Comparing Doji to Other Candlestick Patterns
Understanding how Doji patterns differ from other technical chart structures helps you categorize price action accurately.
- Single-Candle Comparisons: A Doji differs from a hammer candlestick or hanging man candlestick because those patterns feature a real body at the top of the price range. Similarly, a shooting star candlestick features a recognizable body near the bottom of its range, whereas a Doji has no distinct body at all.
- Multi-Candle Comparisons: While a Doji represents single-session indecision, multi-candle patterns provide built-in confirmation. For instance, a Doji often acts as the center candle in a three-candle reversal structure, such as a morning star pattern (bullish) or an evening star pattern. In contrast, an engulfing pattern features a large real body that completely swallows the previous candle's range, showing decisive directional control rather than indecision.
The Bottom Line
The Doji candlestick serves as a visual indicator of market indecision. Whether it signals a minor pause in an ongoing rally or the early stages of a major trend reversal depends on surrounding price structure, key support and resistance levels, and confirmation from subsequent price action.
By combining Doji patterns with additional tools like moving averages, momentum indicators, and sound risk management, you can navigate shifting market dynamics with greater clarity.
- How to Build an Investment Plan That Actually Works for You?
- What Is the MACD Indicator and How to Use It
- What Is a Wedge Pattern in Trading?
- What Is Ichimoku Cloud Strategy? A Complete Trading System
- Mastering Elliott Wave Theory: Rules and Trading Strategies
- News Trading: Strategies, Execution Risks, and Risk Control
- What Is an Iron Condor Options Strategy?
- Backtesting Explained: What It Is and Why It Really Matters
- Grid Trading: Mechanics, Parameters, and Risk Strategies
- What Is Breakout Trading and How Does It Work?
- Mean Reversion: Technical Strategies and Risk Frameworks
- Momentum Trading: Indicators, Strategies, and Risk Control
- Hammer Candlestick: Structure, Meaning, and Strategy
- Doji Candlestick: Types, Signals, and Trading Strategies
- What Is the Sharpe Ratio and How to Calculate It
- What Is VWAP and How Do Traders Use It?
- Trade the Ascending Triangle: A Step-by-Step Practical Guide
- What Is the Stochastic Oscillator and How to Use It
- How to Trade the Descending Triangle Pattern
- High Frequency Trading: Speed, Algorithms, and Market Impact
- What Is Volume Profile and How to Use It in Trading
- What Is a Morning Star Pattern Candlestick?
- Trade with Parabolic SAR: A Practical Analysis Guide
- Evening Star Pattern: Structure, Rules, and Risk Controls
- Kelly Criterion: Formula, Position Sizing, and Risk
- What Is the NYSE Minimum Trading Price? Rules Explained
Disclaimer: The content on this page is intended for educational and informational purposes only. It does not constitute financial, investment, tax, or legal advice, and should not be interpreted as a recommendation to buy, sell, or hold any financial instrument or asset. Trading and investing involve significant risk, including the possible loss of your entire capital. Products such as forex, CFDs, and cryptocurrencies carry additional risks due to leverage, high volatility, and limited regulatory protection in some jurisdictions. Past performance of any financial instrument does not guarantee future results. Any market views, forecasts, or opinions expressed are those of the author at the time of writing and may not reflect current market conditions. Platform features, fees, and regulatory status are subject to change — always verify information directly with the relevant provider or regulator before making any financial decision. BrokerSpecs may receive compensation from third parties featured on this site. Always conduct your own due diligence and consider seeking advice from a licensed financial professional before investing. Portions of this article were prepared with the assistance of AI tools and reviewed by our editorial team before publication.