


Related Tags
Imagine looking at a chart cluttered with individual moving averages, separate trend lines, momentum oscillators, and volume histogram bars. Switching between five different indicator windows to confirm a single trade setup often leads to analysis paralysis and missed execution windows.
The ichimoku cloud (known as Ichimoku Kinko Hyo, translating to "one-look balance chart") solves this fragmentation by consolidating trend identification, momentum tracking, dynamic support, and forward projection into a single comprehensive visual overlay. Developed by Japanese journalist Goichi Hosoda in the late 1930s and published in 1969, this system is designed to allow you to determine market equilibrium and direction in a single glance.
What Is the Ichimoku Cloud and How Does It Work?
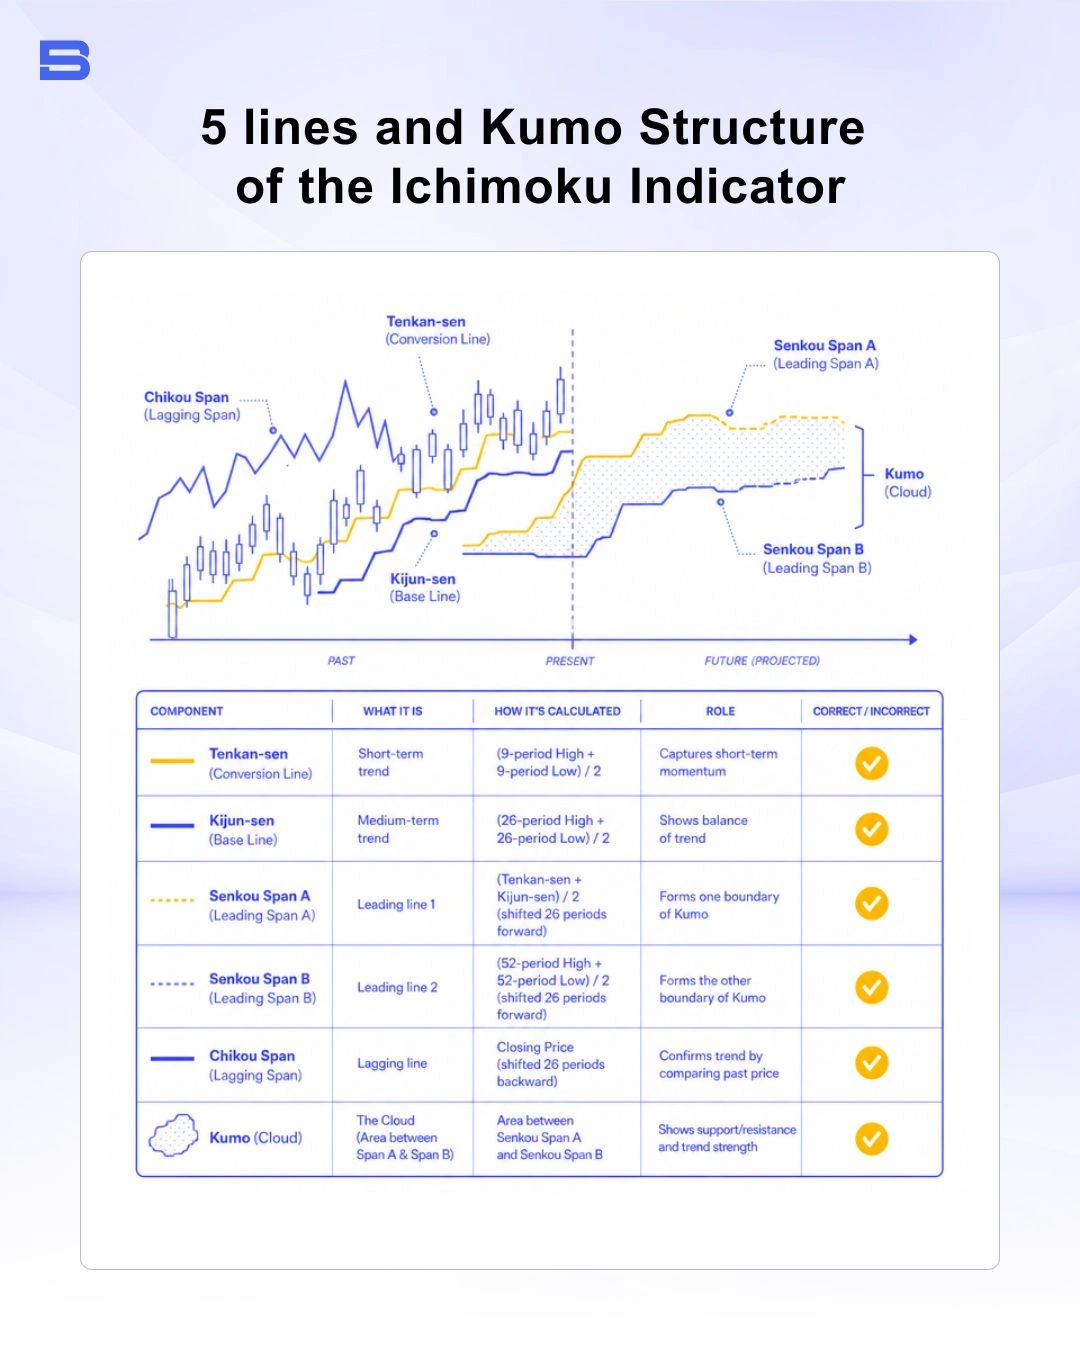
The Ichimoku cloud is an all-in-one technical indicator composed of five separate lines calculated from midpoint highs and lows over specific timeframe periods. Unlike simple moving averages that calculate mean closing prices, Ichimoku relies on price extremes to define dynamic support and resistance zones.
Tenkan-sen (Conversion Line)
Calculated as the highest high plus the lowest low divided by two over the preceding 9 periods:
Tenkan-sen = (Highest High (9) + Lowest Low (9)) ÷ 2
You can use this line to track short-term price momentum — it acts as a minor dynamic support or resistance level you'll want to watch.
Kijun-sen (Base Line)
Calculated using the same midpoint formula over 26 periods:
Kijun-sen = (Highest High (26) + Lowest Low (26)) ÷ 2
Think of the Kijun-sen as your medium-term equilibrium line. When price is trending strongly, you'll see it move away from this baseline — but it often pulls back to retest it, giving you a dynamic stop-loss or re-entry anchor.
Senkou Span A and Senkou Span B
The Senkou Spans form the boundaries of the Kumo (Cloud):
Senkou Span A = (Tenkan-sen + Kijun-sen) ÷ 2
This value is plotted 26 periods ahead of the current price bar.
Senkou Span B = (Highest High (52) + Lowest Low (52)) ÷ 2
You'll also see this plotted 26 periods forward. The shaded space between Span A and Span B is your Kumo. When Span A sits above Span B, you're looking at a green cloud (bullish equilibrium); when Span B sits above Span A, it's shaded red (bearish equilibrium).
Chikou Span (Lagging Span)
The Chikou Span is simply the current period's closing price, plotted 26 periods backward on the chart. It gives you instant visual confirmation of whether current price action is trading above or below historical price structure.
Trading Strategies: TK Cross and Kumo Breakout
The core strength of the Ichimoku cloud lies in combining trend direction with structural breakouts. Two primary execution setups form the backbone of the system.
TK Cross Strategy
A Tenkan/Kijun (TK) cross functions similarly to a moving average crossover. A bullish TK cross occurs when the short-term Tenkan-sen crosses above the medium-term Kijun-sen. A bearish TK cross occurs when the Tenkan-sen crosses below the Kijun-sen.
Before diving into the formulas, it helps to know that Ichimoku is plotted on a standard candlestick chart, where each candle shows the open, high, low, and close price for a set period.
The lines you're about to learn all work by identifying where price is likely to find support (a floor) or resistance (a ceiling).
- Strong Bullish Signal: TK cross occurs above the Cloud.
- Neutral Bullish Signal: TK cross occurs inside the Cloud.
- Weak Bullish Signal: TK cross occurs below the Cloud.
Kumo Breakout Strategy
You're looking at a Kumo breakout when price candles close completely outside the Cloud boundary. Since the Cloud represents forward equilibrium, a breakout from a thick Cloud tells you the trend has real structural momentum behind it.
Standard Settings (9-26-52) vs. Crypto Parameter Adjustments
Traditional settings (9, 26, 52) were calibrated by Hosoda for 6-day trading weeks in Japanese markets. These settings will still work well if you're trading equities or forex during standard exchange hours. But if you trade 24/7 markets like crypto, you may want to adjust your parameters to (10, 30, 60) or (20, 60, 120) to account for continuous trading cycles
Standard parameters provide faster signals but higher false-breakout risks during low-volatility conditions, whereas crypto-adjusted parameters smooth out noise at the expense of slight lag.
Worked Example: EUR/USD Long Entry
Consider a 4-hour Euro and US Dollar (EUR/USD) chart trading near 1.0850:
- Setup: EUR/USD consolidates inside a red Kumo between 1.0820 and 1.0860.
- Breakout: A 4-hour candle closes at 1.0880, clearly above Senkou Span A.
- Confirmation: The Chikou Span sits at 1.0880, clearly above the price action from 26 periods prior. The Tenkan-sen sits at 1.0850, above the Kijun-sen at 1.0830.
- Here's how you'd approach it: Enter long at 1.0880, place your stop-loss below the dynamic Senkou Span B at 1.0830 (50 pips of risk), and set your take-profit at 1.0980 for a 1:2 risk-to-reward ratio (100 pips of reward).
Trading derivatives and leveraged forex carries substantial downside risk. As outlined under regulations by authority bodies like the US Securities and Exchange Commission (SEC) and Commodity Futures Trading Commission (CFTC), leverage amplifies both potential capital expansion and total account drawdown.
Comparing Ichimoku Cloud to Moving Average Overlays
You'll often find yourself comparing the Ichimoku Cloud to dual moving average overlays. Both help you spot trend direction, but the math behind each works very differently.
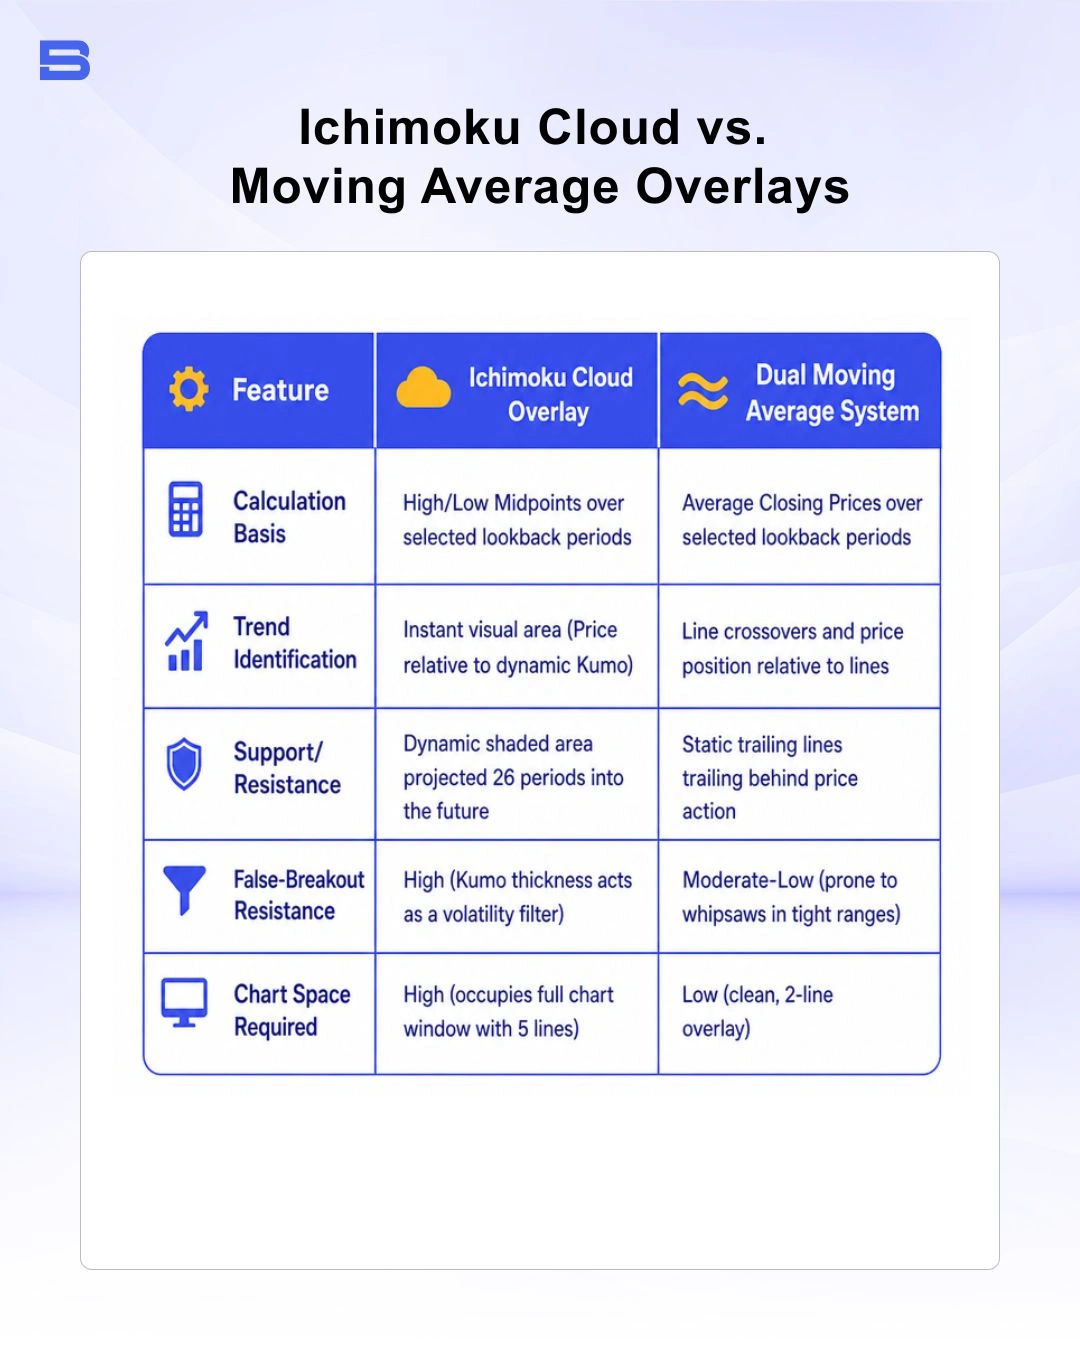
Standard moving averages smooth close prices, whereas Ichimoku midpoints incorporate period extremes, providing clearer representations of equilibrium price ranges.
Confluence Signals: Combining Ichimoku with Fibonacci Retracement
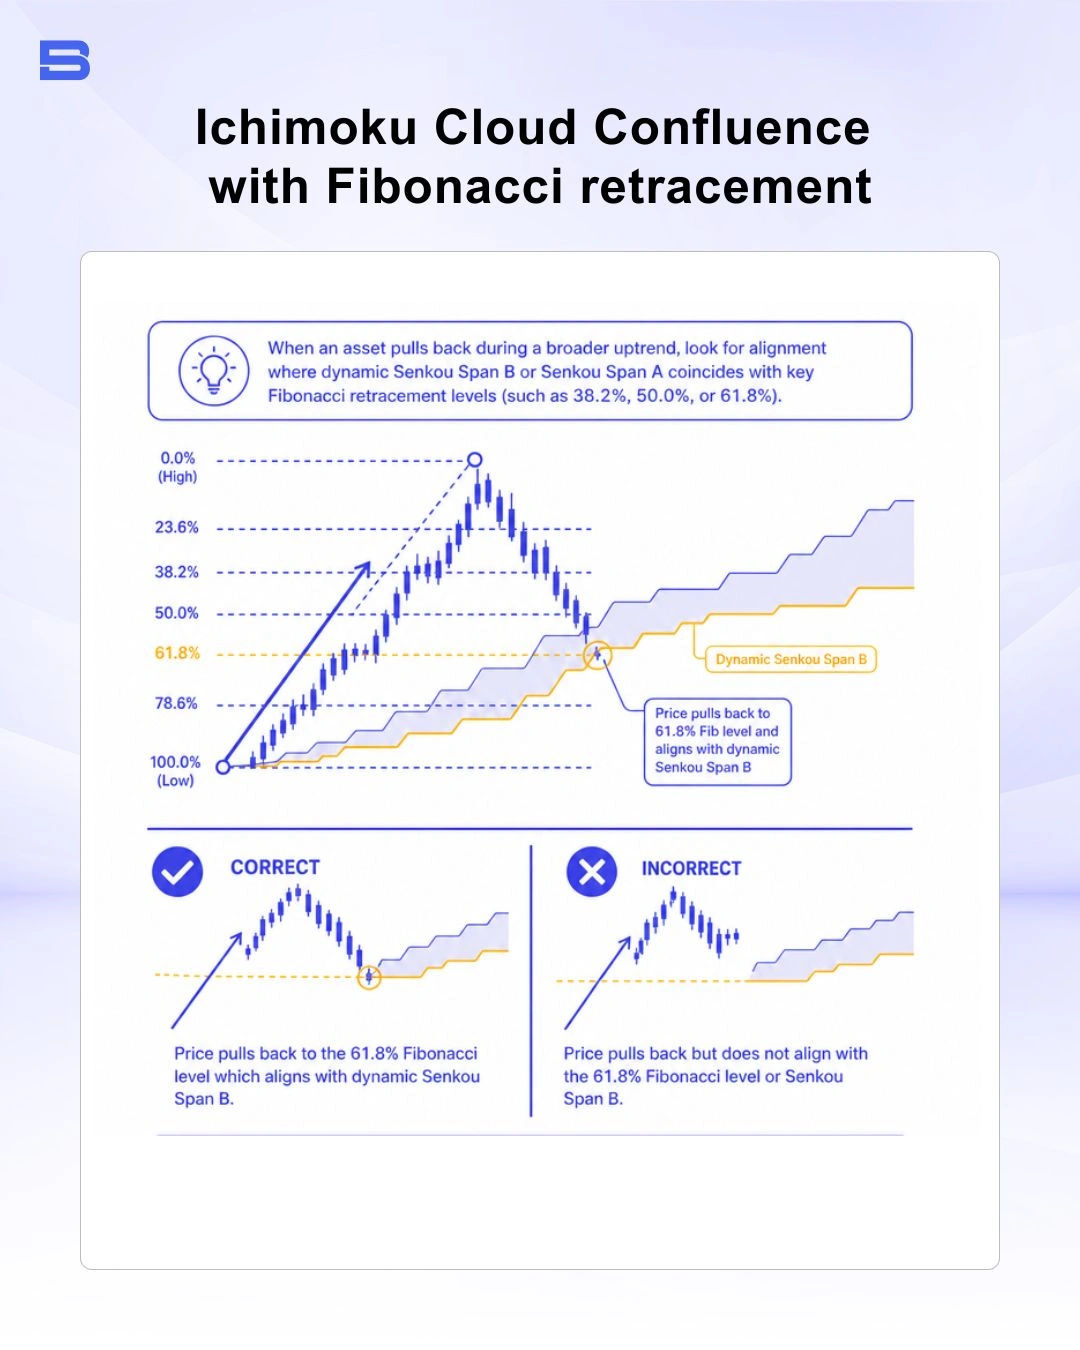
Relying on a single technical system increases exposure to false breakouts during ranging market conditions. Combining the forward projection of the Kumo with Fibonacci retracement levels creates strong confluence zones.
When you see an asset pull back during a broader uptrend, look for alignment between the dynamic Senkou Span B or Senkou Span A and key Fibonacci retracement levels (such as 38.2%, 50.0%, or 61.8%) — that's your confluence zone. When the dynamic Cloud boundary aligns with a major Fibonacci ratio, the resulting price reaction often shows higher structural defense than either indicator provides independently.
Combining Ichimoku Cloud with RSI Indicator Filters
False breakouts regularly occur when price pushes outside the Cloud during light trading volume or low-volatility consolidation. Integrating momentum oscillators like the Relative Strength Index (RSI) indicator adds an external confirmation filter before executing entries.
To filter entry signals effectively:
- Bullish Kumo Breakout Filter: Only take long entries when you see price close above the Kumo and the 14-period RSI sitting above 50 (bullish momentum) but below 70 (so you're not buying into overbought conditions).
- Bearish Kumo Breakout Filter: Only take short entries when you see price close below the Kumo and the RSI sitting below 50 but above 30.
Cross-referencing momentum indicators alongside structural trend overlays filters out low-volume whipsaws during flat market cycles.
The Bottom Line
The Ichimoku cloud remains one of technical analysis's most robust visual systems, consolidating momentum, dynamic equilibrium, and forward projection without requiring secondary window indicators. However, no technical overlay offers guaranteed directional accuracy. To manage risk over the long term, you'll need solid position sizing, a clear stop-loss placed relative to the Senkou Span boundaries, and the discipline to stick to your system.
- How to Build an Investment Plan That Actually Works for You?
- What Is the MACD Indicator and How to Use It
- What Is a Wedge Pattern in Trading?
- What Is Ichimoku Cloud Strategy? A Complete Trading System
- Mastering Elliott Wave Theory: Rules and Trading Strategies
- News Trading: Strategies, Execution Risks, and Risk Control
- What Is an Iron Condor Options Strategy?
- Backtesting Explained: What It Is and Why It Really Matters
- Grid Trading: Mechanics, Parameters, and Risk Strategies
- What Is Breakout Trading and How Does It Work?
- Mean Reversion: Technical Strategies and Risk Frameworks
- Momentum Trading: Indicators, Strategies, and Risk Control
- Hammer Candlestick: Structure, Meaning, and Strategy
- Doji Candlestick: Types, Signals, and Trading Strategies
- What Is the Sharpe Ratio and How to Calculate It
- What Is VWAP and How Do Traders Use It?
- Trade the Ascending Triangle: A Step-by-Step Practical Guide
- What Is the Stochastic Oscillator and How to Use It
- How to Trade the Descending Triangle Pattern
- High Frequency Trading: Speed, Algorithms, and Market Impact
- What Is Volume Profile and How to Use It in Trading
- What Is a Morning Star Pattern Candlestick?
- Trade with Parabolic SAR: A Practical Analysis Guide
- Evening Star Pattern: Structure, Rules, and Risk Controls
- Kelly Criterion: Formula, Position Sizing, and Risk
- What Is the NYSE Minimum Trading Price? Rules Explained
Disclaimer: The content on this page is intended for educational and informational purposes only. It does not constitute financial, investment, tax, or legal advice, and should not be interpreted as a recommendation to buy, sell, or hold any financial instrument or asset. Trading and investing involve significant risk, including the possible loss of your entire capital. Products such as forex, CFDs, and cryptocurrencies carry additional risks due to leverage, high volatility, and limited regulatory protection in some jurisdictions. Past performance of any financial instrument does not guarantee future results. Any market views, forecasts, or opinions expressed are those of the author at the time of writing and may not reflect current market conditions. Platform features, fees, and regulatory status are subject to change — always verify information directly with the relevant provider or regulator before making any financial decision. BrokerSpecs may receive compensation from third parties featured on this site. Always conduct your own due diligence and consider seeking advice from a licensed financial professional before investing. Portions of this article were prepared with the assistance of AI tools and reviewed by our editorial team before publication.