



Related Tags
You open your charting screen, and the candlestick bars flicker erratically with every breaking news headline. It is easy to feel disoriented when short-term volatility pulls prices in conflicting directions. Building a reliable investment plan requires looking past this daily commotion to identify the market's true underlying momentum.
What Is the Dow Theory and How Does It Work?
The Dow Theory is a foundational technical analysis framework asserting that asset prices reflect all available information and move in identifiable, multi-tiered trends. Developed from Wall Street Journal editorials written by Charles H. Dow around the turn of the 20th century, the model provides a structured way to decode market behavior.
Dow believed that individual stock prices rarely move in isolation. Instead, broad macroeconomic health drives equity valuations, which market prices discount almost instantaneously. Modern benchmark indexes are widely used as gauges of overall market direction and investor sentiment. While later technicians explored geometric cycles through frameworks like Gann Theory, Dow focused entirely on real market supply, demand, and confirmed index direction.
The 6 Core Tenets of Dow Theory Explained
To turn market chaos into orderly analysis, Charles Dow established six foundational principles. These axioms continue to anchor contemporary technical analysis. Later analysts expanded these principles into modern pattern structures like Elliott Wave Theory.
Tenet 1: The Market Discounts Everything
The first of the six tenets of Dow Theory says that market prices already reflect all available information, from earnings reports to economic data. For that reason, Dow studied price action itself rather than trying to predict the news.
The Three Market Trends: Primary, Secondary, and Minor
Dow compared price action to ocean movements, splitting market activity into primary, secondary, and minor trend horizons. Understanding these three layers helps you avoid confusing routine pullbacks with the start of a major downturn.
The primary trend represents the ocean tide, persisting anywhere from one year to several years. Secondary trends act as waves pushing against that tide, producing counter-trend corrections that typically last three weeks to three months. Minor trends are mere ripples on the surface, lasting less than three weeks, and primarily represent daily market noise.
The table below summarizes the three trend types.
| Trend | Typical Duration | Ocean Analogy | What It Represents |
|---|---|---|---|
| Primary | One year to several years | Tide | The main market direction |
| Secondary | Three weeks to three months | Waves | Counter-trend corrections |
| Minor | Less than three weeks | Ripples | Daily market noise |
The Three Phases of Every Primary Trend: Accumulation, Public Participation, and Distribution
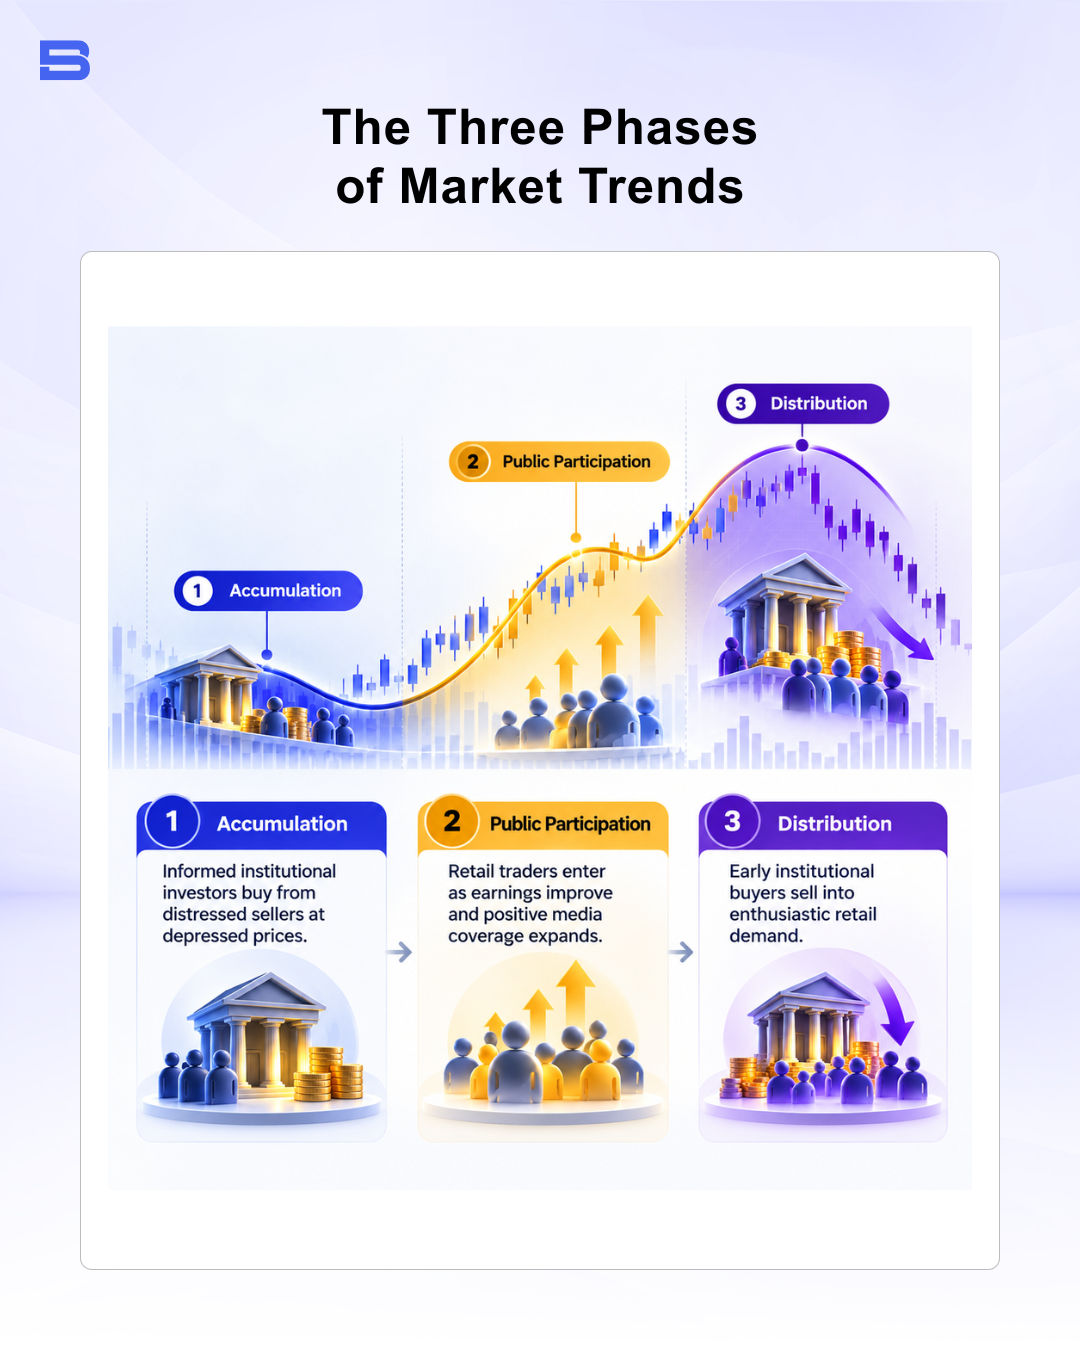
Every primary bull or bear market travels through three distinct psychological stages. Recognizing which phase may be active can help you avoid buying when institutional players appear to be exiting, although phases are often clearer in hindsight.
The cycle begins with the accumulation phase, where informed institutional investors buy assets from distressed sellers at depressed prices. Next comes public participation, where retail traders and trend followers enter as corporate earnings improve and positive media coverage expands.
Finally, the distribution phase typically begins as early institutional buyers are thought to sell their holdings into enthusiastic retail demand. This institutional rotation is a core idea behind volume-based approaches such as the Wyckoff Method.
Index Confirmation: Why Averages Must Validate the Move
Under Dow's original framework, the averages must confirm each other before you can declare a valid bull market. In Dow's era, industrial companies could produce goods, but those goods could not create real revenue unless rail lines transported them to market.
A rally in the Dow Jones Industrial Average required a corresponding rally in the Dow Jones Transportation Average to prove economic health. If industrial manufacturers hit record peaks while transportation stocks lagged, Dow treated the divergence as an early warning of economic stalling. Today, equity traders apply this same confirmation rule by pairing the S&P 500 with the Nasdaq composite or semiconductor sector indexes.
Why Trading Volume Must Confirm Price Action
Price movement alone does not tell the complete story; volume must confirm the trend direction. Trading volume serves as a direct gauge of institutional participation and conviction.
In an authentic uptrend, trading activity should expand as prices climb and contract when prices pull back in secondary corrections. If an index pushes to new highs on declining volume, buy-side momentum is likely exhausting. Conversely, heavy volume during a selloff may indicate institutional distribution, which calls for caution.
Identifying Bullish and Bearish Trend Reversals
Dow Theory dictates that an established trend remains in effect until definitive reversal signals emerge. Rather than trying to guess absolute tops or bottoms, you track the progression of structural swing points.
An intact bull market forms a clear stair-step pattern of higher highs and higher lows. A bearish trend reversal requires a rally that fails to reach the previous peak, followed by a break below the preceding swing low.
Consider a worked scenario where a benchmark index trades at 10,000 points and advances to 10,800 points. It then slides into a secondary correction down to 10,400 points over a four-week period.
If buyers step in and push the index to 11,100 points, the primary uptrend remains structurally healthy. However, if the market rallies only to 10,700 points and breaks below 10,400 points, Dow Theory confirms a structural reversal into a bear market.
How Dow Theory Forex Analysis Works Across Currency Markets
While Charles Dow formulated his theory around US industrial equities, modern traders routinely adapt these axioms to currency pairs. Adapting Dow Theory forex strategies requires translating corporate index confirmation into macroeconomic currency pair dynamics.
Because the spot forex market is decentralized without centralized volume, traders look at broker tick volume (a count of price updates used as a proxy for activity) and cross-pair correlation. For example, a bullish move in EUR/USD gains institutional credibility when confirmed by a similar advance in GBP/USD against a weakening US dollar. Currency traders use multi-month primary swings to dictate directional bias, looking for entries only on daily secondary pullbacks.
Common Dow Theory Limitations and Lagging Signal Risks
Dow Theory offers a useful big-picture view of market direction, but relying on it exclusively exposes traders to distinct structural risks. Because confirmation requires waiting for secondary peaks and troughs to validate, signals naturally lag the market.
You will rarely enter at the bottom of a market or exit at the absolute top. In choppy, range-bound environments, waiting for index confirmation can trigger false breakouts and whipsaws (sharp reversals that quickly undo a move) that erode trading capital.
No technical methodology can eliminate downside volatility, so successful implementation requires strict position sizing and predefined stop-loss orders to limit losses when market conditions change.
Respecting the Primary Trend, Ignoring the Noise
Dow Theory is not a rapid-fire trading indicator designed to capture overnight windfalls. It is a long-established framework that teaches you to respect broad market momentum and ignore short-term noise. By waiting for volume confirmation and index alignment, you may be better placed to trade in the direction of broader market momentum, though confirmation never guarantees an outcome.
- How to Build an Investment Plan That Actually Works for You?
- What Is the MACD Indicator and How to Use It
- What Is a Wedge Pattern in Trading?
- What Is Ichimoku Cloud Strategy? A Complete Trading System
- Mastering Elliott Wave Theory: Rules and Trading Strategies
- News Trading: Strategies, Execution Risks, and Risk Control
- What Is an Iron Condor Options Strategy?
- Backtesting Explained: What It Is and Why It Really Matters
- Grid Trading: Mechanics, Parameters, and Risk Strategies
- What Is Breakout Trading and How Does It Work?
- Mean Reversion: Technical Strategies and Risk Frameworks
- Momentum Trading: Indicators, Strategies, and Risk Control
- Hammer Candlestick: Structure, Meaning, and Strategy
- Doji Candlestick: Types, Signals, and Trading Strategies
- What Is the Sharpe Ratio and How to Calculate It
- What Is VWAP and How Do Traders Use It?
- Trade the Ascending Triangle: A Step-by-Step Practical Guide
- What Is the Stochastic Oscillator and How to Use It
- How to Trade the Descending Triangle Pattern
- High Frequency Trading: Speed, Algorithms, and Market Impact
- What Is Volume Profile and How to Use It in Trading
- What Is a Morning Star Pattern Candlestick?
- Trade with Parabolic SAR: A Practical Analysis Guide
- Evening Star Pattern: Structure, Rules, and Risk Controls
- Kelly Criterion: Formula, Position Sizing, and Risk
- What Is the NYSE Minimum Trading Price? Rules Explained
Disclaimer: The content on this page is intended for educational and informational purposes only. It does not constitute financial, investment, tax, or legal advice, and should not be interpreted as a recommendation to buy, sell, or hold any financial instrument or asset. Trading and investing involve significant risk, including the possible loss of your entire capital. Products such as forex, CFDs, and cryptocurrencies carry additional risks due to leverage, high volatility, and limited regulatory protection in some jurisdictions. Past performance of any financial instrument does not guarantee future results. Any market views, forecasts, or opinions expressed are those of the author at the time of writing and may not reflect current market conditions. Platform features, fees, and regulatory status are subject to change — always verify information directly with the relevant provider or regulator before making any financial decision. BrokerSpecs may receive compensation from third parties featured on this site. Always conduct your own due diligence and consider seeking advice from a licensed financial professional before investing. Portions of this article were prepared with the assistance of AI tools and reviewed by our editorial team before publication.