


Related Tags
You open your chart to catch a developing forex breakout, only to get shaken out three candles later by a brief counter-trend spike. The market immediately resumes its original direction without you, leaving behind a trail of confusing wicks and mixed candle colors.
This constant noise is one of the most frustrating hurdles in technical analysis. Standard candlestick charts show raw market volatility, but they frequently lure traders into premature exits or false reversals. This is where the technique comes into play—offering a smoothed visual perspective designed to filter market clutter while keeping you aligned with the underlying trend.
What Is Heikin Ashi and How Does It Work in Trading?
Originating from the Japanese phrase for "average bar," Heikin Ashi is a modified candlestick charting technique created to filter short-term market noise. Unlike traditional charts that plot raw transaction prices, the technique modifies open, high, low, and close values using a moving average formula.
The result is a streamlined chart where directional trends appear as continuous blocks of uniform colors. Upward trends are dominated by consecutive green (or white) candles, while downward trends display consistent red (or black) candles. By averaging price movements across adjacent periods, it visualizes persistent buying or selling pressure rather than erratic tick-by-tick fluctuations.
However, you must remember that this technique is an analytical overlay rather than an execution model. The values displayed on these candles do not reflect current market fill prices. Understanding this visual distinction allows you to isolate macro trends without losing sight of actual trading costs.
Reading Heikin Ashi Candle Bodies and Wicks
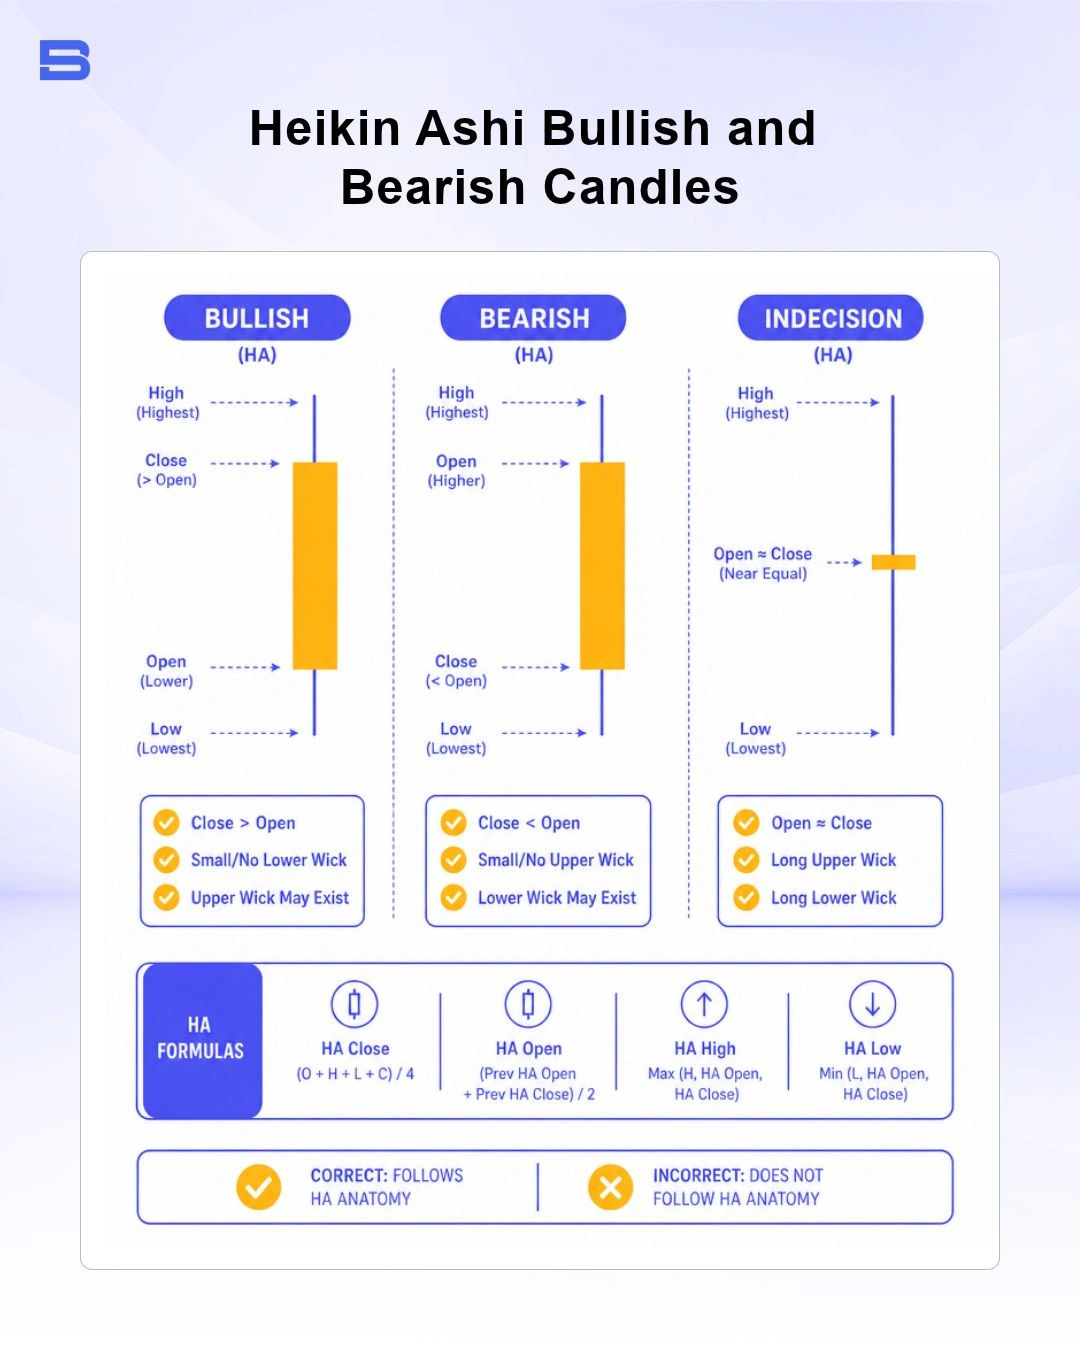
Interpreting the technique candle anatomy requires a different approach than reading traditional patterns like hammer or engulfing candles. Because the open price is tethered to the prior candle's midpoint, the wicks signal structural trend strength or momentum loss:
- Strong Bullish Trend: Large green candle bodies with distinct upper wicks and no lower wicks. The absence of a lower wick indicates buyers maintained dominant control throughout the period.
- Strong Bearish Trend: Large red candle bodies with distinct lower wicks and no upper wicks. The lack of an upper wick signals uninterrupted selling pressure.
- Consolidation or Trend Indecision: Small candle bodies paired with long upper and lower wicks. These resemble spinning tops or doji patterns, signaling a potential shift in momentum or market pause.
The Four Formulas: How Are Heikin Ashi Candles Calculated?
These four calculations are commonly abbreviated as HA-Close, HA-Open, HA-High, and HA-Low — 'HA' simply stands for Heikin Ashi. To understand why it produces smooth sequences, you must look at its four underlying mathematical calculations:
- HA-Close = (Open + High + Low + Close) / 4
- HA-Open = (HA-Open_previous + HA-Close_previous) / 2
- HA-High = max(High, HA-Open, HA-Close)
- HA-Low = min(Low, HA-Open, HA-Close)
Because HA-Open is structurally tied to the midpoint of the previous candle, each new bar originates from the center of its predecessor. This mathematical linkage eliminates artificial price gaps and creates cohesive visual sequences across trending cycles.
Managing the Averaging Lag in Fast Markets
Because its calculation averages current and past market data, it inherently introduces structural lag. While this lag successfully absorbs erratic price spikes, it slows down real-time trend detection during abrupt market reversals.
If you rely on candles alone during fast-moving economic news releases, your entry signals will trigger after a significant portion of the move has already occurred. High-frequency scalpers and intraday traders must exercise caution—using HA charts to identify dominant directional bias while monitoring raw execution pricing elsewhere.
How to Read Standard Candlestick Charts vs. Heikin Ashi
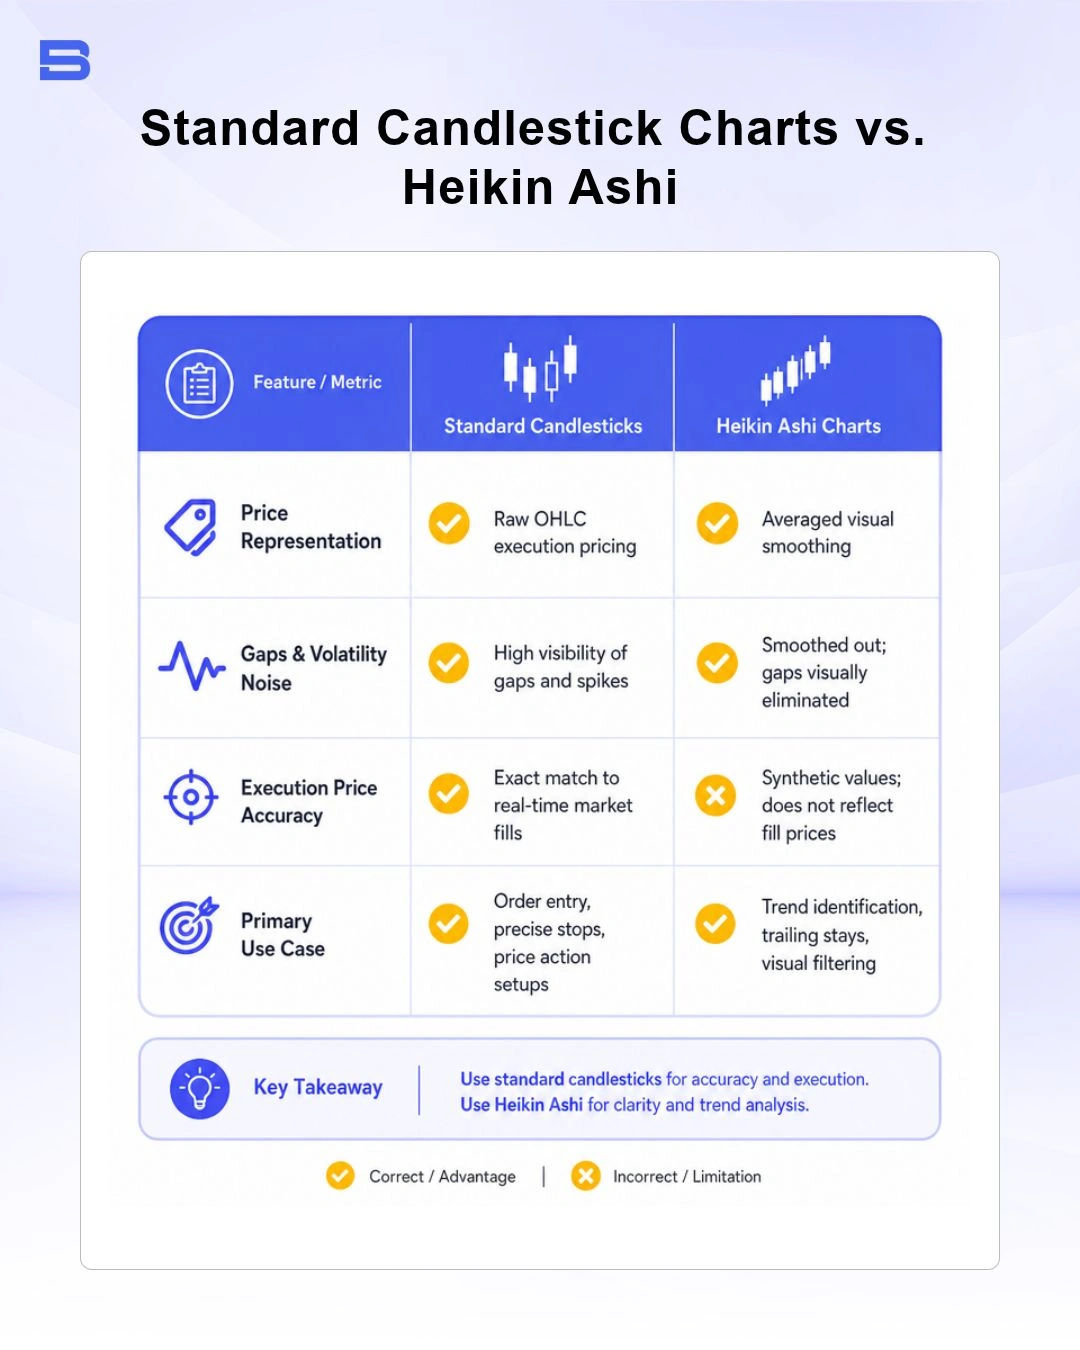
Standard candlestick charts display real-time transaction data. Every candle's open, high, low, and close levels represent exact market prices where orders were filled. This raw representation makes standard charts indispensable for order execution, exact pattern recognition, and precise support or resistance mapping.
In contrast, the charts prioritize visual clarity over raw precision. By smoothing out erratic price action, they make trend progression easy to follow, but they mask exact transaction levels in the process.
Heikin Ashi vs. Renko Charts: What's the Difference?
Traders seeking noise reduction often compare this technique with Renko charts, but the two tools operate on fundamentally different mechanics.
It remains bound to time frames. Whether set to a 15-minute or daily interval, a new candle forms once the time period closes, regardless of how far the price moves.
Renko charts completely discard time. They plot uniform price bricks strictly when the market moves a pre-defined point distance (such as 20 pips). If the price consolidates within a tight range for hours, a Renko chart remains stationary. While Renko charts highlight pure price distance, Heikin Ashi preserves time-series structure, enabling you to combine smoothed visual trends with standard time-based indicators.
Step-by-Step Strategy: How to Trade with Heikin Ashi Charts
Trading effectively with Heikin Ashi requires combining its visual signals with robust technical filters to avoid entering late in lagged trends. (New to these tools? An EMA traces the average trend direction, while RSI and OBV simply help confirm whether momentum and volume genuinely support the move.)
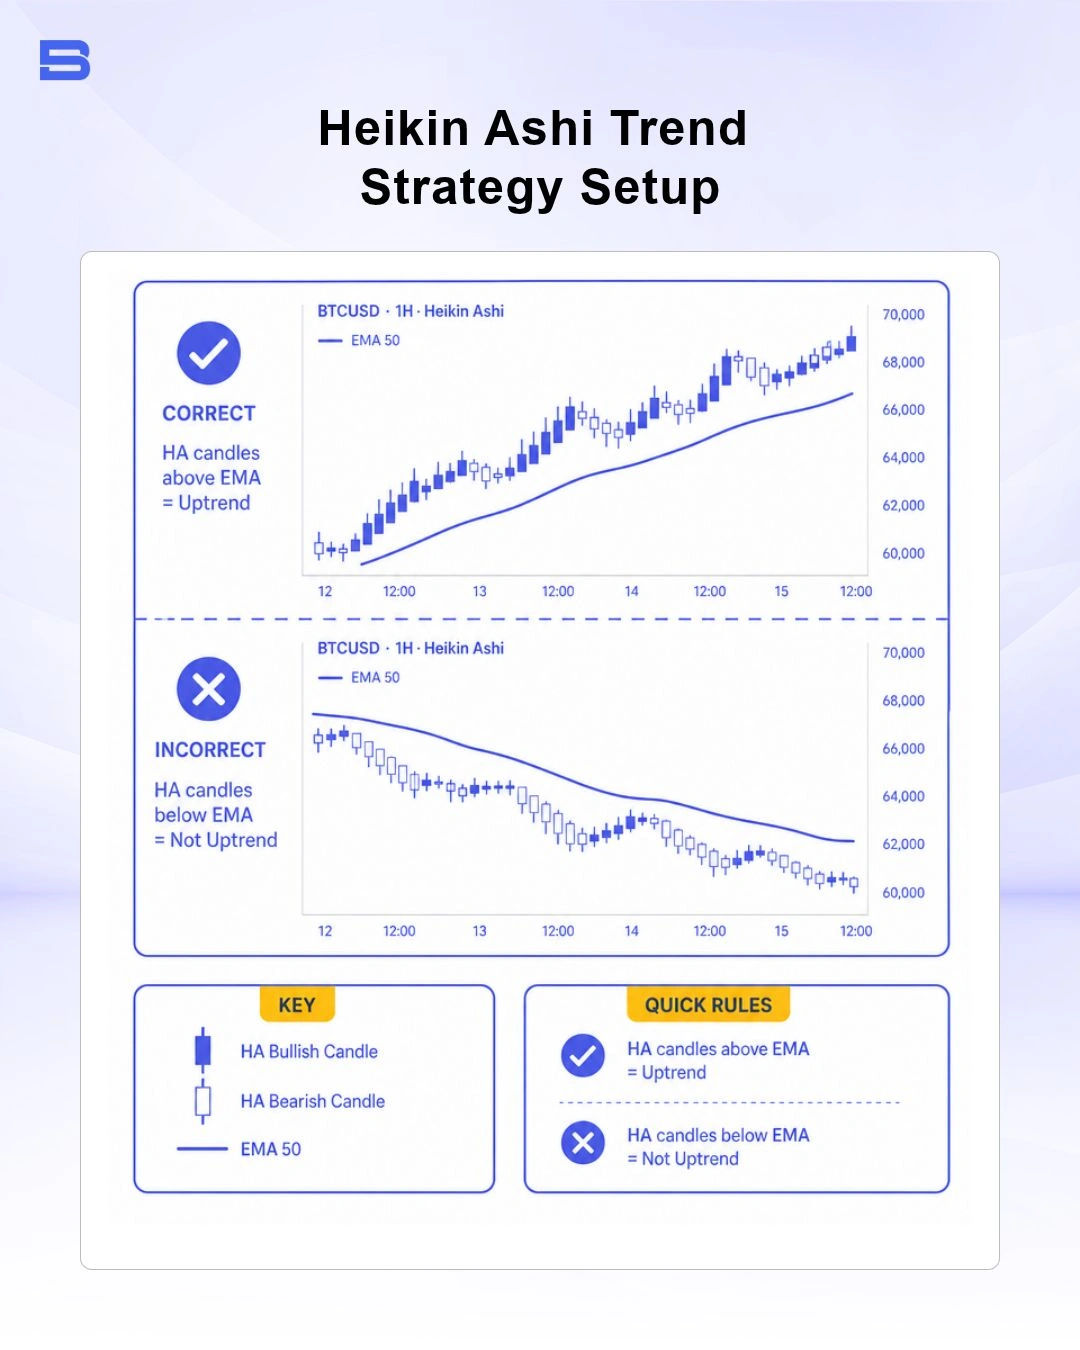
- Establish the Trend Filter: Overlay an Exponential Moving Average (EMA), such as a 50-period EMA, on your chart to confirm macro direction. Only seek long setups when price trades above the EMA line.
- Wait for Consolidation: Look for a series of small-bodied dojis or spinning tops pulling back toward the EMA, signaling weakening counter-trend momentum.
- Confirm Momentum Expansion: Enter when a large bullish candle forms with a clear upper wick and no lower wick, confirming buying pressure has resumed.
- Validate Momentum Levels: Cross-reference the entry with the Relative Strength Index (RSI) indicator or On-Balance Volume (OBV) to confirm that momentum and volume support the breakout.
Traders can also combine this framework with breakout levels derived from Donchian channel boundaries — bands drawn from the highest high and lowest low over a set lookback period — or structural levels mapped with Fibonacci retracement toolsets.
Real-Price Stop Loss Placement and Risk Control
A severe trap for novice traders is setting stop-loss orders directly on a Heikin Ashi candle's low or high. Because the levels are averaged, an HA candle low might sit several pips away from the actual market price. Setting a stop on synthetic levels leads to unexpected fills, severe slippage, or premature liquidations.
Always switch your platform view back to a standard candlestick chart to identify raw Open, High, Low, and Close (OHLC) swing lows or resistance points before placing live pending orders. Ensure your live execution broker operates under strict regulatory standards—such as those enforced by the US Securities and Exchange Commission (SEC), the Financial Conduct Authority (FCA), or the Securities Commission Malaysia (SC)—to ensure transparent pricing and reliable order fills.
Worked Trading Example: Euro and US Dollar (EUR/USD) Strategy
- Setup: EUR/USD is trending upward above its 50-period EMA on a 1-hour chart.
- Signal: A minor pullback yields two small red HA candles, followed by a strong green HA candle with no lower wick.
- HA Candle Display: HA Low reads 1.0820, HA Close reads 1.0855.
- Real Market Execution Check: Switching to standard OHLC charts reveals the real ask price is 1.0858, and the actual technical swing low sits at 1.0812.
- Risk Calculation: You place a buy order at the real ask of 1.0858, placing a stop loss at the real price low of 1.0810 (48 pips risk). On a $10,000 account risking 1% ($100 max loss), your position size is calculated using the 48-pip real market risk rather than the synthetic 35-pip HA risk.
The Bottom Line
Heikin Ashi offers a clear, practical framework for cutting through short-term market noise and following established trends with greater consistency. By smoothing out erratic price action, it helps you avoid emotional over-trading and premature exits.
However, always treat the technique as a visual lens rather than an execution chart. Pair its smoothed visual signals with real OHLC charts for stop placement, confirm momentum with external indicators, and maintain strict position sizing on every trade.
- How to Build an Investment Plan That Actually Works for You?
- What Is the MACD Indicator and How to Use It
- What Is a Wedge Pattern in Trading?
- What Is Ichimoku Cloud Strategy? A Complete Trading System
- Mastering Elliott Wave Theory: Rules and Trading Strategies
- News Trading: Strategies, Execution Risks, and Risk Control
- What Is an Iron Condor Options Strategy?
- Backtesting Explained: What It Is and Why It Really Matters
- Grid Trading: Mechanics, Parameters, and Risk Strategies
- What Is Breakout Trading and How Does It Work?
- Mean Reversion: Technical Strategies and Risk Frameworks
- Momentum Trading: Indicators, Strategies, and Risk Control
- Hammer Candlestick: Structure, Meaning, and Strategy
- Doji Candlestick: Types, Signals, and Trading Strategies
- What Is the Sharpe Ratio and How to Calculate It
- What Is VWAP and How Do Traders Use It?
- Trade the Ascending Triangle: A Step-by-Step Practical Guide
- What Is the Stochastic Oscillator and How to Use It
- How to Trade the Descending Triangle Pattern
- High Frequency Trading: Speed, Algorithms, and Market Impact
- What Is Volume Profile and How to Use It in Trading
- What Is a Morning Star Pattern Candlestick?
- Trade with Parabolic SAR: A Practical Analysis Guide
- Evening Star Pattern: Structure, Rules, and Risk Controls
- Kelly Criterion: Formula, Position Sizing, and Risk
- What Is the NYSE Minimum Trading Price? Rules Explained
Disclaimer: The content on this page is intended for educational and informational purposes only. It does not constitute financial, investment, tax, or legal advice, and should not be interpreted as a recommendation to buy, sell, or hold any financial instrument or asset. Trading and investing involve significant risk, including the possible loss of your entire capital. Products such as forex, CFDs, and cryptocurrencies carry additional risks due to leverage, high volatility, and limited regulatory protection in some jurisdictions. Past performance of any financial instrument does not guarantee future results. Any market views, forecasts, or opinions expressed are those of the author at the time of writing and may not reflect current market conditions. Platform features, fees, and regulatory status are subject to change — always verify information directly with the relevant provider or regulator before making any financial decision. BrokerSpecs may receive compensation from third parties featured on this site. Always conduct your own due diligence and consider seeking advice from a licensed financial professional before investing. Portions of this article were prepared with the assistance of AI tools and reviewed by our editorial team before publication.