


Related Tags
Imagine a trading session where aggressive sellers push the price of an asset down to fresh lows, threatening to extend a painful, multi-week downtrend. Midday, the selling pressure suddenly stalls, and a wave of buyer volume steps in to lift price action all the way back up to near the opening mark.
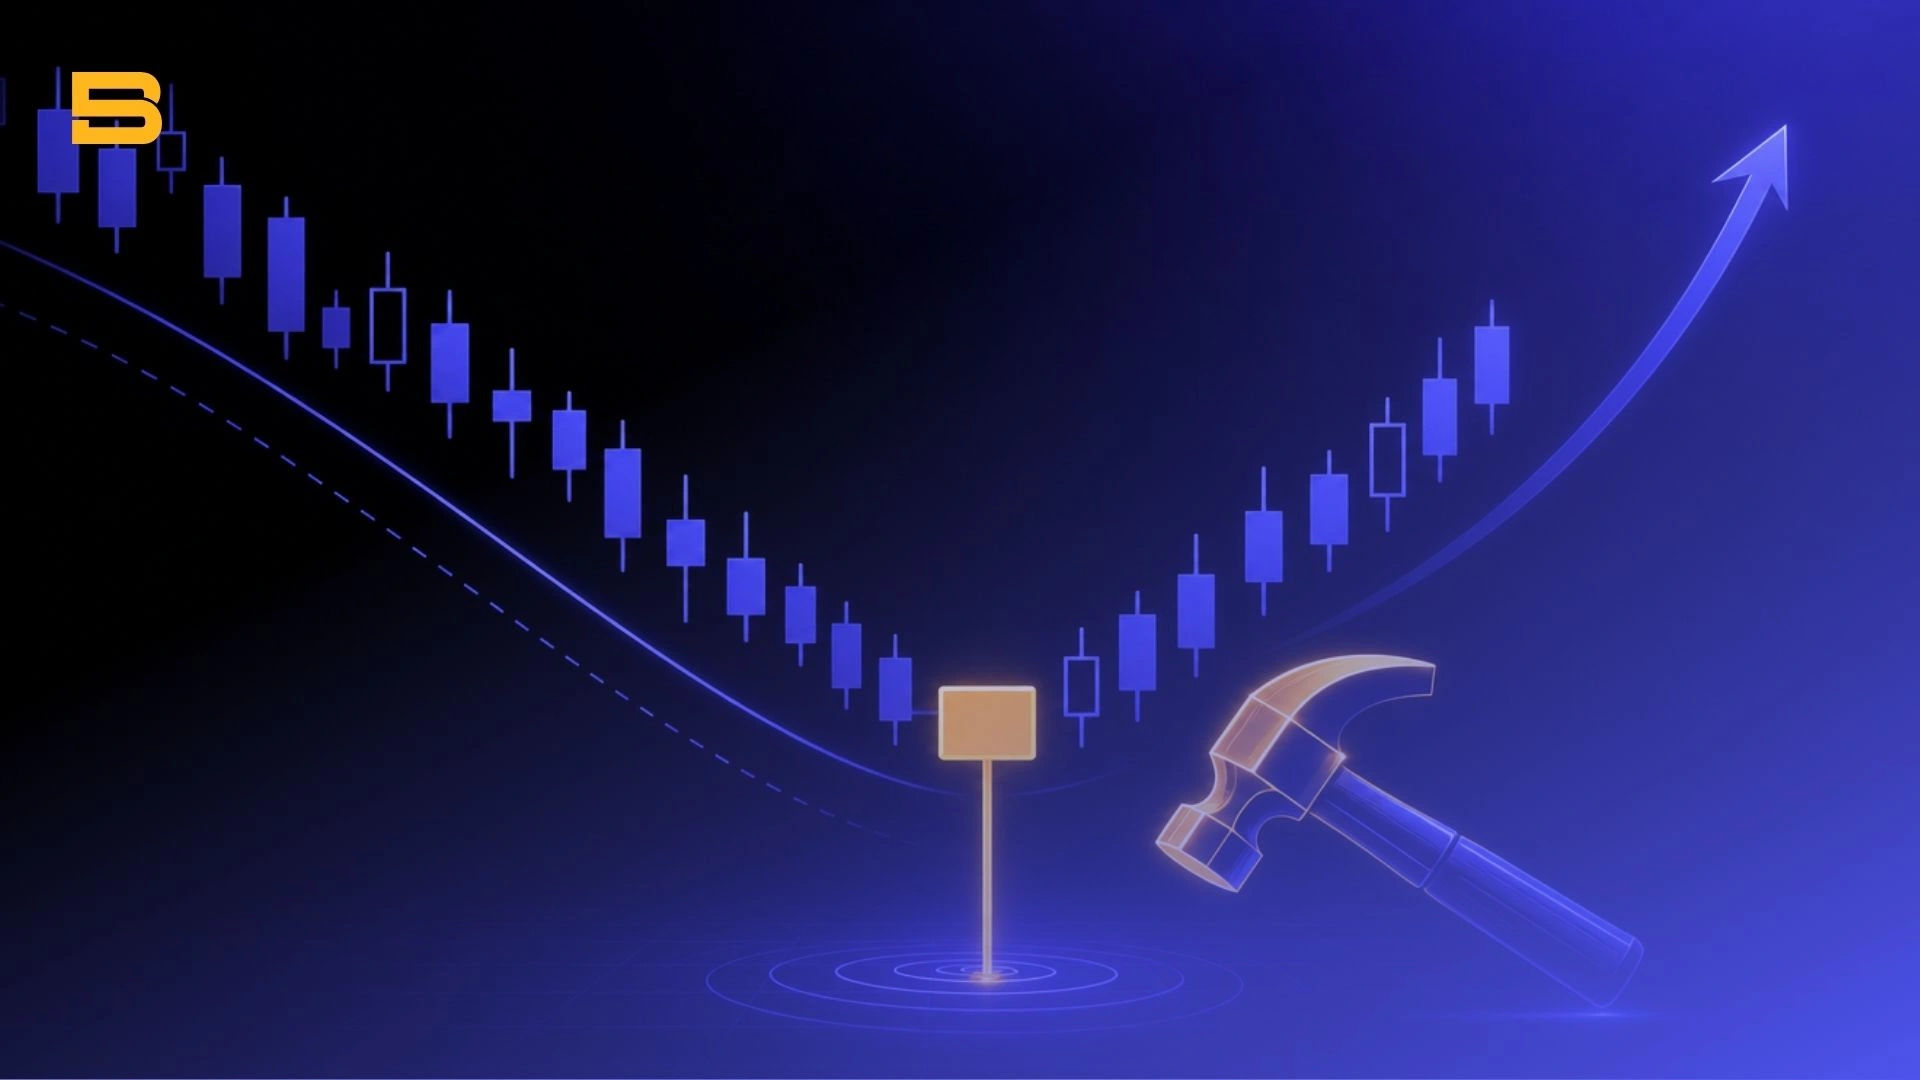
When you view this dynamic session on a chart, it leaves behind a distinct shape: a small upper body sitting atop a tall, lower tail. This visual footprint is the hammer candlestick pattern—a classic price action formation that alerts technical traders to a potential shift from selling dominance to buying momentum.
What Is a Hammer Candlestick Pattern?
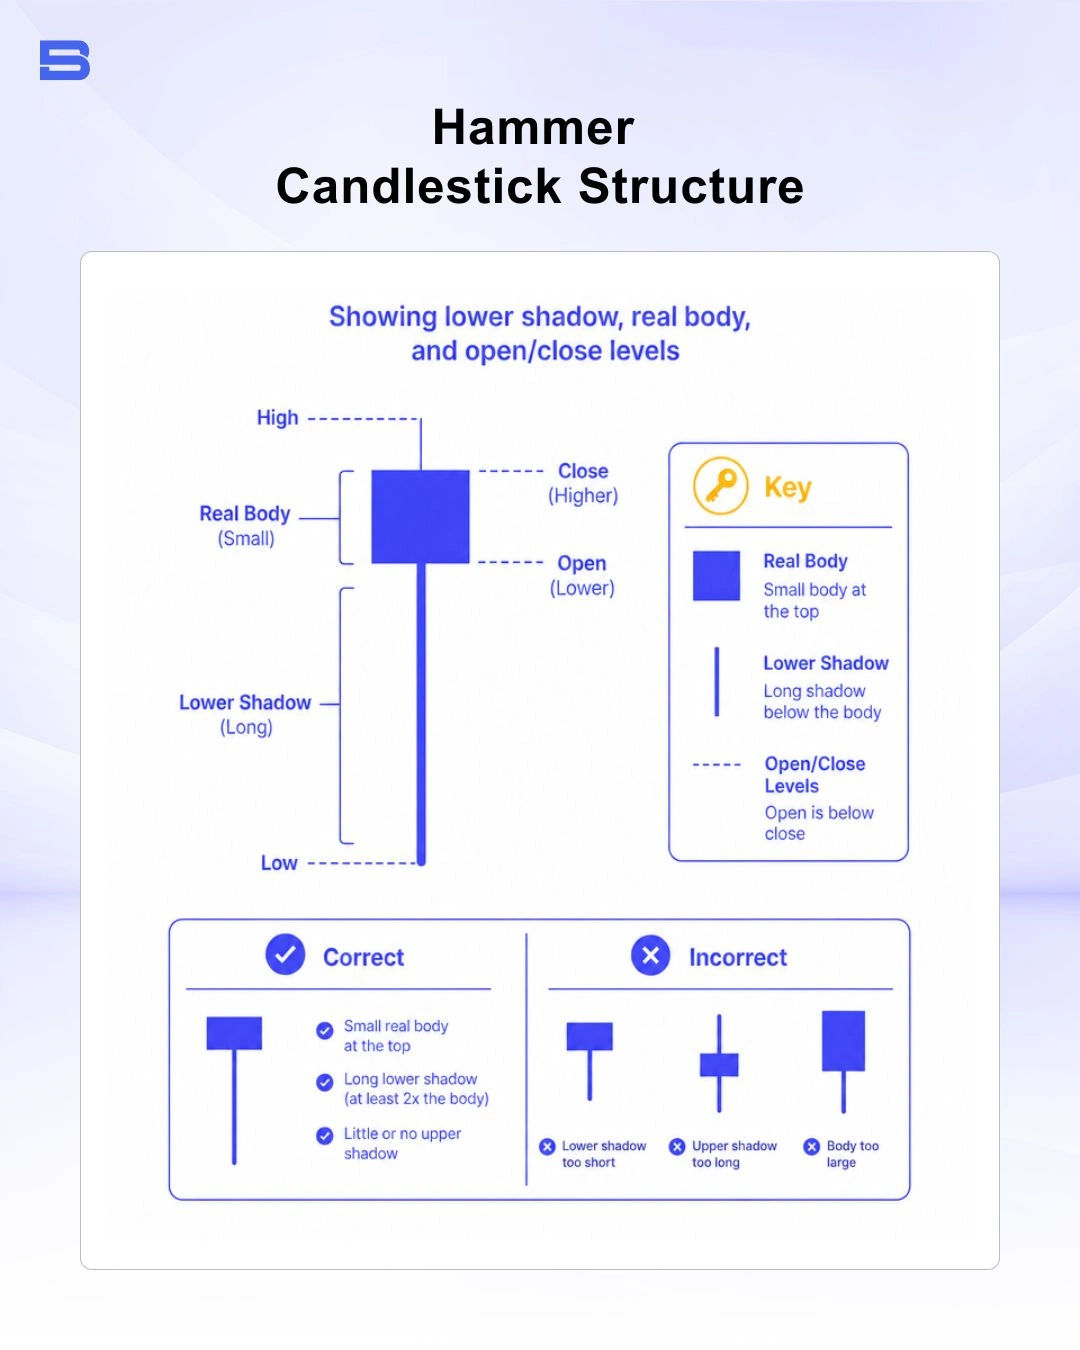
A hammer candlestick is a single-candle bullish reversal chart pattern characterized by a small real body near the top of the price range and a long lower shadow at least twice its length.
When evaluating what a hammer candlestick means, technical traders look closely at its location within the market structure. For a hammer pattern to exist, it must form after a prolonged downtrend or at a key support level.
This contextual requirement helps answer a common beginner question: is a hammer candlestick bullish or bearish? While the shape itself represents intraday buyer strength, the pattern is inherently bullish because it signals the potential exhaustion of an established downtrend.
The anatomy of a hammer candlestick consists of three distinct visual components:
- A small real body: Located at the top of the price range. The distance between the open and close is narrow.
- A long lower shadow: Extends downward, measuring at least double the height of the real body, representing intraday seller rejection.
- Little to no upper shadow: The close occurs very near or directly at the high of the candle, indicating buyers maintained control until the session end.
The market psychology behind this formation is straightforward. Sellers begin the session in control, driving prices significantly lower to test new depths. However, as prices drop, buyers perceive the asset as undervalued and enter the market aggressively. This surge of buying power absorbs the available sell orders, driving the price back up to close near the open.
How to Identify a Valid Hammer Candlestick on a Chart
Not every candlestick with a long lower wick qualifies as a tradeable hammer candlestick. To filter out market noise and false signals, you must systematically evaluate three specific structural criteria.
First, verify the preceding trend. A hammer candle forming in the middle of a sideways consolidation or an established uptrend does not hold bullish reversal implications. The price must be coming off a clear sequence of lower lows and lower highs.
Second, measure the ratio between the lower shadow and the body. The lower shadow must be at least two times longer than the real body—ideally three times longer in high-volatility assets like foreign exchange or cryptocurrencies.
Third, evaluate the color of the candle body:
- Green (Bullish) Hammer: The closing price is above the opening price. This shows that buyers not only erased all intraday losses but actively forced the session to close higher than where it started, representing strong bullish sentiment.
- Red (Bearish Color) Hammer: The closing price remains slightly below the opening price. Buyers still managed a strong recovery from the low, but sellers prevented a net positive gain for the period. A red hammer is still a valid reversal structure, but it carries slightly less immediate momentum than a green hammer.
Hammer vs. Hanging Man: Key Differences
Traders often confuse the pattern with the hanging man pattern because both share an identical physical shape: a small real body, a long lower shadow, and minimal upper wick.
The fundamental difference lies entirely in where the candle forms within a trend:
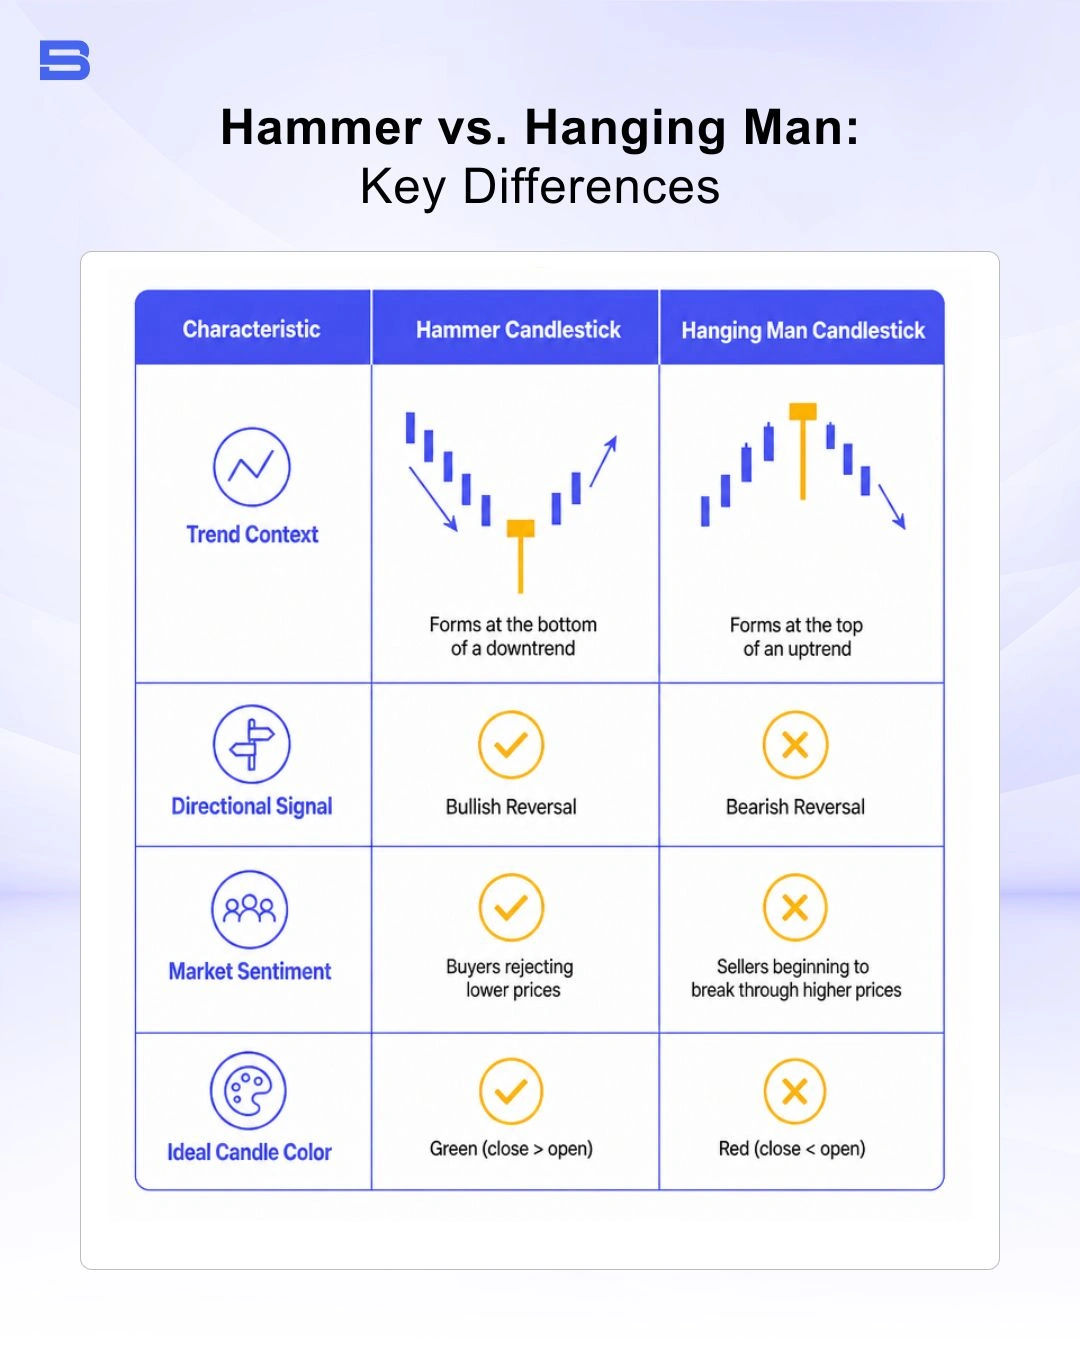
While a hammer demonstrates buyers defending lower price levels after a drop, a hanging man appearing after a long rise indicates that severe selling pressure occurred during the session. Even if buyers pushed the price back up before the close, the presence of that long lower wick at market highs signals that the uptrend's structural integrity is fracturing.
How to Trade the Hammer Candlestick Pattern
Trading the hammer pattern effectively requires combining the signal with proper entry techniques, clear confirmation rules, and strictly defined risk parameters.
Waiting for Confirmation Before Entry
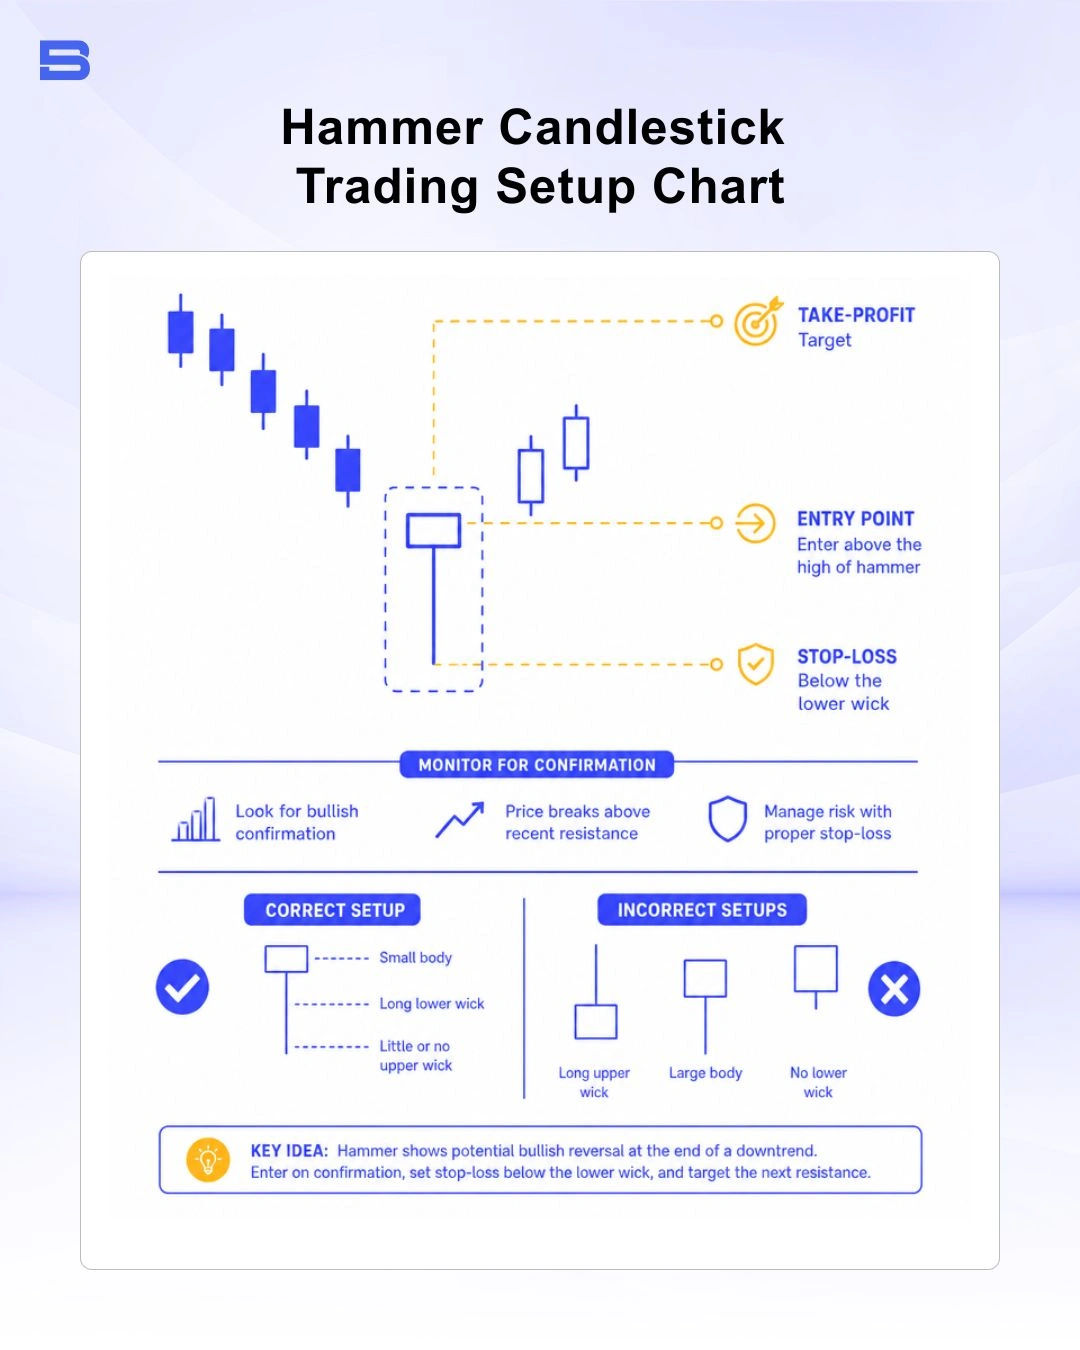
Never enter a position the moment a hammer candlestick closes. Entering prematurely exposes your portfolio to high execution risk if the underlying trend simply resumes its downward path.
Waiting for hammer candlestick confirmation means delaying entry until the subsequent candle closes above the hammer's high or high-water close mark. This confirmation candle validates that buyer momentum has carried over into the next period, reducing the chance of buying into a temporary pause in selling.
Worked Example: Risk-Reward Setup
To manage risk properly, always calculate your position parameters before execution using a pre-set risk-reward framework.
Suppose an asset has dropped from $120.00 down to a key horizontal support level at $100.00, where a valid hammer candle forms.
- Hammer Candle Low: $98.00
- Hammer Candle Close: $101.00
- Confirmation Candle Close (Entry Point): $102.00
- Stop-Loss Placement: Set slightly below the hammer low at $98.00 (Risking $4.00 per unit).
- Take-Profit Target: Set at the next major resistance level at $110.00 (Reward of $8.00 per unit).
In this scenario, your potential risk is $4.00 per unit, while your prospective profit target is $8.00 per unit. This delivers a clean 1:2 risk-reward ratio, ensuring that your expected return justifies the capital placed at risk.
Risk Management and Limitations of Trading the Hammer Pattern
A critical question for developing traders is: how reliable is a hammer candlestick pattern in live market conditions? While the pattern provides clear visual insights into market sentiment, no single technical signal achieves a 100% win rate or operates without risk.
The primary limitation of trading an isolated hammer candle is the potential for a false reversal. During strong, macro-driven downtrends, a hammer may reflect temporary short-covering rather than sustained buying pressure or genuine accumulation. If selling pressure returns after this brief rebound, prices can fall below the hammer’s lower shadow and trigger stop-loss orders.
This highlights the importance of confirmation and disciplined risk management, consistent with the International Organization of Securities Commissions (IOSCO) emphasis on managing investment risks and protecting investors from unexpected losses.
To mitigate execution risk, combine the pattern with confluent technical tools:
- Key Support Zones: Look for hammers forming at historical horizontal support, major trendlines, or key Fibonacci levels.
- Volume Analysis: A valid hammer accompanied by above-average trading volume indicates higher institutional participation during the intraday recovery.
- Oscillators: Check if momentum indicators, such as the Relative Strength Index (RSI) indicator, show oversold conditions or bullish divergence while the hammer forms.
- Moving Averages: Look for price rejections off major moving averages like the 50-day or 200-day simple moving average.
Using a higher timeframe, such as the 4-hour or daily chart, can provide broader market context and help traders distinguish significant price patterns from short-term fluctuations. Lower timeframes, such as 1-minute or 5-minute charts, provide greater price detail but can also produce more frequent short-term volatility and conflicting signals.
Comparing Hammer to Other Reversal Patterns
This candle is part of a broader family of price action patterns used to spot market turns. Understanding how it compares to alternative candlestick structures strengthens your technical analysis toolbox.
- Doji Candlestick: A doji features virtually identical open and close prices, creating a cross-like appearance. Unlike the directional buyer recovery seen in a hammer, a doji indicates total market indecision between buyers and sellers.
- Engulfing Pattern: A bullish engulfing pattern is a two-candle formation where a large green body completely covers the body of the preceding red candle. It represents a more aggressive shift in immediate momentum than a single hammer candle.
- Shooting Star Candlestick: Visually, a shooting star is an inverted hammer appearing at the top of an uptrend. It features a long upper shadow and signals bearish rejection of higher prices.
- Morning Star Pattern: A three-candle bullish reversal pattern consisting of a long red candle, a small-bodied gap candle, and a strong green candle. It provides stronger structural confirmation than a single-candle hammer.
- Evening Star Pattern: The bearish three-candle equivalent of the morning star, signaling a top reversal after an uptrend.
- Marubozu: A marubozu is a long-bodied candle with no shadows at all, indicating complete dominance by one side throughout the entire session.
Conclusion
The hammer candlestick pattern serves as a clear visual signal of intraday price rejection and shifting market sentiment. When identified at key technical support levels following a downtrend, it offers traders an early signal that buyers are regaining control.
However, long-term technical success relies on patience—always waiting for confirmation, setting strict stop-loss orders below the lower wick, and integrating the pattern into a disciplined, multi-indicator risk management strategy.
- How to Build an Investment Plan That Actually Works for You?
- What Is the MACD Indicator and How to Use It
- What Is a Wedge Pattern in Trading?
- What Is Ichimoku Cloud Strategy? A Complete Trading System
- Mastering Elliott Wave Theory: Rules and Trading Strategies
- News Trading: Strategies, Execution Risks, and Risk Control
- What Is an Iron Condor Options Strategy?
- Backtesting Explained: What It Is and Why It Really Matters
- Grid Trading: Mechanics, Parameters, and Risk Strategies
- What Is Breakout Trading and How Does It Work?
- Mean Reversion: Technical Strategies and Risk Frameworks
- Momentum Trading: Indicators, Strategies, and Risk Control
- Hammer Candlestick: Structure, Meaning, and Strategy
- Doji Candlestick: Types, Signals, and Trading Strategies
- What Is the Sharpe Ratio and How to Calculate It
- What Is VWAP and How Do Traders Use It?
- Trade the Ascending Triangle: A Step-by-Step Practical Guide
- What Is the Stochastic Oscillator and How to Use It
- How to Trade the Descending Triangle Pattern
- High Frequency Trading: Speed, Algorithms, and Market Impact
- What Is Volume Profile and How to Use It in Trading
- What Is a Morning Star Pattern Candlestick?
- Trade with Parabolic SAR: A Practical Analysis Guide
- Evening Star Pattern: Structure, Rules, and Risk Controls
- Kelly Criterion: Formula, Position Sizing, and Risk
- What Is the NYSE Minimum Trading Price? Rules Explained
Disclaimer: The content on this page is intended for educational and informational purposes only. It does not constitute financial, investment, tax, or legal advice, and should not be interpreted as a recommendation to buy, sell, or hold any financial instrument or asset. Trading and investing involve significant risk, including the possible loss of your entire capital. Products such as forex, CFDs, and cryptocurrencies carry additional risks due to leverage, high volatility, and limited regulatory protection in some jurisdictions. Past performance of any financial instrument does not guarantee future results. Any market views, forecasts, or opinions expressed are those of the author at the time of writing and may not reflect current market conditions. Platform features, fees, and regulatory status are subject to change — always verify information directly with the relevant provider or regulator before making any financial decision. BrokerSpecs may receive compensation from third parties featured on this site. Always conduct your own due diligence and consider seeking advice from a licensed financial professional before investing. Portions of this article were prepared with the assistance of AI tools and reviewed by our editorial team before publication.