


Related Tags
Entering a trade right as a trend starts to gain momentum feels like catching a wave at the perfect moment. However, many traders enter too late, buying right when momentum fades or selling just before price action stabilizes. Moving average lag often causes missed entries or late exits.
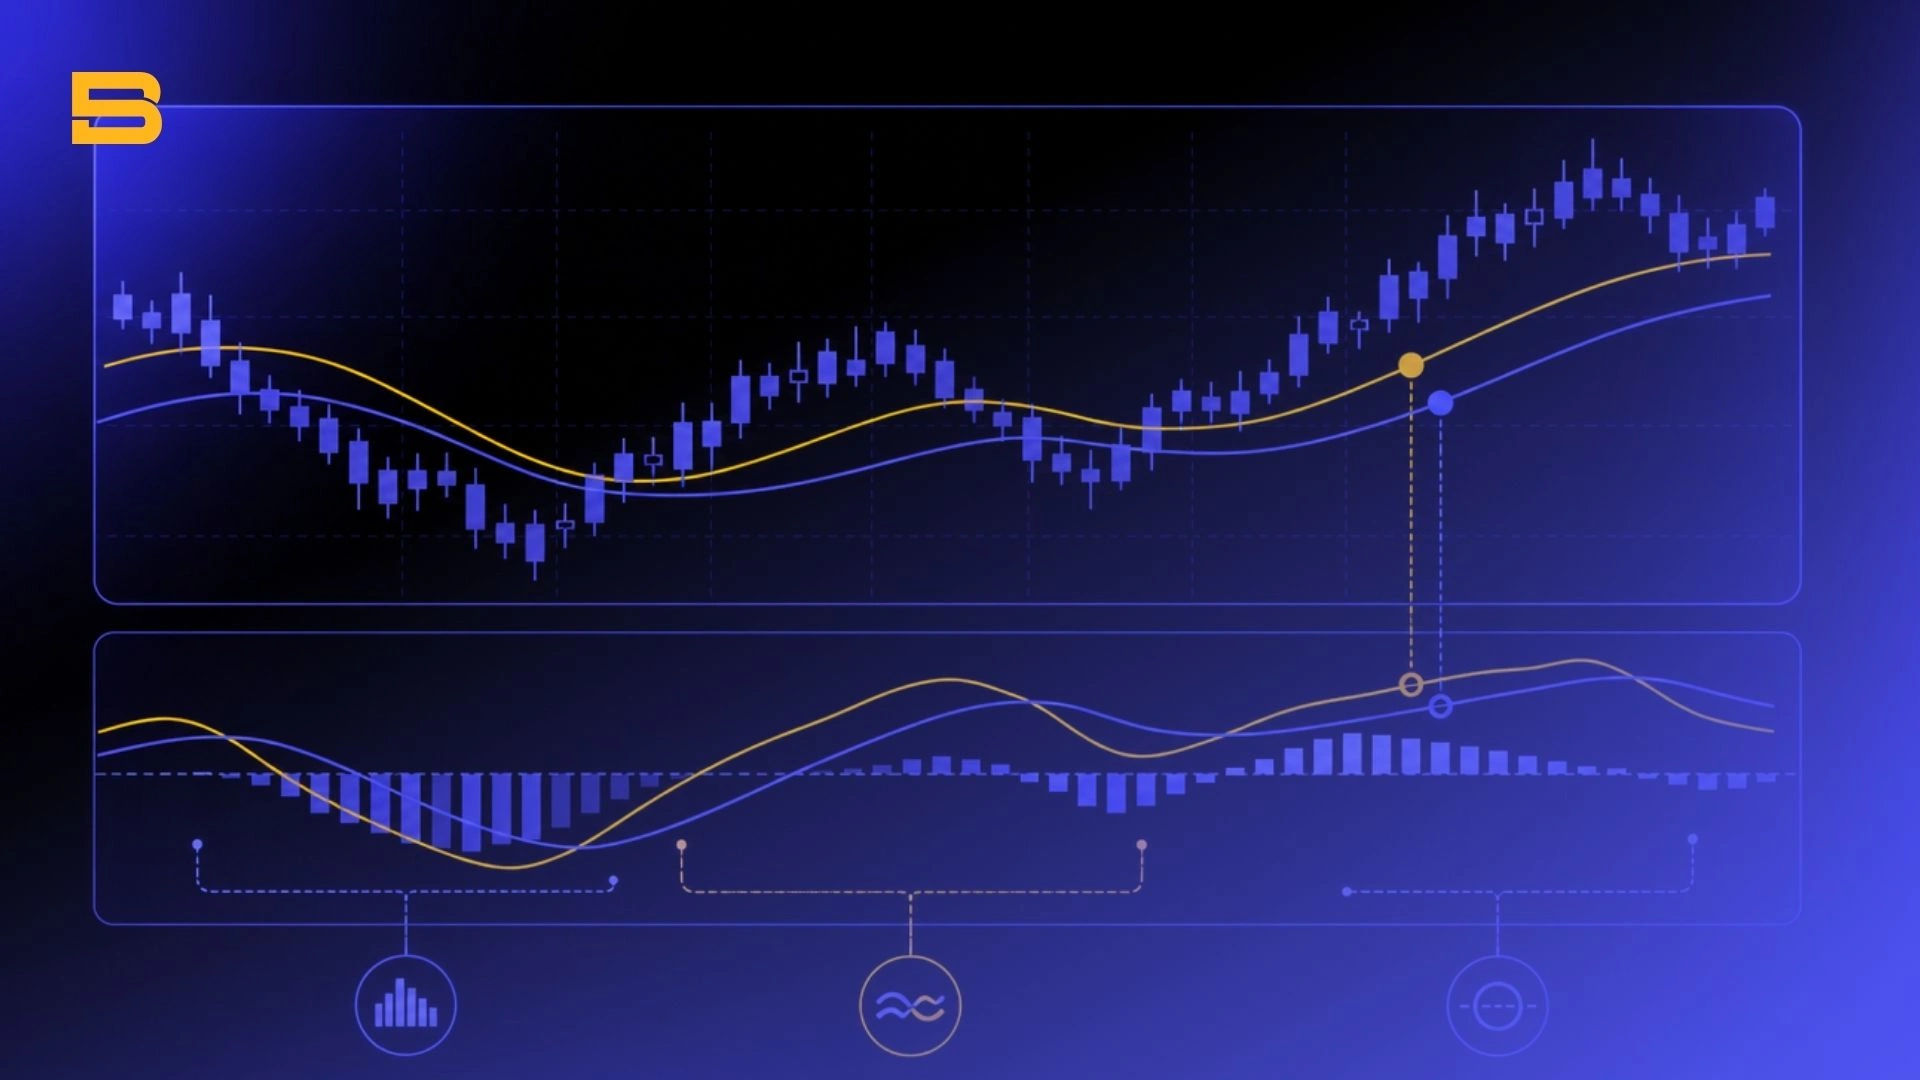
The Moving Average Convergence Divergence (MACD) indicator helps solve this issue by combining trend-following characteristics with momentum analysis. Developed by Gerald Appel in the late 1970s, the MACD indicator tracks the distance between two moving averages to evaluate price strength.
What Is the MACD Indicator?
The Moving Average Convergence Divergence (MACD) indicator is a technical analysis tool used to assess momentum and trend direction and identify potential changes in market direction. Fidelity classifies MACD as a momentum oscillator primarily used to trade trends. It measures the difference between two Exponential Moving Averages (EMAs), typically the 12-period and 26-period EMAs, with a 9-period EMA commonly used as the signal line.
Because it measures moving average interactions, the MACD indicator functions as a momentum oscillator and a trend-following system.
Construction and Calculation Formula
The indicator consists of three key components plotted on a sub-chart below the primary price pane:
- MACD Line: The distance between a short-term fast EMA and a longer-term slow EMA. Standard calculations use the 12-day EMA and 26-day EMA based on closing prices.
- Signal Line: An Exponential Moving Average of the MACD line itself, traditionally set to a 9-period EMA. It acts as a smoothed trigger line for bullish and bearish crossovers.
- MACD Histogram: The visual representation of the difference between the MACD line and the Signal line.
Mathematical foundation:
MACD Line = 12-period EMA - 26-period EMA
Signal Line = 9-period EMA of MACD Line
MACD Histogram = MACD Line - Signal Line
Understanding how these moving averages interact reveals how indicator lag functions. Exponential moving averages prioritize recent price action, yet they remain trailing indicators.
Scenario:
Consider an asset trading at $100 that suddenly surges to $115 over three days. The 12-EMA reacts quickly, rising from $100 to $106. The 26-EMA moves more slowly, shifting from $100 to $102.50. The resulting MACD line expands to +3.50 (106 - 102.50).
Because the 9-period Signal Line lags behind this quick move, the MACD line crosses above it, generating a bullish signal. However, because moving averages rely on past closing prices, the indicator confirms momentum after the initial price jump begins.
How Do You Read the MACD Indicator?
Reading the MACD indicator involves observing how the MACD line, Signal line, and Histogram interact around the central Zero Line baseline.
When the MACD line moves above the Zero Line, the 12-EMA is higher than the 26-EMA, confirming upward price momentum. Conversely, a MACD line below the Zero Line confirms that short-term price momentum is moving downward.
The Role of the Signal Line
The Signal Line smooths out daily price fluctuations to filter noise. Watch for interactions between the fast MACD line and the slower Signal Line.
- Bullish Signal: The MACD line crosses above the Signal Line, suggesting momentum is turning upward. (For more on confirming reversals with price action, see our guide to reading candlestick charts.
- Bearish Signal: The MACD line crosses below the Signal Line, indicating momentum is turning downward.
Understanding the MACD Histogram
The MACD Histogram provides early warnings regarding momentum strength. It measures the exact distance between the MACD line and its Signal Line:
- Expanding Bars: Momentum is accelerating as the two lines diverge.
- Contracting Bars: Momentum is weakening as the MACD line converges back toward the Signal Line.
- Zero Line Cross: The histogram changes color or shifts from positive to negative territory precisely when a crossover occurs.
Standard MACD Settings vs Day Trading Adjustments
The default MACD parameters are (12, 26, 9). While these settings work well for daily charts and swing trading, day traders on lower timeframes (5-minute or 15-minute charts) often modify inputs to reduce lag.
- Standard Settings (12, 26, 9): Best for swing trading and daily trend tracking. Provides reliable signals with balanced noise filtering.
- Faster Day Trading Settings (5, 35, 5): Increases sensitivity to intraday price spikes, providing earlier entries but generating more false signals.
- Conservative Settings (24, 52, 18): Smooths out volatility on lower timeframes, filtering false breakdowns during high-volume sessions.
Trading Strategies Using MACD
Traders incorporate the MACD indicator into structural trading strategies to execute entries and exits.
MACD Crossover Strategy Explained
The crossover strategy relies on interactions between the MACD line and the Signal line.
- Bullish Crossover Entry: Buy when the MACD line crosses above the Signal Line below the Zero Line, signaling a potential low-level reversal.
- Bearish Crossover Entry: Sell or short when the MACD line crosses below the Signal Line above the Zero Line.
Leverage magnifies your returns when you are right, but it accelerates capital destruction just as quickly when the market moves against you. Taking a 30:1 leveraged position on an unconfirmed MACD crossover, for example, can trigger swift stop-outs during choppy market conditions.
In sideways or low-volatility markets, moving averages weave back and forth, generating frequent false crossovers (whipsaws).
Spotting Bullish and Bearish MACD Divergence
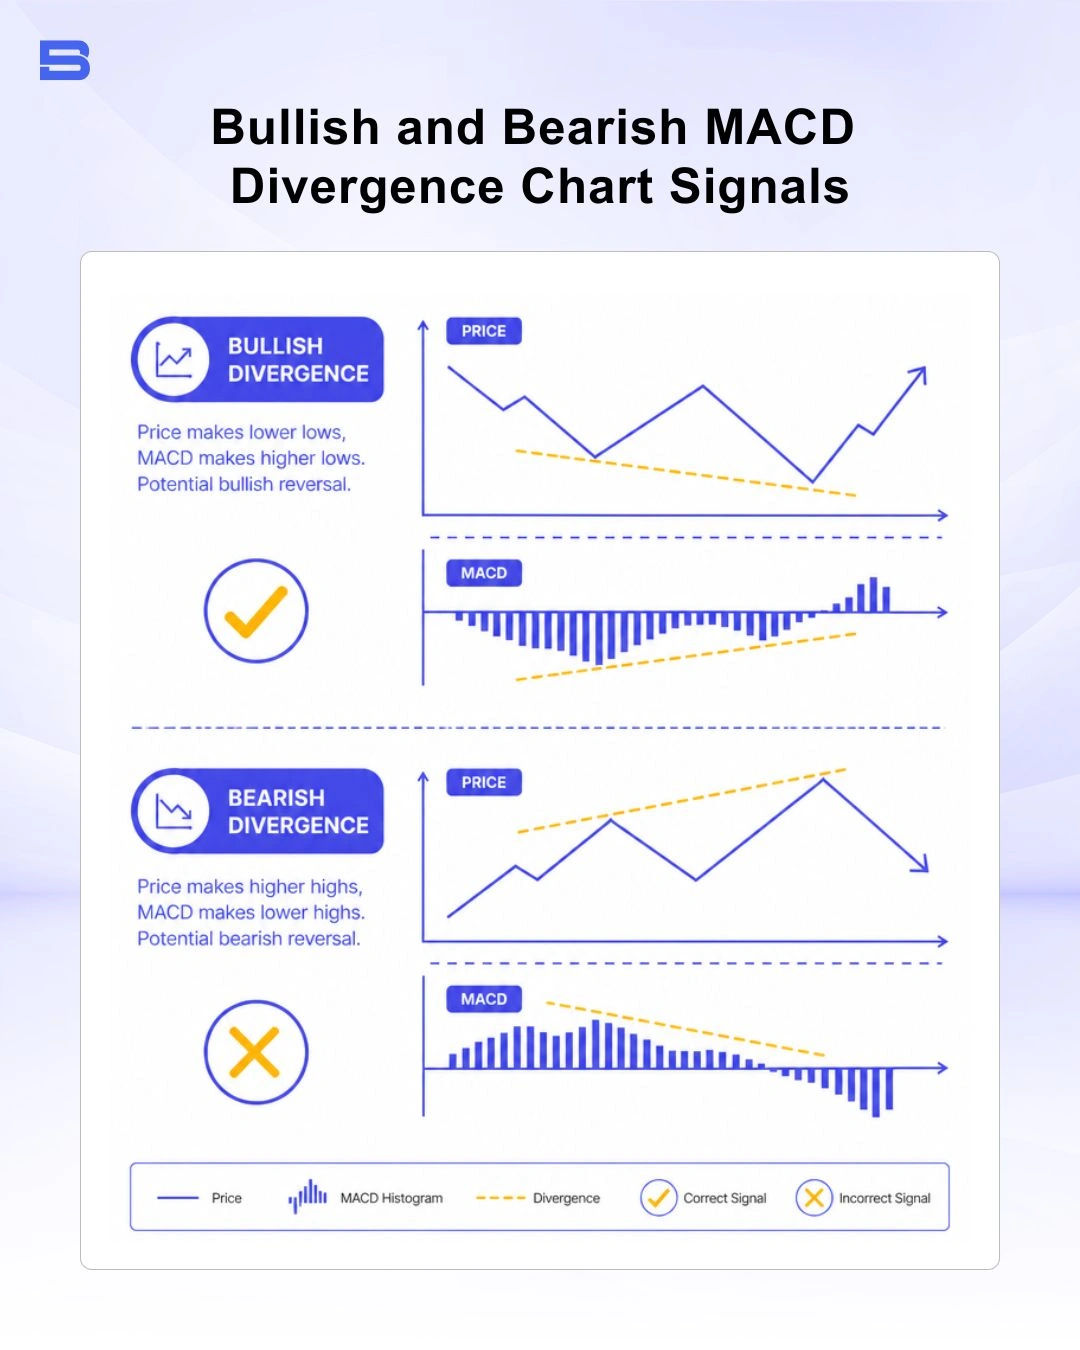
MACD divergence occurs when price movement direction disagrees with indicator movement direction, signaling potential trend exhaustion.
- Bullish Divergence: Price makes lower lows, but the MACD indicator makes higher lows. This suggests selling pressure is waning despite declining prices.
- Bearish Divergence: Price makes higher highs, but the MACD indicator makes lower highs, indicating weakening buying momentum.
MACD vs RSI Indicator: Key Differences
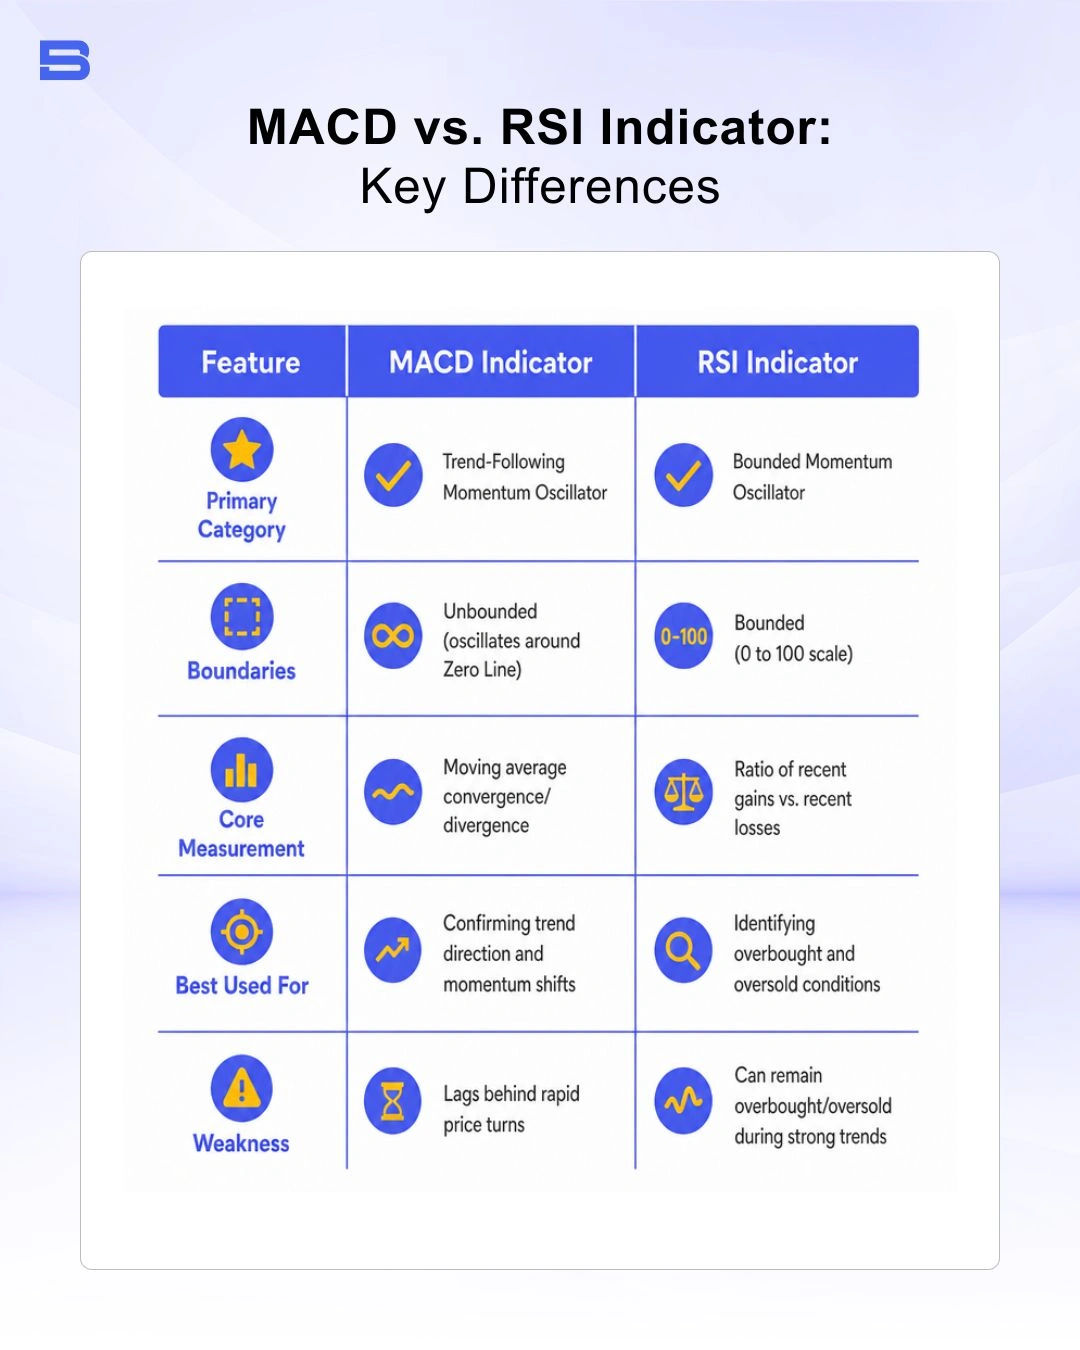
While both serve as technical oscillators, the MACD indicator and the RSI indicator measure market dynamics differently.
The Relative Strength Index (RSI) measures internal strength by comparing recent gains against recent losses on a fixed scale of 0 to 100. It identifies the overbought (>70) and oversold (<30) boundaries.
In contrast, the MACD indicator measures the relationship between two moving averages and operates without fixed upper or lower boundaries.
Combining MACD with Other Best Trading Indicators
Relying on a single indicator increases exposure to false signals. Combining the MACD with complementary tools builds a robust trading framework.
Combining MACD with Bollinger Bands and RSI
Pairing the MACD with Bollinger Bands and RSI provides a complete multi-indicator confirmation strategy:
- Volatility Filter: Wait for price to touch or breach the lower Bollinger Bands boundary.
- Momentum Filter: Check if RSI confirms an oversold reading (below 30).
- Trigger Signal: Enter the trade only when the MACD line completes a bullish crossover above the Signal Line.
Integrating Fibonacci Retracement Levels
Traders frequently use Fibonacci retracement levels alongside MACD crossover signals:
- Identify a pullback during an established uptrend.
- Wait for price action to test key support near the 38.2% or 61.8% Fibonacci retracement level.
- Execute an entry when a bullish MACD crossover occurs at that key support zone, improving trade probability.
For a broader look at technical tools, explore our comprehensive guide on the best trading indicators.
Conclusion
The MACD indicator is a useful technical analysis tool for assessing trend direction and momentum. By comparing two exponential moving averages, MACD can help traders identify bullish or bearish crossovers, zero-line movements, and potential momentum shifts. Fidelity notes that MACD is primarily used to trade trends and can be particularly useful in trending markets.
However, MACD should not be treated as a standalone buy or sell signal. Crossovers can produce whipsaws during sideways markets, while divergences may provide additional confirmation when combined with price action and other technical indicators.
For beginners, the standard 12, 26, 9 settings provide a practical starting point. Traders can adjust the parameters according to their timeframe and strategy, but should test any alternative settings before applying them to live trades. Ultimately, combining MACD with sound risk management and confirmation from other market signals can help traders make more informed decisions.
- How to Build an Investment Plan That Actually Works for You?
- What Is the MACD Indicator and How to Use It
- What Is a Wedge Pattern in Trading?
- What Is Ichimoku Cloud Strategy? A Complete Trading System
- Mastering Elliott Wave Theory: Rules and Trading Strategies
- News Trading: Strategies, Execution Risks, and Risk Control
- What Is an Iron Condor Options Strategy?
- Backtesting Explained: What It Is and Why It Really Matters
- Grid Trading: Mechanics, Parameters, and Risk Strategies
- What Is Breakout Trading and How Does It Work?
- Mean Reversion: Technical Strategies and Risk Frameworks
- Momentum Trading: Indicators, Strategies, and Risk Control
- Hammer Candlestick: Structure, Meaning, and Strategy
- Doji Candlestick: Types, Signals, and Trading Strategies
- What Is the Sharpe Ratio and How to Calculate It
- What Is VWAP and How Do Traders Use It?
- Trade the Ascending Triangle: A Step-by-Step Practical Guide
- What Is the Stochastic Oscillator and How to Use It
- How to Trade the Descending Triangle Pattern
- High Frequency Trading: Speed, Algorithms, and Market Impact
- What Is Volume Profile and How to Use It in Trading
- What Is a Morning Star Pattern Candlestick?
- Trade with Parabolic SAR: A Practical Analysis Guide
- Evening Star Pattern: Structure, Rules, and Risk Controls
- Kelly Criterion: Formula, Position Sizing, and Risk
- What Is the NYSE Minimum Trading Price? Rules Explained
Disclaimer: The content on this page is intended for educational and informational purposes only. It does not constitute financial, investment, tax, or legal advice, and should not be interpreted as a recommendation to buy, sell, or hold any financial instrument or asset. Trading and investing involve significant risk, including the possible loss of your entire capital. Products such as forex, CFDs, and cryptocurrencies carry additional risks due to leverage, high volatility, and limited regulatory protection in some jurisdictions. Past performance of any financial instrument does not guarantee future results. Any market views, forecasts, or opinions expressed are those of the author at the time of writing and may not reflect current market conditions. Platform features, fees, and regulatory status are subject to change — always verify information directly with the relevant provider or regulator before making any financial decision. BrokerSpecs may receive compensation from third parties featured on this site. Always conduct your own due diligence and consider seeking advice from a licensed financial professional before investing. Portions of this article were prepared with the assistance of AI tools and reviewed by our editorial team before publication.