


Related Tags
You are looking at a market moving sideways, bouncing repeatedly within an established range, and wondering how to capture gains from this constant noise without staring at the screen all day. Standard directional strategies often fail in non-trending markets, leaving capital idle or triggering premature stop-outs.
Grid trading solves this by automating buys and sells at fixed intervals, systematically capturing incremental gains from price fluctuations without needing to forecast market direction.
What Is Grid Trading and How Does It Work?
Grid trading is a quantitative strategy that places buy and sell orders at regular price intervals above and below a baseline price.
This creates a ladder-like structure of limit orders across a chart—hence the term "grid." As price fluctuates through these levels, the system automatically fills orders, accumulating inventory when prices drop and liquidating that inventory at predetermined higher levels.
For instance, consider Euro and US Dollar (EUR/USD) trading at a baseline price of 1.0800. You configure a grid with a 10-pip spacing step and two levels above and below the baseline:
- Place Limit Buy orders at 1.0790 and 1.0780.
- Place Limit Sell orders at 1.0810 and 1.0820.
If EUR/USD drops to 1.0790, your first buy order fills. If price then rebounds to 1.0800, the system automatically executes a paired sell order, locking in a 10-pip profit before setting a new limit order. This continuous turnover converts minor price noise into structured cash flow.
To execute this effectively, you must understand what trading is and how trading works across different market structures.
Automated Grid Bots vs. Manual Order Grids
While you can manually place limit ladders on your platform, managing dozens of active orders becomes overwhelming during volatile market moves. Automated grid trading bots connect via broker APIs to monitor order execution 24/7.
These bots handle complex order cancellations and replacements instantly, ensuring precise grid maintenance without human latency or emotion. Regulatory guidance from global authorities like the International Organization of Securities Commissions (IOSCO) emphasizes that automated execution tools must include internal controls to prevent runaway orders during extreme illiquidity.
The Core Mechanics: Mean Reversion in Action
This strategy relies heavily on the concept of mean reversion—the market tendency for asset prices to oscillate back toward a long-term average over time. Instead of betting on a sustained breakout, grid systems capitalize on sideways movement within an established range.
When an asset is consolidating, every dip represents a temporary mispricing to buy, and every rally represents an opportunity to take profits. The system does not attempt to predict macro trends; it profits from market micro-structure movements within fixed boundaries. Understanding what mean reversion in trading is helps you recognize why this systematic approach works best when price action lacks strong directional momentum.
Understanding broader market sentiment is equally critical; check what market sentiment is and how it affects trading to gauge overall trader psychology.
Ranging vs. Trending Markets
Market regime determines the success of a grid strategy:
- Ranging Markets (Consolidation): High order turnover leads to optimal performance. The price moves back and forth across grid levels, filling buy and sell orders repeatedly.
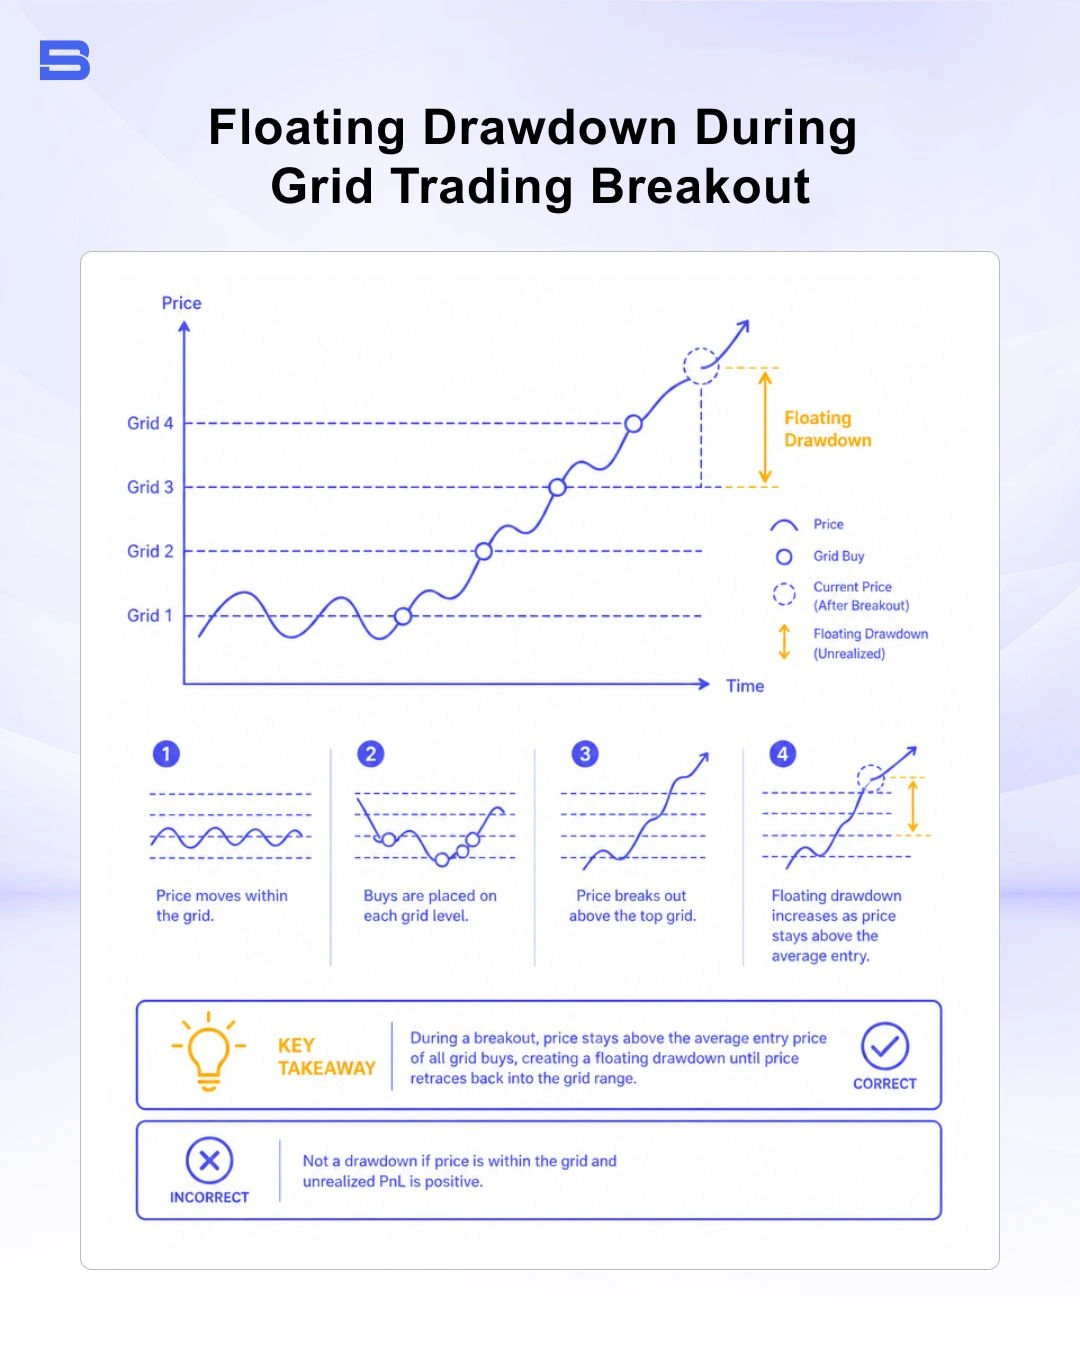
- Trending Markets (Breakout): Linear directional trends exhaust grid capital rapidly. In a strong uptrend, you sell out of your asset too early and miss broader gains; in a strong downtrend, you continuously buy a falling asset, accumulating significant floating drawdown.
Key Parameters to Configure Your Grid
Configuring this strategy setup requires defining parameters based on technical analysis rather than arbitrary numbers. Identifying key levels of what is support and resistance in trading helps establish structural boundaries for the grid.
Traders often use technical tools like a moving average to determine the grid's median baseline price.
Setting parameters involves defining four core metrics:
- Upper Boundary: The top price level where the grid stops placing buy/sell orders.
- Lower Boundary: The bottom price level where all buying stops to preserve capital.
- Grid Count (Density): The total number of order levels within the boundaries.
- Order Sizing: The capital allocated per grid rung.
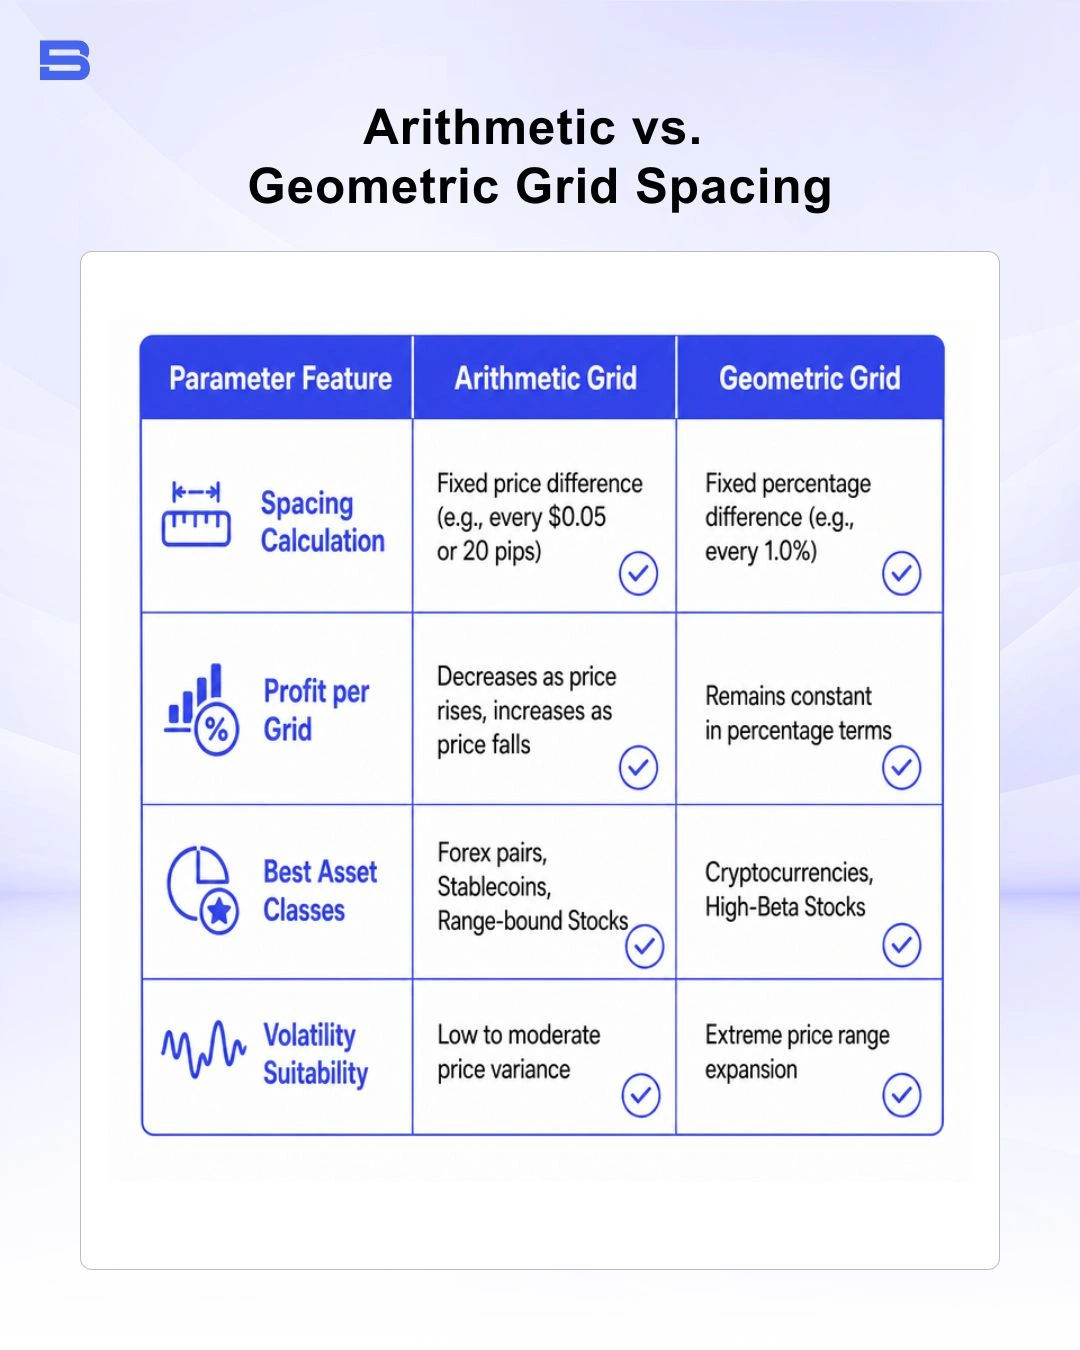
Arithmetic vs. Geometric Grid Calculations
Choosing between arithmetic and geometric grids depends on the asset class and price volatility:
Spot Grid vs. Futures Grid Trading
- Spot Grid Trading: Involves unleveraged asset purchases. If price drops, you hold the underlying physical asset or currency without liquidation risk, though capital remains tied up in depreciating inventory.
- Futures Grid Trading: Uses leveraged derivative contracts to open both long and short grids. While leverage increases capital efficiency, it introduces liquidation risk if price breaches the stop-loss boundaries.
Core Risks and Failure Modes of Grid Trading
The main structural flaw of grid trading is its vulnerability to sustained one-way trends. Because buy orders trigger sequentially during a price drop, a severe market crash leaves you holding a large, unhedged position against a plunging asset.
Floating loss during an uninterrupted trend grows exponentially rather than linearly. The mathematical formula for cumulative floating loss across n filled rungs with fixed spacing s and position size v is expressed as:
Floating Loss = v × s × [n(n − 1) / 2]
If price fills 10 consecutive buy rungs (n = 10) spaced 10 pips apart (s = 10) with 1 lot per level (v = 1), the cumulative unrealized loss isn't simply 10 pips—it expands across all accumulated rungs to 450 pips of total drawdown.
To mitigate these systemic risks, risk frameworks outlined by bodies like the Financial Conduct Authority (FCA) highlight the necessity of implementing automated stop-losses and clear leverage caps. Understanding volatility in trading enables traders to adjust grid density dynamically ahead of major economic announcements.
The Downside of Strong Trends: The One-Way Market Trap
When an asset breaks down below your lower grid boundary, the bot stops executing buys, leaving you holding a fully allocated position at a heavy unrealized loss. If you do not set an absolute hard stop-loss outside the grid boundary, a market breakdown can trigger margin calls or liquidate your entire trading account.
Grid Trading vs. Martingale Strategy
Traders often confuse grid systems with Martingale setups, but their capital allocation models differ fundamentally:
- Grid Trading: Uses fixed position sizing across pre-calculated price levels. Capital allocation per rung remains constant, leading to linear exposure growth.
- Martingale Strategy: Doubles position size after every loss (1x, 2x, 4x, 8x) to recover previous losses on a single price reversal.
While this strategy risks extended drawdown during strong trends, Martingale strategies exponentially increase position sizes during market drops, making account wipeout far more likely during prolonged down moves. For a complete analysis of double-up systems, review what the martingale strategy in trading is.
Comparing Grid Trading to Position Trading and Other Styles
Grid trading fits into a distinct category compared to traditional execution methods:
- Position Trading: A macro-driven approach where positions are held for months or years to capture large trends. Learn how long-term macro strategies operate in position trading.
- Day Trading: Focuses on short-term intraday momentum and requires constant chart monitoring. See day trading for operational details.
- Swing Trading: Targets multi-day price swings based on technical setups. Check swing trading to compare discretionary swing mechanics against automated grid ladders.
Is Grid Trading Profitable in Modern Volatile Markets?
Grid trading can generate reliable returns in range-bound, sideways markets, but real-world profitability depends heavily on transaction costs.
Because grid strategies execute numerous small trades to capture minor price moves, exchange fees and broker spreads can eat into profit margins. High maker/taker fees (the charges exchanges apply for adding vs. removing liquidity) or wide bid-ask spreads can render a tight grid unprofitable over time. Successful traders backtest their parameters against historic spread data and use automated platforms to keep execution costs low.
For alternative automated strategies, consider exploring copy trading and how it works.
- How to Build an Investment Plan That Actually Works for You?
- What Is the MACD Indicator and How to Use It
- What Is a Wedge Pattern in Trading?
- What Is Ichimoku Cloud Strategy? A Complete Trading System
- Mastering Elliott Wave Theory: Rules and Trading Strategies
- News Trading: Strategies, Execution Risks, and Risk Control
- What Is an Iron Condor Options Strategy?
- Backtesting Explained: What It Is and Why It Really Matters
- Grid Trading: Mechanics, Parameters, and Risk Strategies
- What Is Breakout Trading and How Does It Work?
- Mean Reversion: Technical Strategies and Risk Frameworks
- Momentum Trading: Indicators, Strategies, and Risk Control
- Hammer Candlestick: Structure, Meaning, and Strategy
- Doji Candlestick: Types, Signals, and Trading Strategies
- What Is the Sharpe Ratio and How to Calculate It
- What Is VWAP and How Do Traders Use It?
- Trade the Ascending Triangle: A Step-by-Step Practical Guide
- What Is the Stochastic Oscillator and How to Use It
- How to Trade the Descending Triangle Pattern
- High Frequency Trading: Speed, Algorithms, and Market Impact
- What Is Volume Profile and How to Use It in Trading
- What Is a Morning Star Pattern Candlestick?
- Trade with Parabolic SAR: A Practical Analysis Guide
- Evening Star Pattern: Structure, Rules, and Risk Controls
- Kelly Criterion: Formula, Position Sizing, and Risk
- What Is the NYSE Minimum Trading Price? Rules Explained
Disclaimer: The content on this page is intended for educational and informational purposes only. It does not constitute financial, investment, tax, or legal advice, and should not be interpreted as a recommendation to buy, sell, or hold any financial instrument or asset. Trading and investing involve significant risk, including the possible loss of your entire capital. Products such as forex, CFDs, and cryptocurrencies carry additional risks due to leverage, high volatility, and limited regulatory protection in some jurisdictions. Past performance of any financial instrument does not guarantee future results. Any market views, forecasts, or opinions expressed are those of the author at the time of writing and may not reflect current market conditions. Platform features, fees, and regulatory status are subject to change — always verify information directly with the relevant provider or regulator before making any financial decision. BrokerSpecs may receive compensation from third parties featured on this site. Always conduct your own due diligence and consider seeking advice from a licensed financial professional before investing. Portions of this article were prepared with the assistance of AI tools and reviewed by our editorial team before publication.