


Related Tags
Entering a market trend right as it reaches exhaustion is one of the most frustrating experiences in technical analysis. You watch a breakout occur, wait for your standard moving average to confirm the directional shift, and finally execute an entry—only to buy the exact top before price reverses.
Traditional moving averages are plagued by an inherent dilemma: increasing the period eliminates market noise but introduces severe lag, while shortening the period reduces lag at the expense of overwhelming false signals.
In 2005, Australian analyst Alan Hull developed the Hull Moving Average (HMA) specifically to solve this trade-off. By combining weighted moving averages across fractional timeframes, the HMA dramatically reduces directional lag while preserving a remarkably smooth, responsive curve.
Understanding HMA Mechanics and Lag Reduction
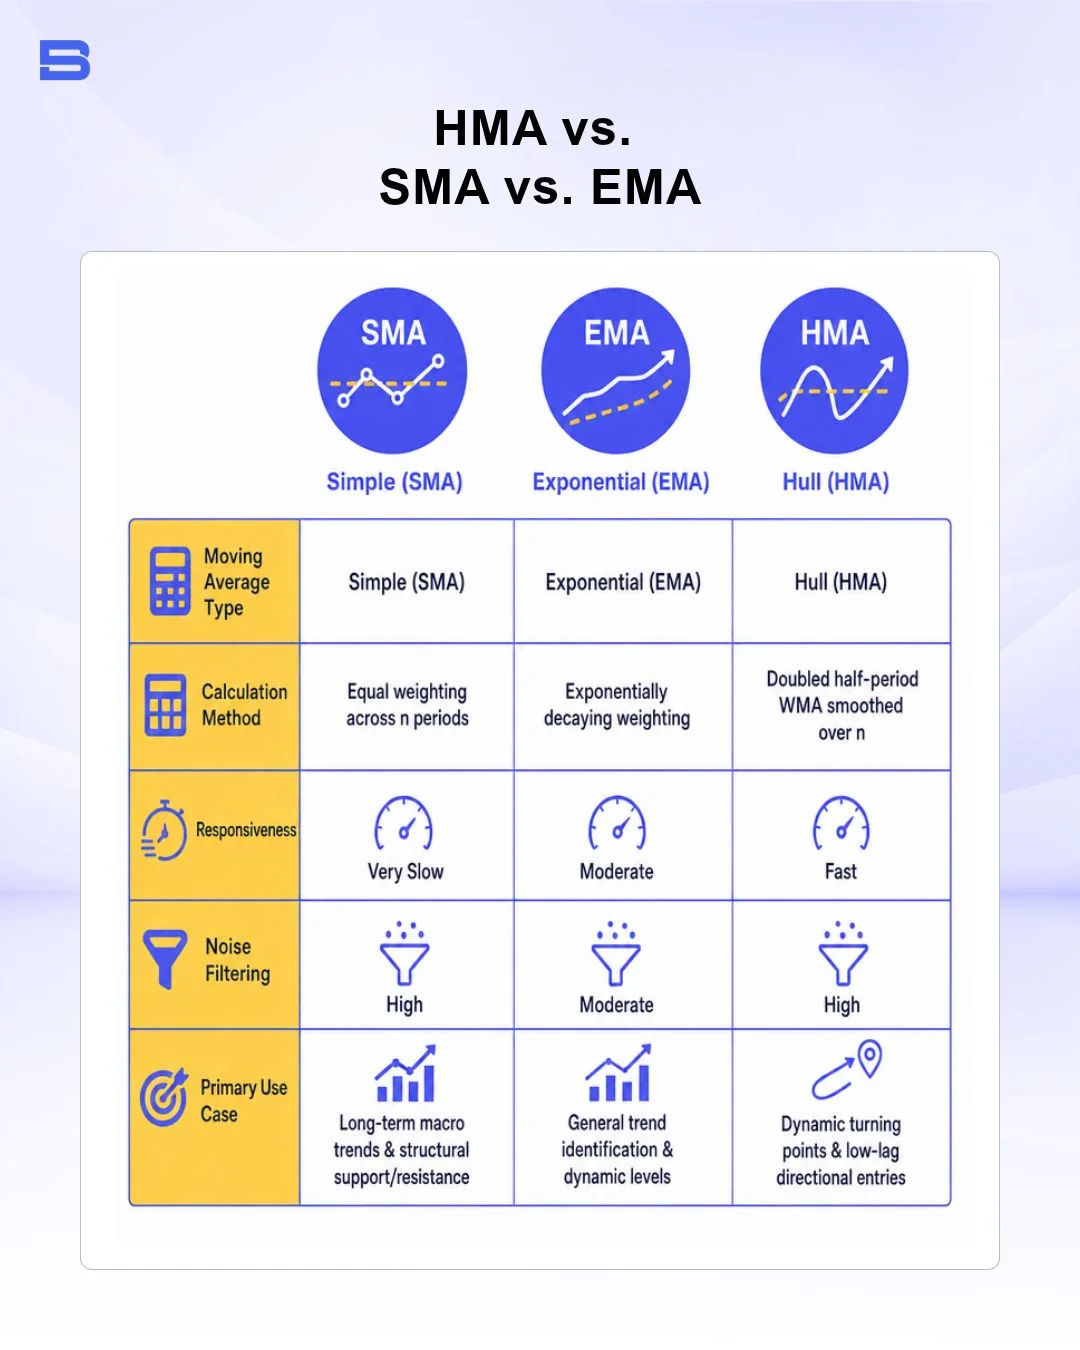
To appreciate how the Hull Moving Average operates, you must first understand why traditional indicators struggle during volatile market conditions. A simple moving average assigns equal weight to every data point in its lookback period, making it slow to react to aggressive price reversals. An exponential moving average improves responsiveness by placing greater emphasis on recent prices, yet it remains vulnerable to noise and whipsawing in ranging markets.
The HMA achieves lag reduction through a clever mathematical approach: calculating the weighted moving average (WMA) over a shortened timeframe, scaling that value, and applying a secondary smoothing pass over the square root of the base period.
- WMA_half = WMA(Price, n/2) × 2
- WMA_full = WMA(Price, n)
- Raw_HMA = WMA_half − WMA_full
- HMA = WMA(Raw_HMA, √n)
By multiplying the shorter WMA by two and subtracting the full-period WMA, the calculation pushes the average closer to current market action. The final square-root WMA pass smooths out residual volatility without introducing significant delayed response times.
However, extreme responsiveness comes with trade-offs. In sideways or low-volatility consolidation zones, the HMA's sensitivity can generate rapid directional flips. Traders who blindly follow its slope in non-trending environments risk overtrading and accumulating friction costs from false crossovers.
How the HMA Is Calculated
Calculating the HMA involves three distinct mathematical steps. While modern trading platforms execute these calculations instantly, walking through the logic manually clarifies how the indicator dampens noise without falling behind price action.
- Calculate the Half-Period WMA (WMA_half): Compute a Weighted Moving Average of price over n /2 periods and multiply the resulting value by 2.
- Calculate the Full-Period WMA (WMA_full): Compute a standard Weighted Moving Average of price over the full n periods and subtract it from the value calculated in Step 1. This produces an over-responsive, unsmoothed series (Raw_HMA).
- Apply the Final Smoothing Pass: Calculate a Weighted Moving Average of the Raw_HMA series over an integer period equal to √n.
Numerical Example (n = 16)
Consider a standard 16-period Hull Moving Average set on a daily chart.
- Step 1: Calculate the WMA for 8 periods (16 / 2 = 8). Multiply this result by 2.
- Step 2: Calculate the WMA for 16 periods (16). Subtract the 16-period WMA from the doubled 8-period WMA.
- Step 3: Take the square root of the original lookback period (√16 = 4). Calculate a 4-period WMA of the resulting series from Step 2.
The final output is a 16-period HMA that tracks price movements far more closely than a standard 16-period SMA, while eliminating the jagged edge typical of short-lookback indicators. Quantitative traders often backtest these parameters using methodologies aligned with standards established by the CFA Institute to verify statistical edge before deployment.
HMA vs SMA vs EMA: Technical Comparison
Choosing the appropriate moving average depends entirely on whether your trading strategy prioritizes structural stability, baseline trends, or rapid entry timing.
When analyzing intraday momentum, pairing the HMA with institutional baseline anchors like VWAP (Volume-Weighted Average Price) allows traders to filter overall trend direction while using the HMA slope to refine localized entries.
Practical Trading Strategies Using the Hull Moving Average
Integrating the HMA into an actionable execution plan requires clear rules for identification, confirmation, and risk control. Here are two established methods for how to use Hull Moving Average setups effectively.
Strategy 1: HMA Slope and Color Turning Points
Many chart mapping tools color-code the HMA line based on its current mathematical slope (e.g., green when sloping upward, red when sloping downward).
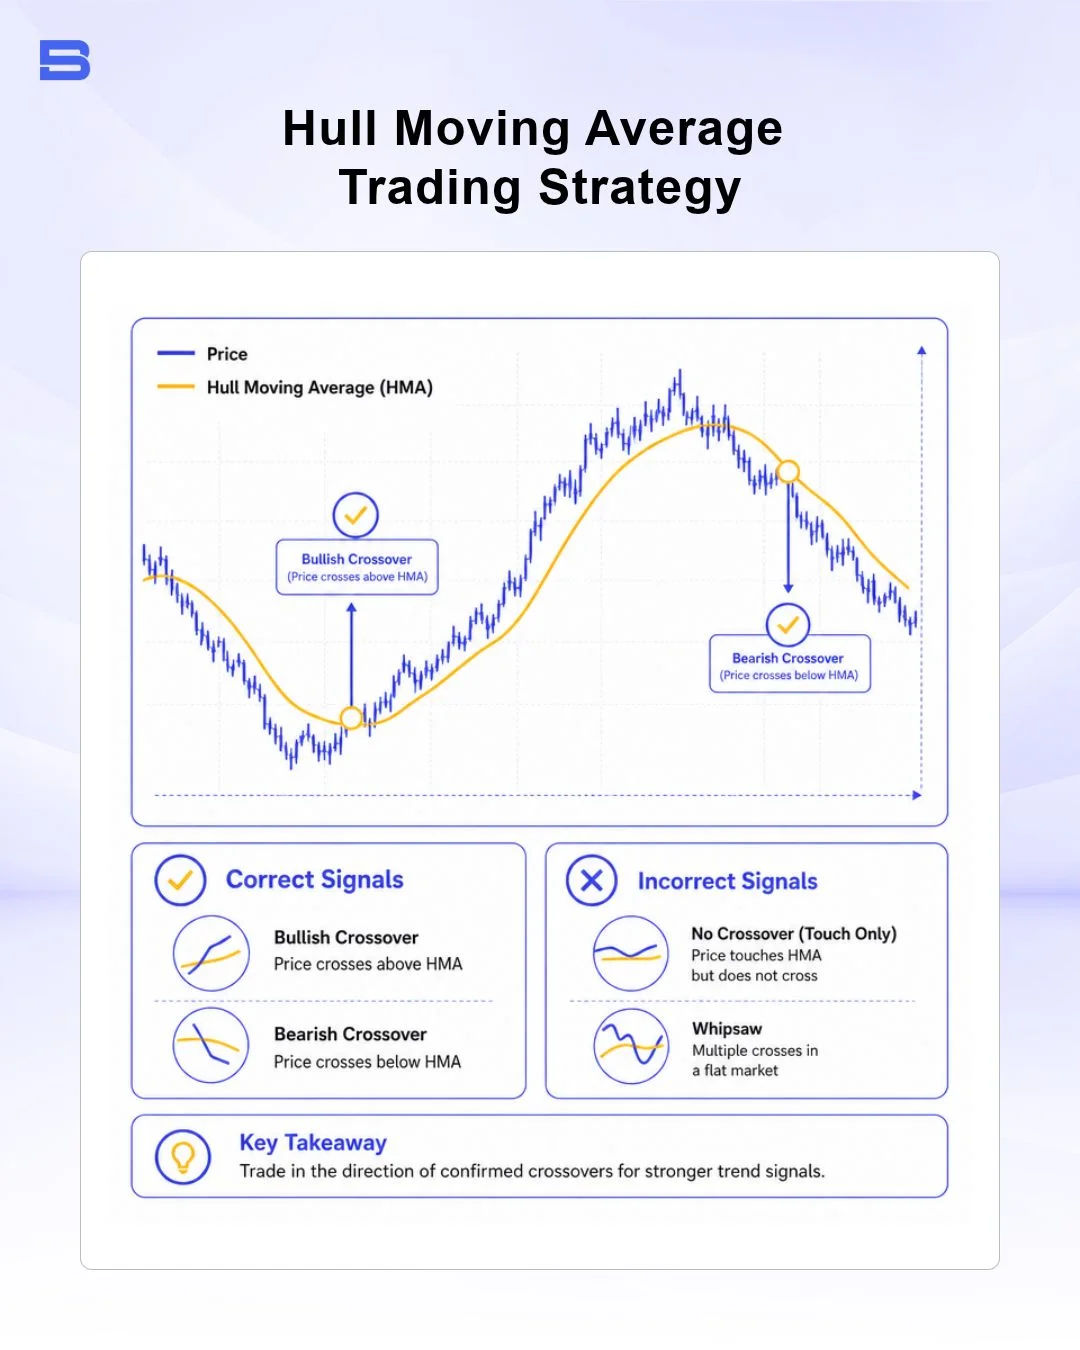
- Entry: Open a long position when the HMA slope changes from negative to positive (turning green) while price closes above the curve. Open a short position when the slope shifts from positive to negative (turning red) with a price close below the curve.
- Confirmation: Enhance entry accuracy by checking price structure on a Heikin-Ashi chart or verifying against key intraday levels generated by pivot points trading.
Strategy 2: Dual HMA Trend Crossover
To reduce false signals in chopping conditions, combine two HMA lines with differing lookback inputs:
- Fast HMA: 9-period setting (high-speed directional trigger)
- Slow HMA: 24-period setting (baseline trend context)
A long setup triggers when the 9-period HMA crosses above the 24-period HMA while both curves slope upward. Conversely, a short setup triggers when the 9-period HMA crosses below the 24-period HMA in a downward trajectory.
Selecting the Optimal HMA Period Settings
- Day Trading & Scalping (1-min to 15-min charts): A period setting of 9 or 14 provides rapid sensitivity to momentum shifts during major liquidity sessions.
- Swing Trading (4-hour to Daily charts): A period setting of 20 or 50 provides a balanced view of medium-term trends while avoiding premature exits during minor pullbacks.
Market Risks, Pitfalls, and Whipsaw Management
Despite its speed advantages, relying exclusively on the HMA introduces distinct technical risks. Because the HMA formula aggressively weights recent market action, it can produce "curve fitting" behavior during tight consolidation phases.
When prices trade sideways within a narrow range, the Hull Moving Average slope will alternate rapidly, triggering consecutive false reversal signals (whipsaws).
Risk Mitigation Guidelines
To manage execution risk when trading with lag-reduced indicators:
- Avoid Ranging Markets: Do not execute standalone HMA crossover trades when key volatility indicators such as the ADX (Average Directional Index) or Bollinger Band width signal flat, range-bound market conditions.
- Use Structural Stop-Losses: Always place stop-loss orders beyond recent structural swing highs or lows rather than relying solely on an opposing HMA color change to exit.
- Manage Position Sizing: High-frequency directional indicators require conservative leverage. Regulators such as the Securities Commission Malaysia (SC) frequently highlight that excessive leverage combined with systematic execution in volatile conditions remains a primary driver of retail account drawdowns.
Summary
The Hull Moving Average stands out as a powerful technical tool designed specifically to eliminate lag without sacrificing curve smoothness.
By understanding its mathematical construction and acknowledging its limits during range-bound consolidation, intermediate traders can incorporate the HMA alongside structural support, volume profiles, and strict risk parameters to enhance market timing.
- How to Build an Investment Plan That Actually Works for You?
- What Is the MACD Indicator and How to Use It
- What Is a Wedge Pattern in Trading?
- What Is Ichimoku Cloud Strategy? A Complete Trading System
- Mastering Elliott Wave Theory: Rules and Trading Strategies
- News Trading: Strategies, Execution Risks, and Risk Control
- What Is an Iron Condor Options Strategy?
- Backtesting Explained: What It Is and Why It Really Matters
- Grid Trading: Mechanics, Parameters, and Risk Strategies
- What Is Breakout Trading and How Does It Work?
- Mean Reversion: Technical Strategies and Risk Frameworks
- Momentum Trading: Indicators, Strategies, and Risk Control
- Hammer Candlestick: Structure, Meaning, and Strategy
- Doji Candlestick: Types, Signals, and Trading Strategies
- What Is the Sharpe Ratio and How to Calculate It
- What Is VWAP and How Do Traders Use It?
- Trade the Ascending Triangle: A Step-by-Step Practical Guide
- What Is the Stochastic Oscillator and How to Use It
- How to Trade the Descending Triangle Pattern
- High Frequency Trading: Speed, Algorithms, and Market Impact
- What Is Volume Profile and How to Use It in Trading
- What Is a Morning Star Pattern Candlestick?
- Trade with Parabolic SAR: A Practical Analysis Guide
- Evening Star Pattern: Structure, Rules, and Risk Controls
- Kelly Criterion: Formula, Position Sizing, and Risk
- What Is the NYSE Minimum Trading Price? Rules Explained
Disclaimer: The content on this page is intended for educational and informational purposes only. It does not constitute financial, investment, tax, or legal advice, and should not be interpreted as a recommendation to buy, sell, or hold any financial instrument or asset. Trading and investing involve significant risk, including the possible loss of your entire capital. Products such as forex, CFDs, and cryptocurrencies carry additional risks due to leverage, high volatility, and limited regulatory protection in some jurisdictions. Past performance of any financial instrument does not guarantee future results. Any market views, forecasts, or opinions expressed are those of the author at the time of writing and may not reflect current market conditions. Platform features, fees, and regulatory status are subject to change — always verify information directly with the relevant provider or regulator before making any financial decision. BrokerSpecs may receive compensation from third parties featured on this site. Always conduct your own due diligence and consider seeking advice from a licensed financial professional before investing. Portions of this article were prepared with the assistance of AI tools and reviewed by our editorial team before publication.