



Related Tags
You sit before multiple screens, watching three separate oscillating indicators give conflicting signals while a lagging moving average struggles to reflect sudden price expansion. In fast-moving financial markets, indicator clutter frequently creates analysis paralysis and leads to late, emotionally driven entries.
Mastering a structured trading system is an essential step when developing a comprehensive investment plan that protects your capital. The Ichimoku Cloud strategy resolves this visual chaos by uniting past momentum, current price action, and future support boundaries into a single equilibrium framework.
The Five Anatomy Lines: Tenkan-sen and Kijun-sen Explained
An Ichimoku Cloud strategy is a comprehensive Japanese technical analysis system that identifies trend direction, momentum, and dynamic support levels using five midpoint equilibrium calculations. Developed in the late 1930s by journalist Goichi Hosoda under the name Ichimoku Kinko Hyo, it translates literally to "one-look equilibrium chart."
Equilibrium Calculations vs. Standard Moving Averages
Most conventional technical indicators rely on simple or exponential moving averages that smooth closing prices over a set lookback period. Ichimoku takes a fundamentally different mathematical approach by plotting the midpoint between the highest high and lowest low. This midpoint measures the true 50% price equilibrium where buyers and sellers found balance over that window.
The Tenkan-sen (Conversion Line) measures short-term momentum using the midpoint of the 9-period high and low. Running alongside it, the Kijun-sen (Base Line) calculates the midpoint of the 26-period high and low, serving as a reliable benchmark for medium-term trend stability.
When market prices deviate excessively from the Kijun-sen, they frequently snap back toward it, creating dynamic retracement zones similar to Fibonacci retracement levels. Many technical analysts study midpoint-based indicators like Ichimoku to help separate sustained price moves from brief momentum surges, although results vary by market and timeframe.
Senkou Span Projections and Chikou Span Offset
The remaining components establish spatial perspective by shifting data forward and backward along your chart's horizontal time axis. Senkou Span A averages the Tenkan-sen and Kijun-sen, projecting that value 26 periods into the future. Senkou Span B calculates the midpoint of the highest high and lowest low over the past 52 periods, likewise projected 26 periods ahead.
The shaded space bounded between Senkou Span A and Senkou Span B forms the Kumo, or Cloud. When Senkou Span A rises above Senkou Span B, the cloud is generally colored green to denote bullish sentiment. Conversely, when Span B exceeds Span A, the cloud turns red, signaling prevailing bearish pressure.
Meanwhile, the Chikou Span (Lagging Span) plots the current candle's closing price shifted 26 periods back into historical price action. By comparing current price against historical market memory, the Chikou Span provides a mechanical filter against false breakouts.
How the Cloud Projects Dynamic Support and Resistance
Conventional technical analysis relies on static horizontal support and resistance lines drawn across historical swing points. In contrast, the Kumo establishes dynamic support and resistance zones that expand and contract as market volatility fluctuates.
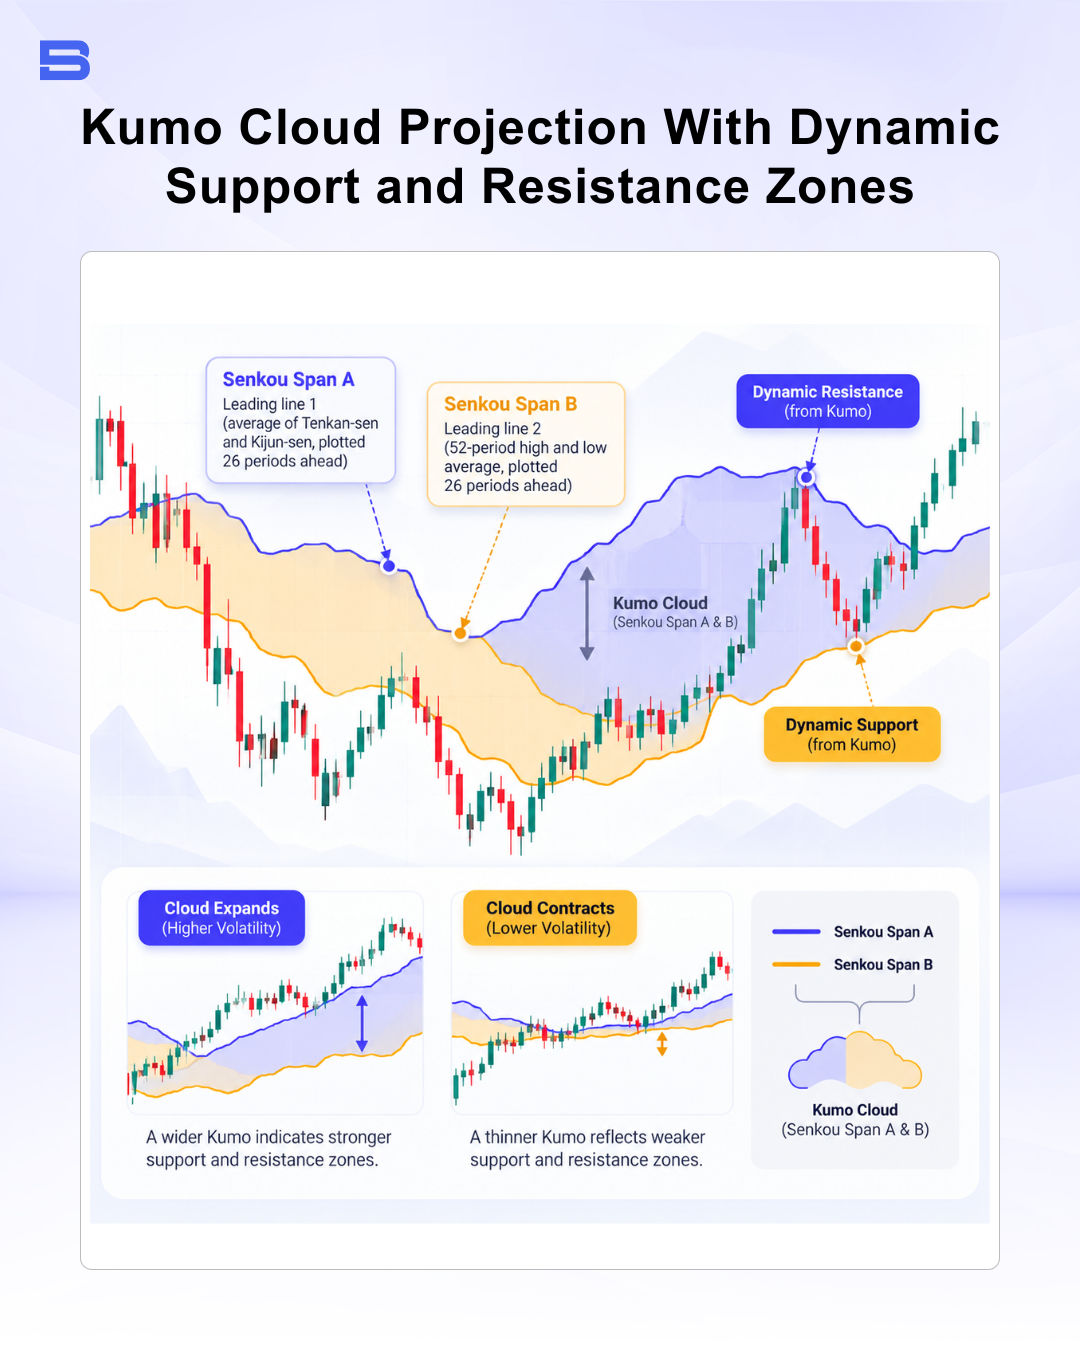
A thick cloud indicates substantial price discovery and volatility over the past 52 periods, creating a formidable barrier against counter-trend pullbacks. Conversely, a thin cloud signals fragile market liquidity, warning you that price can easily slice through the boundary on minor trading volume. Trend traders frequently pair these structural zones with broader wave frameworks like Elliott Wave theory to gauge larger cyclical moves.
Watch closely for the Kumo Twist, which occurs whenever Senkou Span A crosses Senkou Span B inside the forward-projected cloud. A twist suggests that directional momentum is rotating and the prevailing trend may be exhausting its energy. However, treat a twist as an early warning rather than an automatic entry trigger, as range-bound markets produce frequent false twists that whip back and forth.
How to Use the Ichimoku Cloud Strategy: Core Setups and Entry Rules
To trade successfully with this framework, you must avoid taking isolated indicator triggers in a vacuum. A high-probability setup requires a strict 3-tier validation sequence: market regime filter, momentum trigger, and historical clearance.
Strong vs. Weak TK Cross Signals
A TK Cross (Tenkan-Kijun Cross) occurs when the faster Tenkan-sen crosses the slower Kijun-sen, mirroring a classic moving average crossover. However, the reliability of a TK Cross depends entirely on its location relative to the Kumo.
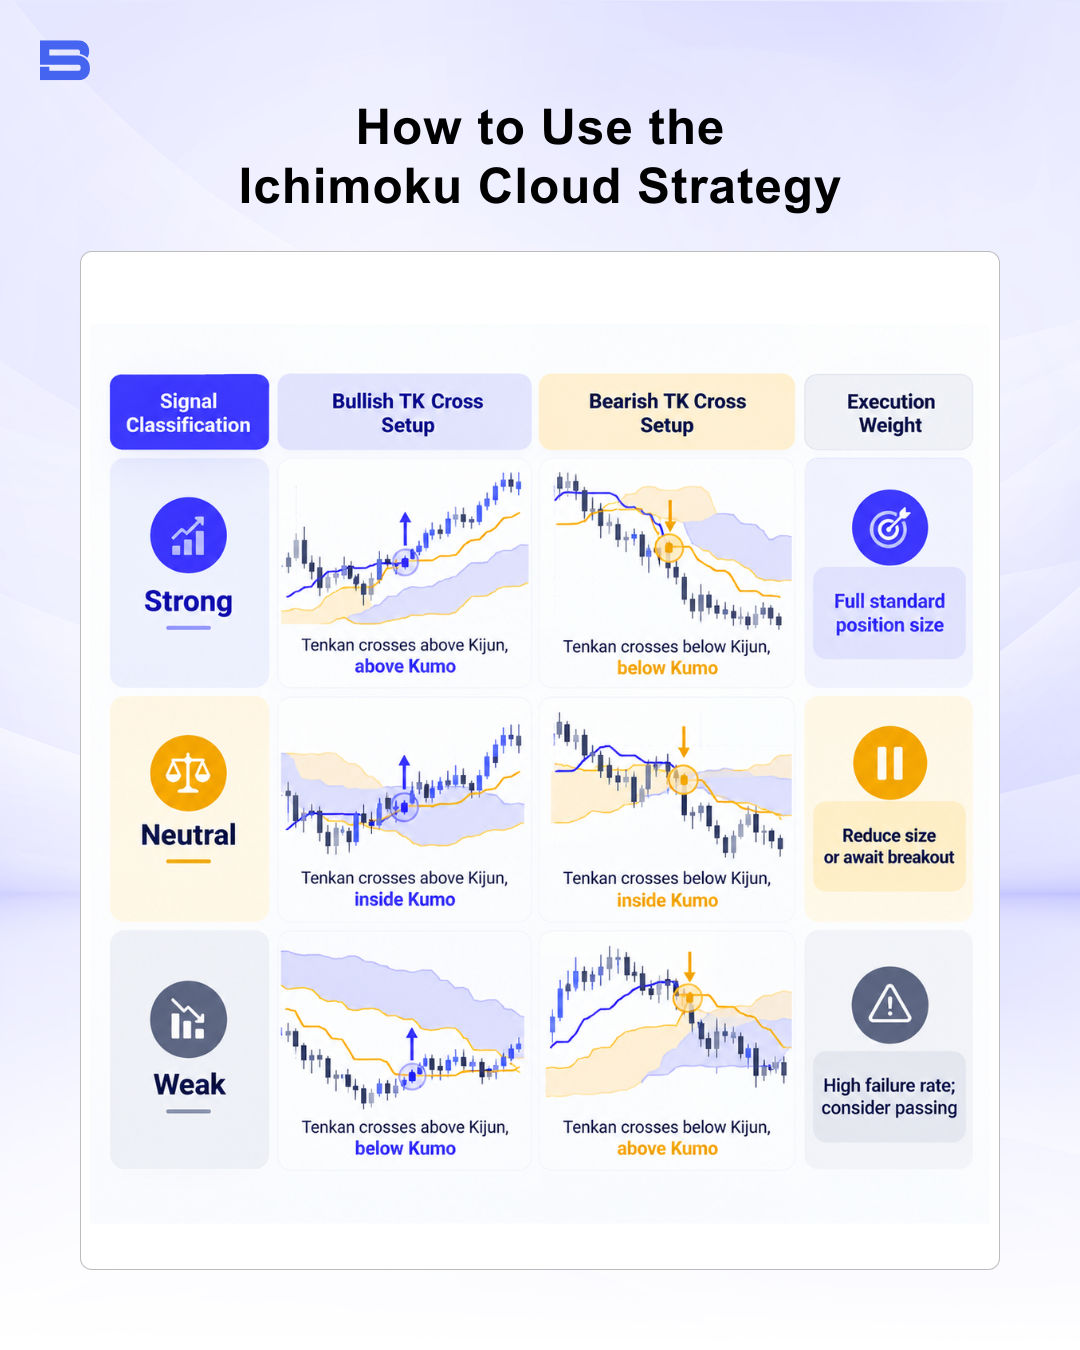
Taking a weak cross often means buying directly into overhead cloud resistance, which may reduce the chance that the move follows through.
The table below summarizes how the strength of a TK Cross depends on where it forms relative to the cloud.
| Signal strength | Bullish TK Cross | Bearish TK Cross | Execution approach |
|---|---|---|---|
| Strong | Tenkan crosses above Kijun, above the cloud | Tenkan crosses below Kijun, below the cloud | Full standard position size |
| Neutral | Tenkan crosses above Kijun, inside the cloud | Tenkan crosses below Kijun, inside the cloud | Reduce size or await a breakout |
| Weak | Tenkan crosses above Kijun, below the cloud | Tenkan crosses below Kijun, above the cloud | High failure rate; consider passing |
Trading the Kumo Breakout Setup
The Kumo breakout is the cornerstone strategy for trend-following traders seeking sustained directional moves. An entry trigger occurs when price breaks cleanly out of the Kumo and closes entirely beyond the outer cloud boundary.
Never anticipate the breakout while a candle is actively fluctuating inside the cloud. Intraday price spikes routinely reverse before candle close, leaving aggressive buyers trapped inside the zone. You can strengthen your breakout confirmation by checking volume anchors using the Volume Weighted Average Price (VWAP) indicator to verify that institutional volume supports the move.
Using Chikou Span Confirmation to Filter False Signals
Before entering any trade, look back 26 periods on your chart and locate the Chikou Span. For a valid long setup, the Chikou Span must be trading in open space, completely unobstructed by historical price candles.
If the Chikou Span is tangled within historical price candles, price is battling historical congestion and momentum is likely to stall. Passing on trades where the lagging line lacks open space may help you avoid some whipsaw losses, although no filter removes losing trades entirely.
Classic vs. 24/7 Crypto Ichimoku Cloud Settings
Hosoda calibrated the standard Ichimoku parameters (9, 26, 52) around the traditional Japanese financial workweek of the 1930s. In that era, equity and commodity markets operated six days a week, making 9 periods equal a week and a half, 26 periods represent one month, and 52 periods equal two months.
In modern 24/7 markets such as cryptocurrency, many traders experiment with modified settings such as (10, 30, 60) or (20, 60, 120) to reflect continuous trading. Doubled settings smooth out erratic crypto volatility, helping you filter out intraday spikes around news events.
The table below compares the classic settings with the two common modified versions.
| Setup | Tenkan-sen | Kijun-sen | Senkou Span B | Typical use |
|---|---|---|---|---|
| Classic | 9 | 26 | 52 | Traditional markets |
| Modified | 10 | 30 | 60 | 24/7 markets, light smoothing |
| Modified | 20 | 60 | 120 | 24/7 markets, heavier smoothing |
However, non-standard settings carry a distinct operational drawback. Because many traders and automated systems use the classic 9, 26, 52 parameters, the original inputs may attract stronger support and resistance reactions in liquid markets, although this effect is not guaranteed.
Trade Invalidation, Stop-Loss Placement, and Sideways Traps
A disciplined execution strategy requires predefined invalidation levels and an objective understanding of market conditions where the system underperforms. The Bank for International Settlements (BIS) publishes regular research on foreign exchange market liquidity, and conditions can shift quickly around news events, so strict risk controls are essential for protecting trading capital.
Consider a practical swing trading scenario on EUR/USD. The currency pair completes a bullish Kumo breakout candle close at 1.0850, supported by a strong TK cross and an unobstructed Chikou Span. You place your initial protective stop-loss just below the Kijun-sen at 1.0790, risking exactly 60 pips.
To maintain a favorable 1:3 risk-to-reward profile, you establish a profit target at 1.1030, representing 180 pips of potential upside. This is a hypothetical example for illustration only, not a forecast. Price may reverse before reaching the target, and slippage or gaps can cause losses larger than the planned 60 pips. On a standard $10,000 account risking 1% ($100), your position size would be approximately 0.17 standard lots (about 1.7 mini-lots), calculated as $100 ÷ (60 pips × $10 per pip per standard lot).
As price advances in your favor, you trail your stop-loss upward along the rising Kijun-sen, protecting accrued profits while allowing the trend room to breathe. Many traders combine this trailing technique with a Heikin Ashi chart to filter out counter-trend noise during lengthy trend legs.
You must also recognize sideways market traps. When price consolidates, the Kijun-sen flattens out, transforming from a trend benchmark into an aggressive price magnet. Trading inside a horizontal cloud tends to produce repeated false breakouts and can erode capital quickly. When the cloud is flat and price sits inside it, standing aside until a clear trend emerges is often the more disciplined choice.
Discipline Over Prediction With Ichimoku
The Ichimoku Cloud strategy offers a complete visual framework for identifying market trends, timing momentum entries, and managing downside exposure. Its real edge lies not in predicting future prices, but in giving you the objective discipline to trade strong trends and stand aside during choppy consolidation.
- How to Build an Investment Plan That Actually Works for You?
- What Is the MACD Indicator and How to Use It
- What Is a Wedge Pattern in Trading?
- What Is Ichimoku Cloud Strategy? A Complete Trading System
- Mastering Elliott Wave Theory: Rules and Trading Strategies
- News Trading: Strategies, Execution Risks, and Risk Control
- What Is an Iron Condor Options Strategy?
- Backtesting Explained: What It Is and Why It Really Matters
- Grid Trading: Mechanics, Parameters, and Risk Strategies
- What Is Breakout Trading and How Does It Work?
- Mean Reversion: Technical Strategies and Risk Frameworks
- Momentum Trading: Indicators, Strategies, and Risk Control
- Hammer Candlestick: Structure, Meaning, and Strategy
- Doji Candlestick: Types, Signals, and Trading Strategies
- What Is the Sharpe Ratio and How to Calculate It
- What Is VWAP and How Do Traders Use It?
- Trade the Ascending Triangle: A Step-by-Step Practical Guide
- What Is the Stochastic Oscillator and How to Use It
- How to Trade the Descending Triangle Pattern
- High Frequency Trading: Speed, Algorithms, and Market Impact
- What Is Volume Profile and How to Use It in Trading
- What Is a Morning Star Pattern Candlestick?
- Trade with Parabolic SAR: A Practical Analysis Guide
- Evening Star Pattern: Structure, Rules, and Risk Controls
- Kelly Criterion: Formula, Position Sizing, and Risk
- What Is the NYSE Minimum Trading Price? Rules Explained
Disclaimer: The content on this page is intended for educational and informational purposes only. It does not constitute financial, investment, tax, or legal advice, and should not be interpreted as a recommendation to buy, sell, or hold any financial instrument or asset. Trading and investing involve significant risk, including the possible loss of your entire capital. Products such as forex, CFDs, and cryptocurrencies carry additional risks due to leverage, high volatility, and limited regulatory protection in some jurisdictions. Past performance of any financial instrument does not guarantee future results. Any market views, forecasts, or opinions expressed are those of the author at the time of writing and may not reflect current market conditions. Platform features, fees, and regulatory status are subject to change — always verify information directly with the relevant provider or regulator before making any financial decision. BrokerSpecs may receive compensation from third parties featured on this site. Always conduct your own due diligence and consider seeking advice from a licensed financial professional before investing. Portions of this article were prepared with the assistance of AI tools and reviewed by our editorial team before publication.