


Related Tags
A quantitative trader spends months developing an automated trend-following system. On paper, their simulated trades produce an 80% win rate and double-digit annualized returns. Yet, shortly after deployment, the strategy's live equity begins to deteriorate.
This disconnect can arise when historical backtests rely on unrealistic assumptions or are affected by overfitting, transaction costs, slippage, liquidity constraints, and changing market conditions.
The Chartered Financial Analyst (CFA) Institute notes that backtests are proxies for actual investing and can be affected by issues such as look-ahead bias, survivorship bias, structural breaks, and limitations in representing real-world trading conditions.
Backtesting provides a vital framework to stress-test trading rules against historical market data before committing real capital. However, static historical charts rarely capture the reality of live market execution. Understanding how to construct an uncorrupted backtest—and factoring in unavoidable transaction drag—is what separates robust quantitative strategies from paper-trading fantasies.
What Is Backtesting and How Does It Work?
Backtesting is the process of testing a rules-based trading strategy on historical market data to evaluate its risk and return profile.
To simulate a strategy, a rules engine parses past price action bar-by-bar or tick-by-tick. Whenever historical market conditions satisfy specific criteria, the engine logs a simulated order, tracking virtual entries, exits, profit margins, and stop-loss levels.
If you're new to this, a moving average simply smooths out price action over a set number of periods, and an indicator like the RSI measures how fast and how far price has recently moved. Backtesting lets you check whether rules built on signals like these would actually have worked in the past.
Consider a basic technical system built on a daily moving average crossover on the S&P 500 index over one year:
- Dataset: 252 trading days of daily open, high, low, and close (OHLC) data.
- Rules Engine: Go long when the 20-period moving average crosses above the 50-period moving average; close the trade when it crosses below.
- Simulated Execution: The engine logs 100 closed trades starting with a $10,000 virtual balance.
- Unadjusted Output: A 55% win rate with a 1:2 risk-to-reward ratio yields an unadjusted nominal profit of $1,500 (+15%).
While a +15% nominal return looks promising, this static output assumes instant fills, zero transaction costs, and perpetual market liquidity. Without accounting for real-world frictions, theoretical edges quickly evaporate.
Step-by-Step: How Do You Backtest a Trading Strategy?
Building a quantitative backtest requires a structured methodology to isolate true predictive power from random market noise.
Strategy Rule Definition & Data Ingestion
Every operational metric must be explicitly programmed. Vague conditions like "buy when momentum is strong" must be converted into deterministic logic, such as "enter long at market open when the 14-period Relative Strength Index (RSI) crosses above 30." Data quality is paramount: low-resolution daily charts miss intraday volatility spikes, while low-quality data feeds may omit corporate actions, dividend adjustments, or stock splits.
In-Sample vs. Out-of-Sample Data Split
To ensure a strategy adapts well to unseen market conditions, partition your historical dataset into two distinct sets:
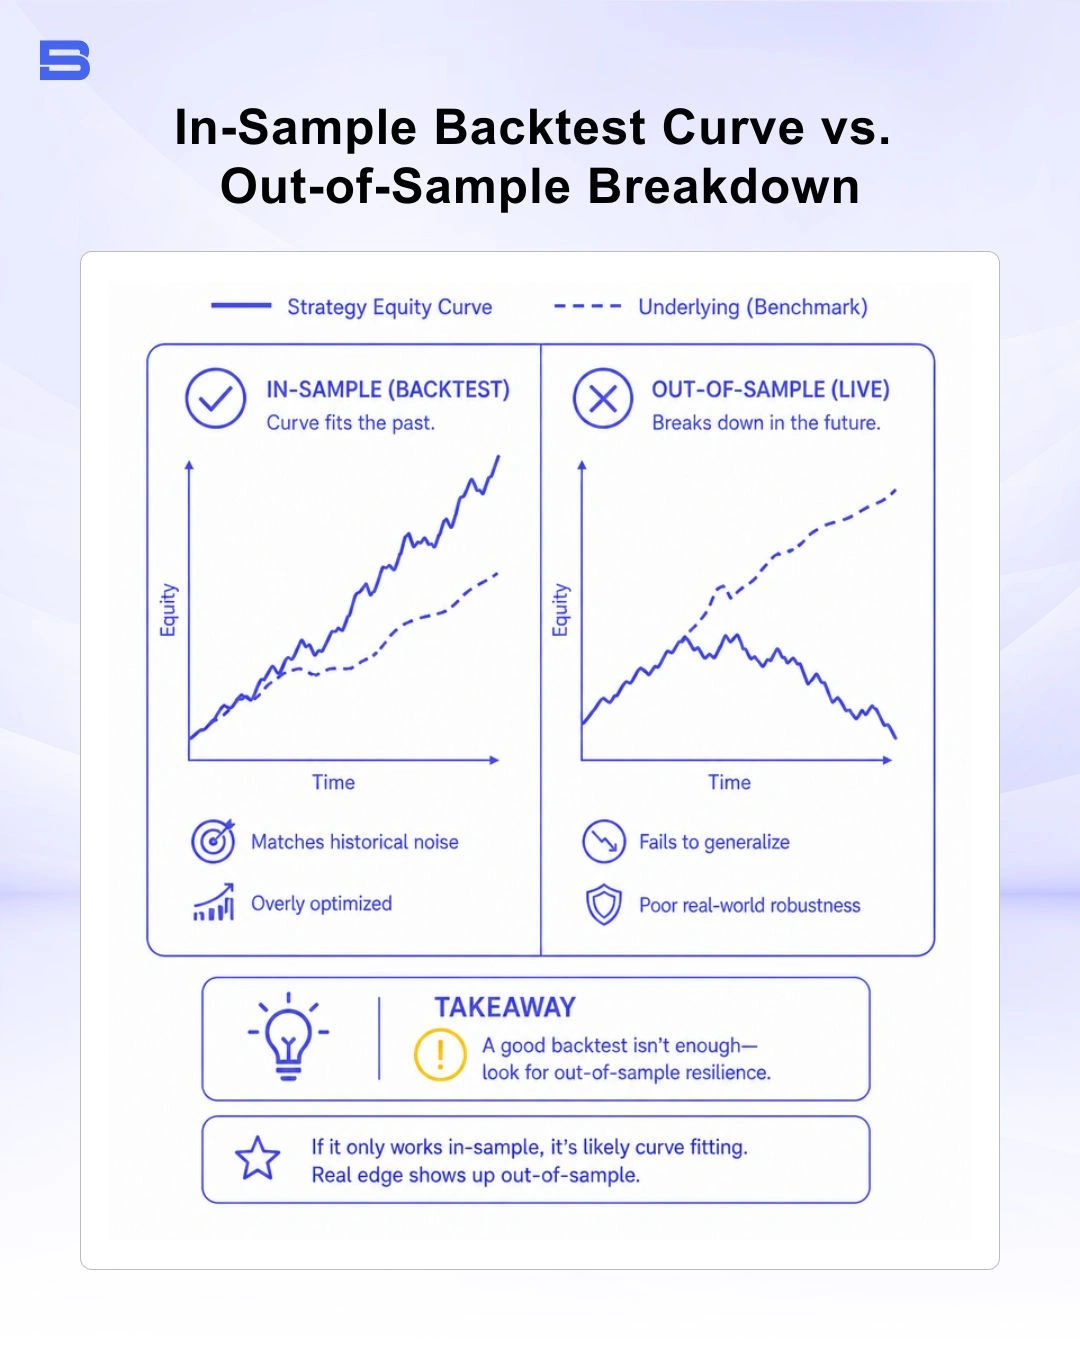
- In-Sample Data (e.g., 70% of historical timeline): Use the in-sample period to develop and calibrate the strategy, including fine-tuning signal parameters, indicator periods, and stop-loss settings. The remaining data should be kept separate for out-of-sample validation. A 70% allocation is a common example, not a universal requirement. CFA Institute emphasizes fitting or calibrating trading signals within the development period and testing the resulting strategy on separate data to assess its robustness.
- Out-of-Sample Data (e.g., remaining 30%): Keep this portion of the historical data untouched during initial strategy development and use it to evaluate whether the optimized strategy maintains its performance on previously unseen data. The 30% allocation is illustrative rather than a universal requirement. CFA Institute emphasizes using data separate from and chronologically after the model-development period to assess a strategy's effectiveness and robustness out of sample.
Performance Evaluation & Metrics
Once simulated, you need to analyze core statistical metrics through institutional guidelines, such as those published by the CFA Institute, to judge trade distribution quality:
- Sharpe Ratio: Measures risk-adjusted returns relative to portfolio volatility.
- Maximum Drawdown (MDD): Tracks the peak-to-trough decline in account equity, highlighting worst-case capital exposure.
- Profit Factor: Gross profits divided by gross losses (a healthy strategy typically targets >1.5).
Core Pitfalls: Eliminating Look-Ahead, Survivorship, and Overfitting Biases
Theoretical backtests often fail because of subtle statistical biases baked into the code.
Overfitting and Curve Fitting Risk
Overfitting occurs when you over-optimize parameters until the strategy fits past market noise perfectly rather than underlying market structure. Adjusting a moving-average length from 20 to 18.5 periods solely to improve historical results can contribute to backtest overfitting, particularly when many parameter combinations are tested, and the best-performing configuration is selected. Such optimization can produce a brittle system that performs well in historical data but deteriorates when exposed to new or live market conditions.
CFA Institute notes that overfitting occurs when a strategy is tailored too closely to past market conditions, while research by Bailey and López de Prado shows that overfit strategies can perform poorly out of sample.
Eliminating Look-Ahead and Survivorship Bias
Look-ahead bias occurs when an algorithm inadvertently uses future price information to execute past trades—such as calculating an entry based on the current bar's closing price before that bar has actually closed.
Survivorship bias occurs when backtesting stock portfolios using only currently active companies. Evaluating historical equities strategies without accounting for delisted or bankrupt companies skews historical performance unnaturally higher.
Backtesting vs. Forward Testing and Paper Trading
Understanding these differences is crucial for practical implementation:
- Backtesting: Fast, historical simulation covering years of price data in seconds.
- Forward Testing (Paper Trading): Running the strategy in real time on demo accounts. It exposes execution logic to live data feeds, confirming whether signal delivery works without risking real capital.
Factoring Slippage, Spreads, and Commission Frictions
The single largest reason backtest performance breaks down in live markets is the omission of execution drag.
Real trading conditions introduce constant friction:
- Bid-Ask Spread Expansion: Spreads widen during economic releases or low-liquidity market sessions, increasing transaction costs.
- Slippage: The difference between your expected order price and the actual execution price. Market orders during high volatility are rarely filled without slippage.
- Overnight Swaps & Commissions: Carrying positions overnight incurs financing charges, while active intraday strategies incur per-lot transaction fees that compound over hundreds of trades.
Brokers operating under institutional execution guidelines—such as standards monitored by the Securities Commission Malaysia (SC)—fill orders at prevailing market prices, which rarely match ideal backtest assumptions.
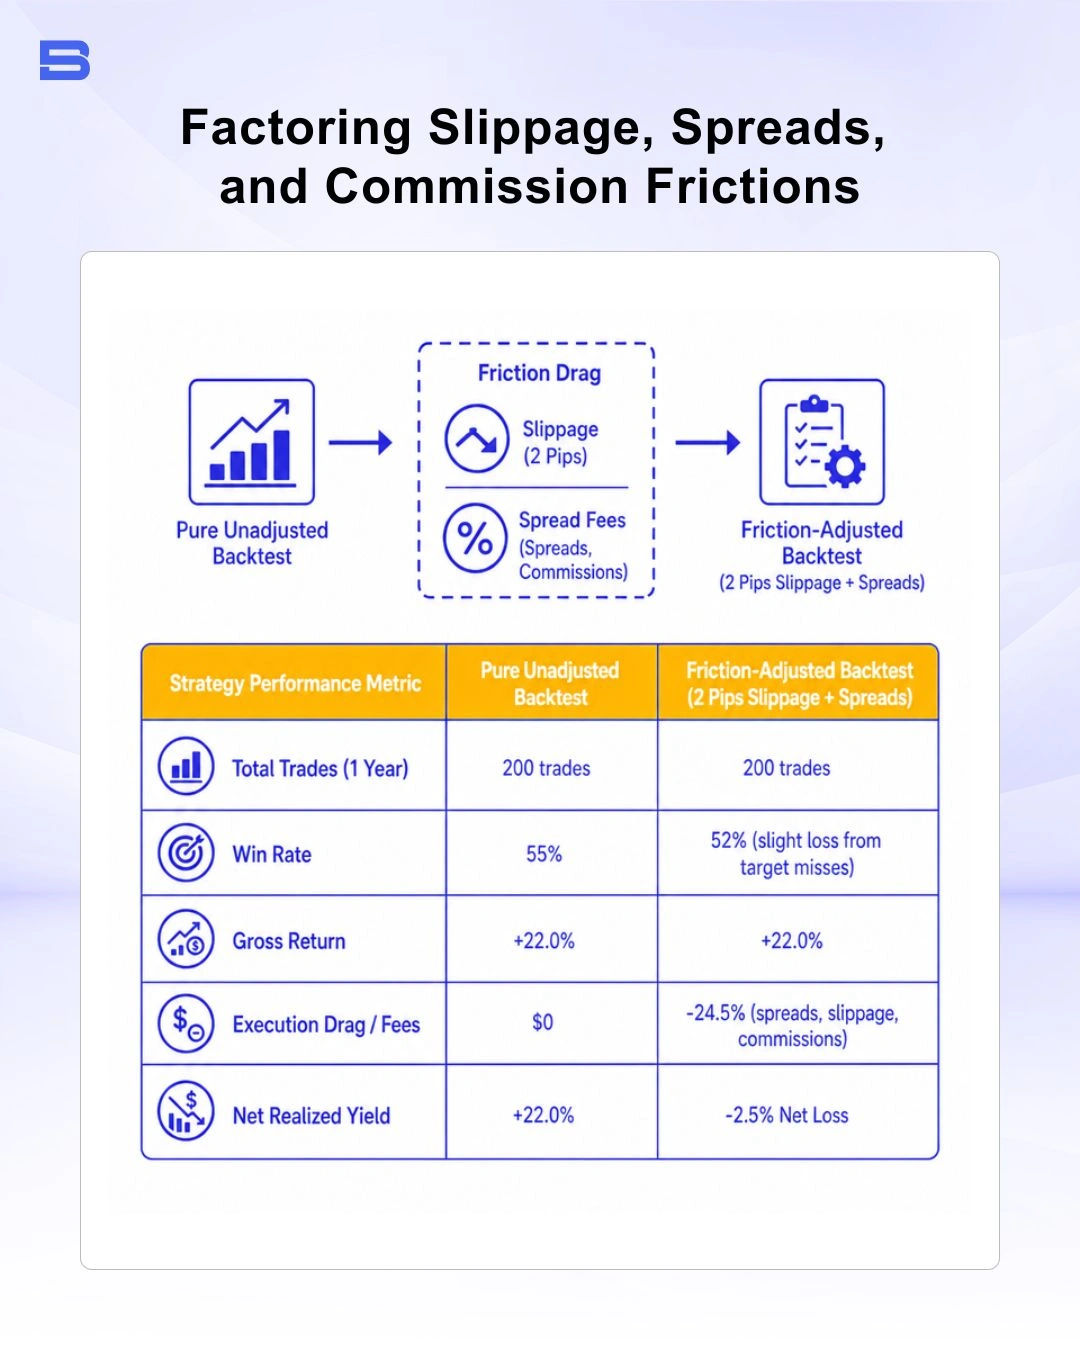
When trading highly leveraged contracts, minor execution delays can turn a statistically profitable backtest into a net loss. You need to always incorporate realistic spread assumptions and conservative slippage buffers into backtesting software.
Backtesting in Algorithmic Trading vs. Manual Execution
Backtesting methods vary depending on whether you run programmatic trading scripts or execute trades manually.
Quantitative Trading Frameworks
Quantitative traders leverage specialized languages—such as Python (using the Backtrader or Pandas libraries), Pine Script (TradingView's scripting language), or MQL5 (MetaTrader's scripting language)—to automate backtests across millions of ticks. Vectorized backtesting speeds up your performance analysis across large datasets, while event-driven frameworks simulate order queue latency, limit order fills, and partial fills with extreme accuracy.
Strategy Application: Position Trading & Trend Systems
A long-term position trading strategy relying on weekly fundamental trends behaves differently during backtesting than a high-frequency system. Multi-month position holding rules generate fewer trades, making it harder to achieve statistical significance over short timeframes.
Conversely, short-term momentum or automated copy trading systems yield hundreds of data points quickly, requiring precise modeling of spread widenings and execution speed.
The Bottom Line
Backtesting is an indispensable diagnostic tool for modern traders, filtering out unviable ideas before capital is put at risk. However, a backtest is a historical simulation, not a guarantee of future live performance. By accounting for overfitting biases and incorporating real-world transaction drag, you can bridge the gap between theoretical models and live market success.
- How to Build an Investment Plan That Actually Works for You?
- What Is the MACD Indicator and How to Use It
- What Is a Wedge Pattern in Trading?
- What Is Ichimoku Cloud Strategy? A Complete Trading System
- Mastering Elliott Wave Theory: Rules and Trading Strategies
- News Trading: Strategies, Execution Risks, and Risk Control
- What Is an Iron Condor Options Strategy?
- Backtesting Explained: What It Is and Why It Really Matters
- Grid Trading: Mechanics, Parameters, and Risk Strategies
- What Is Breakout Trading and How Does It Work?
- Mean Reversion: Technical Strategies and Risk Frameworks
- Momentum Trading: Indicators, Strategies, and Risk Control
- Hammer Candlestick: Structure, Meaning, and Strategy
- Doji Candlestick: Types, Signals, and Trading Strategies
- What Is the Sharpe Ratio and How to Calculate It
- What Is VWAP and How Do Traders Use It?
- Trade the Ascending Triangle: A Step-by-Step Practical Guide
- What Is the Stochastic Oscillator and How to Use It
- How to Trade the Descending Triangle Pattern
- High Frequency Trading: Speed, Algorithms, and Market Impact
- What Is Volume Profile and How to Use It in Trading
- What Is a Morning Star Pattern Candlestick?
- Trade with Parabolic SAR: A Practical Analysis Guide
- Evening Star Pattern: Structure, Rules, and Risk Controls
- Kelly Criterion: Formula, Position Sizing, and Risk
- What Is the NYSE Minimum Trading Price? Rules Explained
Disclaimer: The content on this page is intended for educational and informational purposes only. It does not constitute financial, investment, tax, or legal advice, and should not be interpreted as a recommendation to buy, sell, or hold any financial instrument or asset. Trading and investing involve significant risk, including the possible loss of your entire capital. Products such as forex, CFDs, and cryptocurrencies carry additional risks due to leverage, high volatility, and limited regulatory protection in some jurisdictions. Past performance of any financial instrument does not guarantee future results. Any market views, forecasts, or opinions expressed are those of the author at the time of writing and may not reflect current market conditions. Platform features, fees, and regulatory status are subject to change — always verify information directly with the relevant provider or regulator before making any financial decision. BrokerSpecs may receive compensation from third parties featured on this site. Always conduct your own due diligence and consider seeking advice from a licensed financial professional before investing. Portions of this article were prepared with the assistance of AI tools and reviewed by our editorial team before publication.