


Related Tags
Imagine stepping up to execute a high-conviction trade setup. You have spent hours mapping support and resistance zones, confirming momentum indicators, and calculating your entry point. Yet, when deciding how much capital to assign to the trade, you hesitate. Risking a flat 1% feels overly cautious for a high-probability trade, while risking 10% introduces uncomfortable account volatility.
This dilemma plagues traders at every stage. Consistently assigning arbitrary position sizes creates erratic equity curves where winning streaks produce modest gains and losing streaks destroy months of progress.
The Kelly Criterion solves this allocation problem through pure mathematics. Originally developed to optimize signal processing in telecommunications, this formula determines the exact percentage of total capital to allocate to a trade or investment to maximize long-term compound growth.
Why Position Sizing Matters: Kelly vs Fixed Fractional
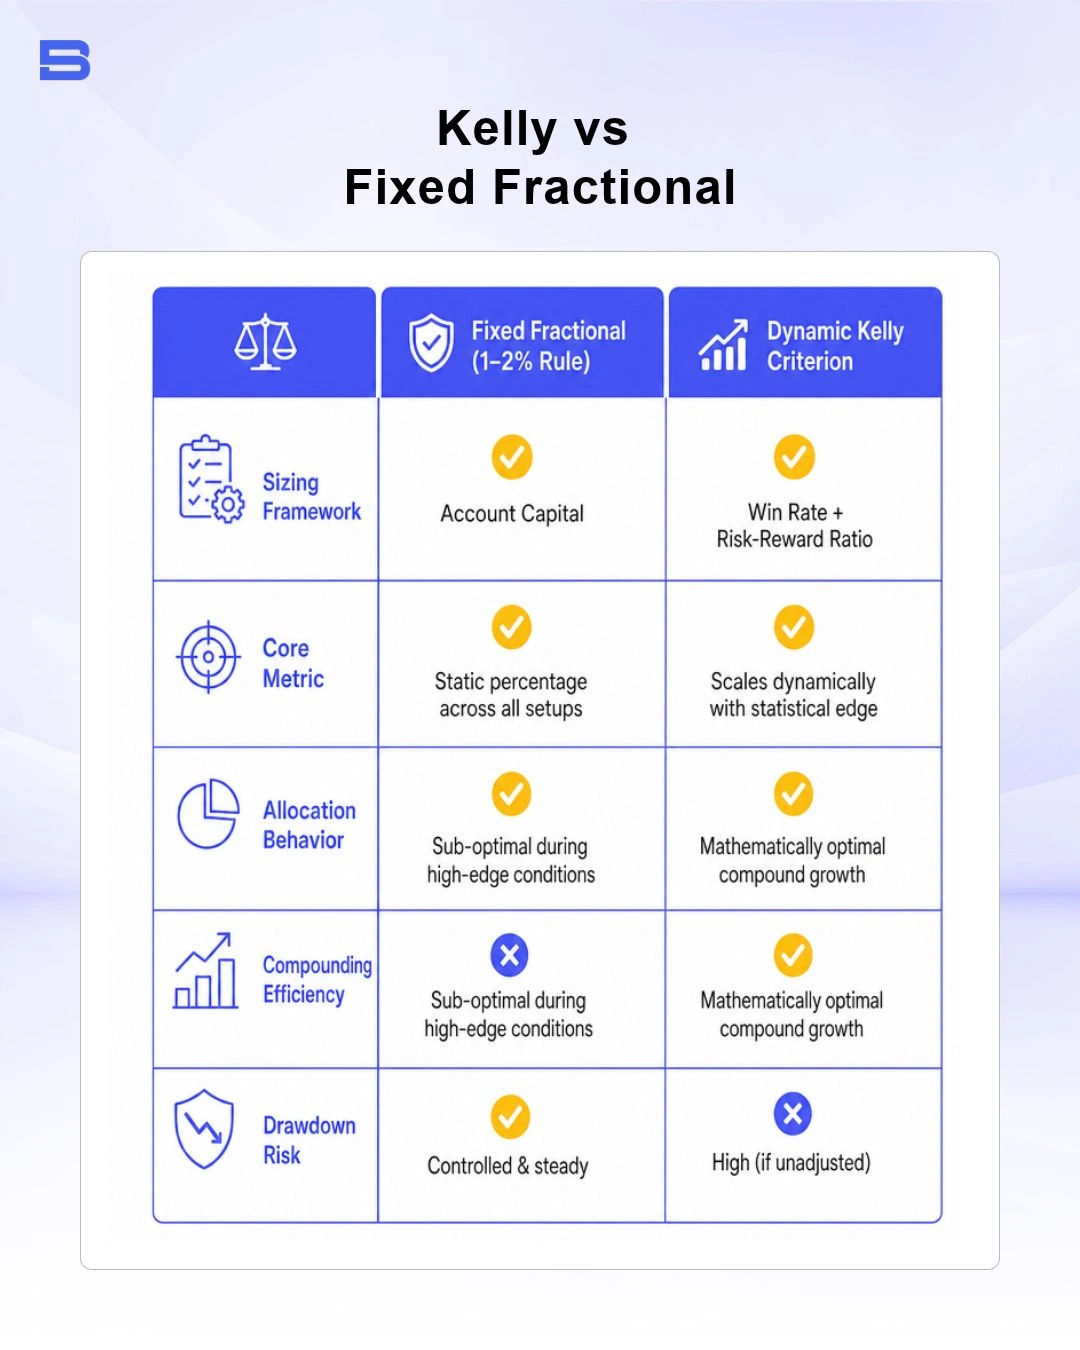
Long-term survival and growth in financial markets depend less on finding the perfect entry signal and far more on effective money management. Position sizing dictates how much capital is put at risk on any single market exposure, directly governing your account's drawdown profile and compounding rate.
Most retail traders adopt a fixed fractional approach. Under a standard 1% or 2% fixed fractional system, you risk the exact same percentage of your total equity on every single trade regardless of whether your statistical edge is massive or marginal. While fixed fractional sizing provides a simple safety net that prevents rapid account destruction, it fails to optimize capital efficiency when high-edge opportunities present themselves.
Dynamic position sizing frameworks like the Kelly Criterion adjust your position size based on verified historical statistical edge. When your win rate and payoff ratio improve, the formula scales up your allocation; when your edge narrows, capital exposure automatically contracts.
How to Calculate the Kelly Criterion Formula
Calculating your optimal trade allocation requires understanding the mathematical relationship between win probability and payoff ratio.
The discrete formula for the Kelly Criterion is expressed as:
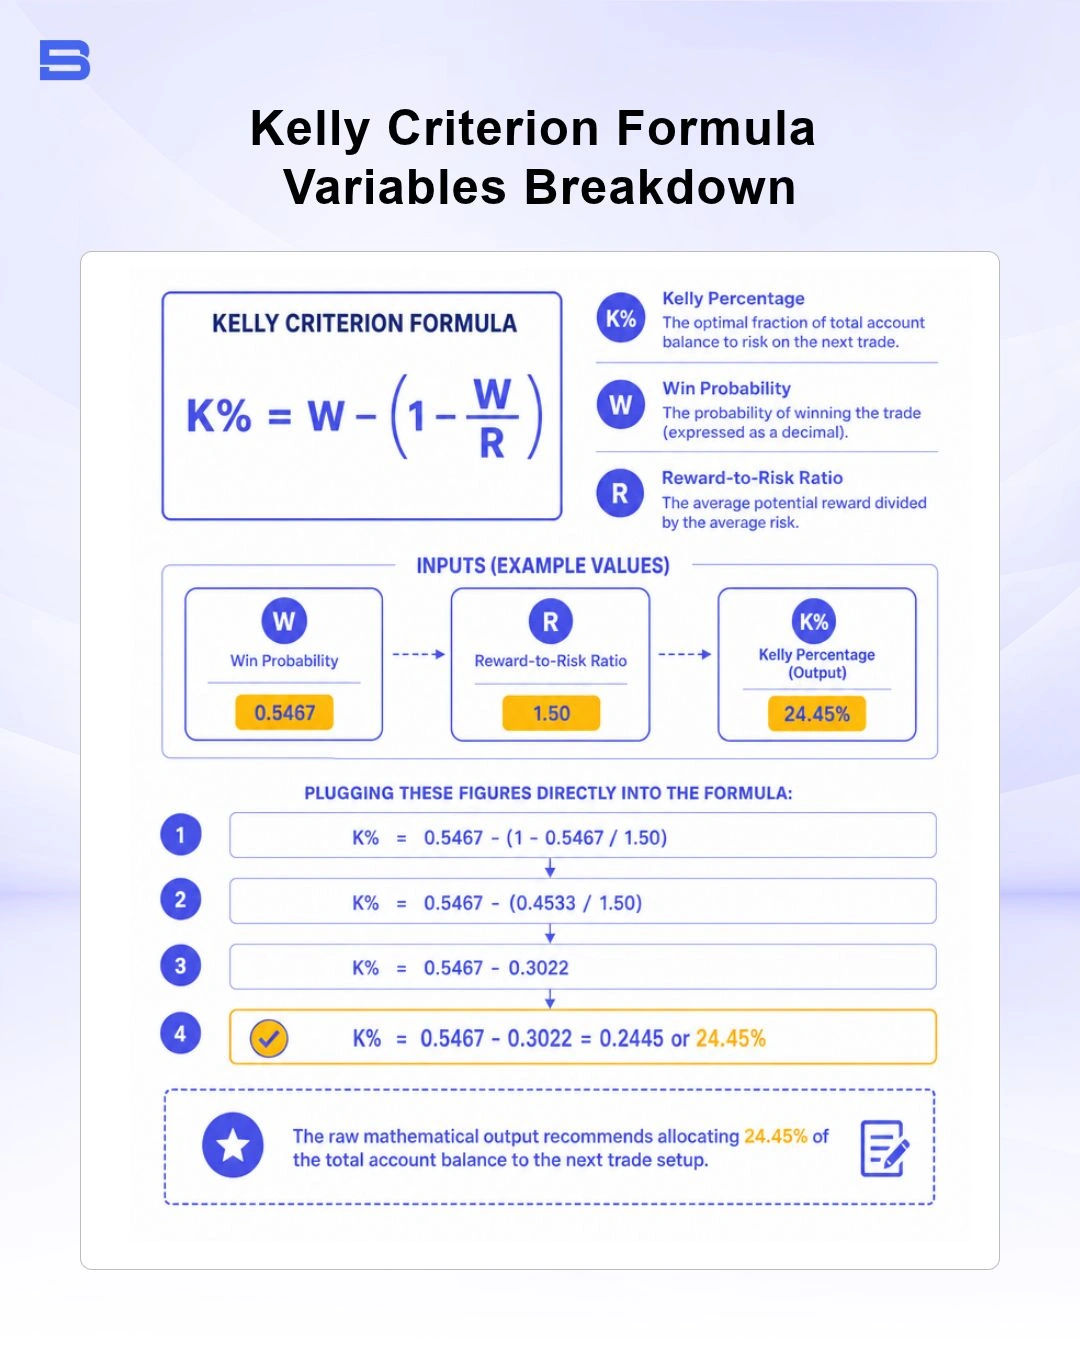
K% = W - [(1 - W) / R]
Where the mathematical variables are defined as:
- K%: The Kelly fraction (the percentage of your total trading capital to allocate to the trade).
- W: Your statistical win rate (the probability of a trade resulting in a profit, expressed as a decimal).
- R: Your payoff ratio — also called the reward-to-risk ratio — the average winning trade payout relative to the average losing trade loss.
Inputs Required for the Kelly Criterion Calculation
To yield accurate outputs, the formula demands precise input metrics extracted from your trading journal:
- Win Probability (W): Calculated by dividing total winning trades by total executed trades over a statistically significant sample size (typically 100+ trades). If you won 55 out of 100 trades, your W equals 0.55.
- Payoff Ratio (R): Calculated by dividing your average profit per winning trade by your average loss per losing trade. If your average win is $300 and your average loss is $200, your payoff ratio R is $300 / 200 = 1.5.
Step-by-Step Worked Calculation Scenario
Consider a systematic trader reviewing 150 past trades in the forex market. The historical log reveals the following verifiable metrics:
- Total Trades: 150
- Winning Trades: 82 (Win rate W = 82 / 150 = 0.5467 or 54.67%)
- Average Profit per Win: $450
- Average Loss per Loss: $300 (Payoff ratio R = 450 / 300 = 1.50)
Plugging these figures directly into the formula:
K% = 0.5467 - (1 - 0.5467 / 1.50)
K% = 0.5467 - (0.4533 / 1.50)
K% = 0.5467 - 0.3022 = 0.2445 or 24.45%
The raw mathematical output recommends allocating 24.45% of the total account balance to the next trade setup.
Full Kelly vs Fractional Kelly (Half & Quarter Kelly)
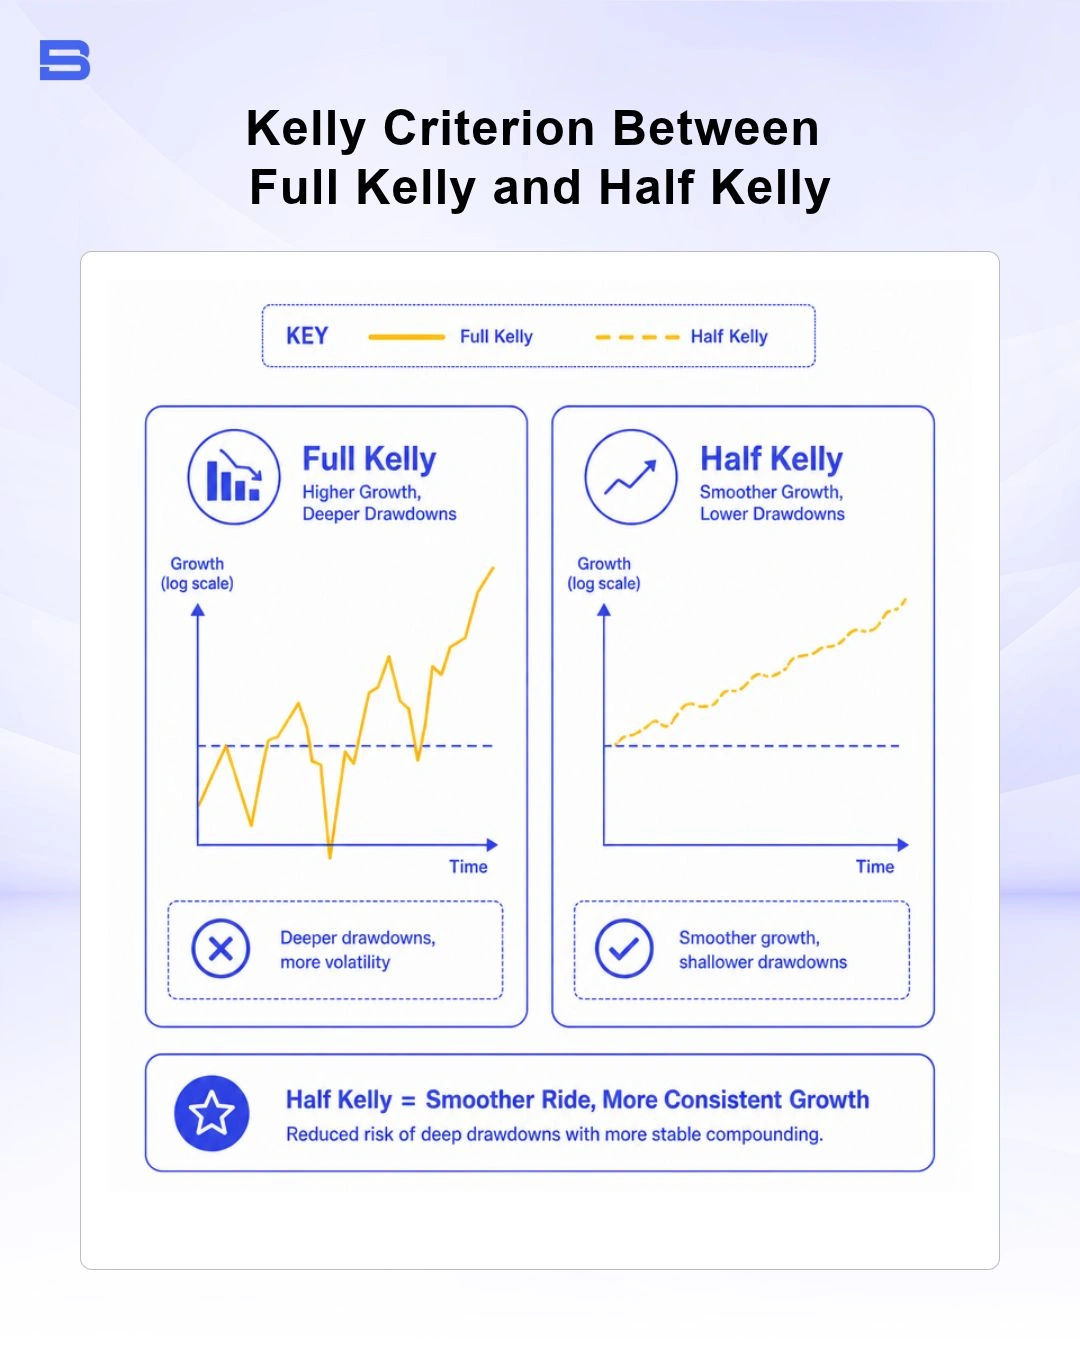
Executing a Full Kelly criterion size of 24.45% on a single trade introduces extreme equity variance. While Full Kelly theoretically maximizes compound wealth over an infinite horizon, it subjects real-world portfolios to severe drawdowns that exceed 50% during normal statistical losing streaks.
To eliminate catastrophic variance while capturing the compounding benefit of the framework, institutional funds and professional trading desks utilize Fractional Kelly:
- Half-Kelly (0.5 x K%): Takes 50% of the calculated output. In our scenario above, 24.45% x 0.5 = 12.22% allocation. Half-Kelly captures roughly 75% of the growth rate of Full Kelly while reducing peak-to-trough equity variance by 50%.
- Quarter-Kelly (0.25 x K%): Takes 25% of the calculated output. In our scenario, 24.45% x 0.25 = 6.11% allocation. Quarter-Kelly offers a smooth growth curve with minimal drawdown risk, serving as a realistic ceiling for multi-asset traders.
The Danger of Full Kelly: Drawdowns, Black Swans, and Estimation Error
While the mathematics behind position-sizing equations is elegant, applying raw calculations directly to real-world trading introduces significant operational hazards.
Parameter Estimation Error and Sensitivity
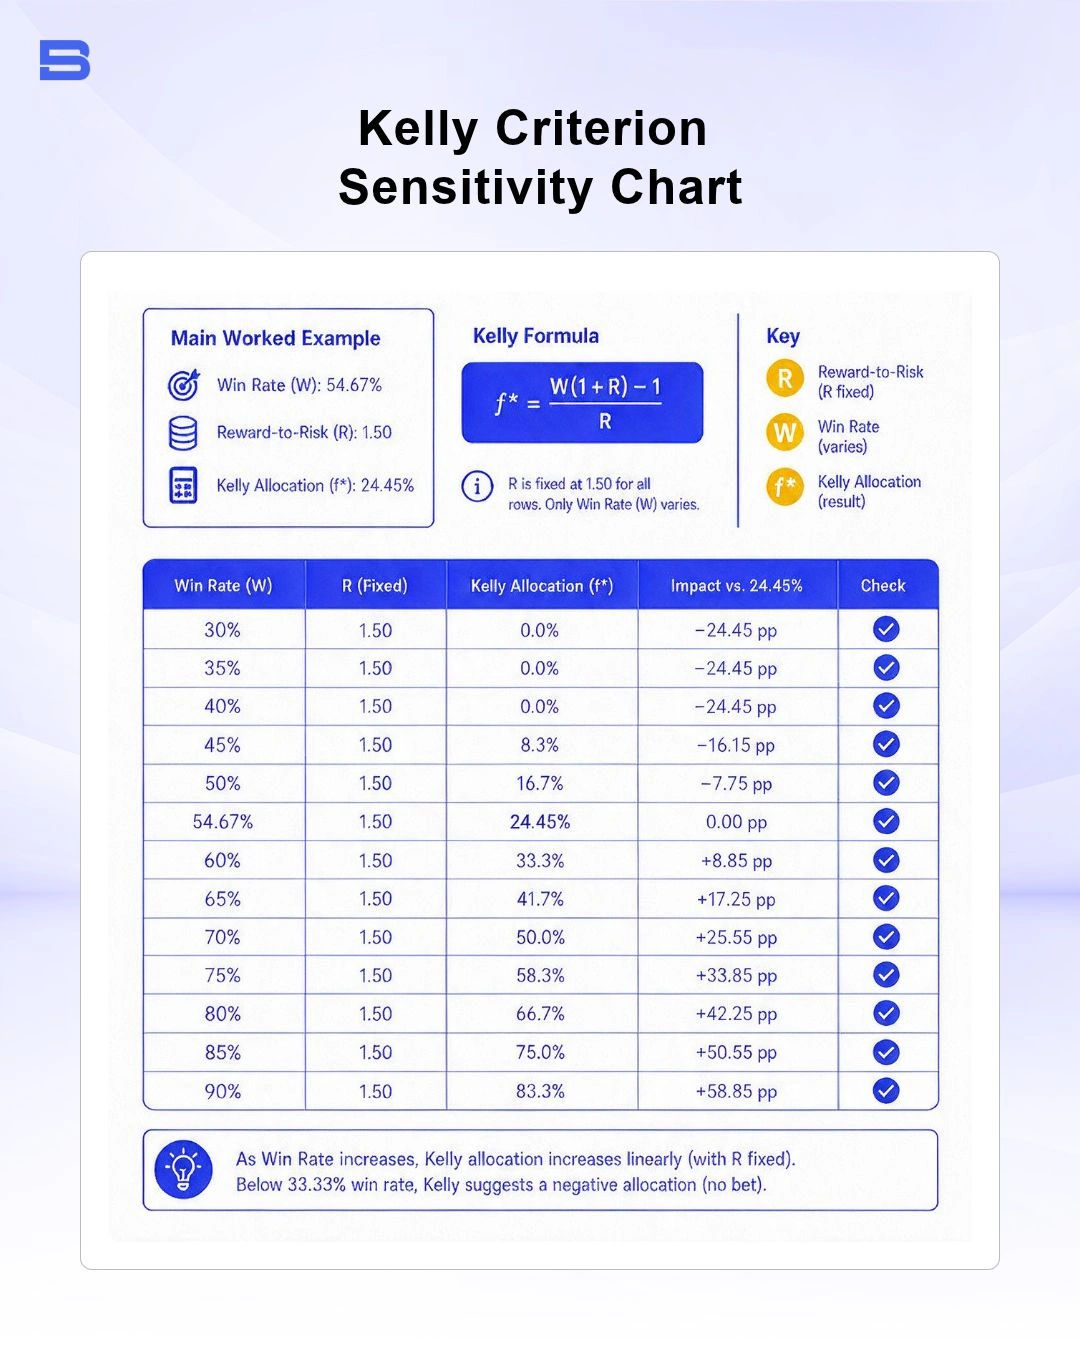
The biggest flaw in quantitative position sizing is parameter estimation error. Your historical win rate and payoff ratio are trailing estimates, not fixed physical constants. Markets undergo continuous regime shifts, causing underlying edge metrics to decay.
A minor 5% drop in win rate causes a massive, non-linear contraction in optimal position size. The sensitivity infographic below demonstrates how a small statistical shift alters risk exposure:
Risk of Ruin and Market Black Swans
Full Kelly criterion models assume smooth statistical distribution and continuous market liquidity. They fail to account for exogenous market shocks, structural gaps, or unexpected volatility surges.
During systemic tail-risk events (such as central bank policy shocks or liquidity freezes documented by the Bank for International Settlements (BIS), asset prices routinely gap past stop-loss levels. Carrying a Full Kelly criterion position size during a gap event elevates your true risk of ruin to dangerous levels, potentially wiping out entire accounts in a single session.
Comparing Risk Frameworks: Kelly Criterion vs Sharpe Ratio
Quantitative risk management spans both trade-level allocation tools and macro portfolio metrics. Comparing Kelly sizing against portfolio evaluation models clarifies its distinct role in trading systems.
The Kelly formula functions as an execution-level dynamic sizing engine designed to maximize wealth accumulation rate. In contrast, frameworks like the Sharpe ratio and value at risk serve as portfolio-level evaluation metrics:
- Sharpe Ratio: Measures excess risk-adjusted return per unit of total volatility. It tells you whether your returns stem from intelligent strategy design or excess risk-taking.
- Value at Risk (VaR): Estimates the maximum potential monetary loss over a defined timeframe at a specific statistical confidence level (e.g., a 95% 1-day VaR).
- Kelly Criterion: Tells you specifically how many units or lots to execute on the next trade based on your edge.
Institutional risk frameworks governed by CFA Institute standards routinely pair fractional Kelly criterion sizing with strict VaR constraints to ensure single-trade allocations never breach portfolio exposure limits.
The Bottom Line
The Kelly Criterion provides a rigorous mathematical bridge between historical trading statistics and dynamic position sizing. Full Kelly allocation introduces excessive volatility and drawdown risks that threaten long-term capital preservation. A disciplined Fractional Kelly model — such as Half or Quarter Kelly — lets you scale capital efficiently into high-probability setups while insulating your account from market tail risks.
- How to Build an Investment Plan That Actually Works for You?
- What Is the MACD Indicator and How to Use It
- What Is a Wedge Pattern in Trading?
- What Is Ichimoku Cloud Strategy? A Complete Trading System
- Mastering Elliott Wave Theory: Rules and Trading Strategies
- News Trading: Strategies, Execution Risks, and Risk Control
- What Is an Iron Condor Options Strategy?
- Backtesting Explained: What It Is and Why It Really Matters
- Grid Trading: Mechanics, Parameters, and Risk Strategies
- What Is Breakout Trading and How Does It Work?
- Mean Reversion: Technical Strategies and Risk Frameworks
- Momentum Trading: Indicators, Strategies, and Risk Control
- Hammer Candlestick: Structure, Meaning, and Strategy
- Doji Candlestick: Types, Signals, and Trading Strategies
- What Is the Sharpe Ratio and How to Calculate It
- What Is VWAP and How Do Traders Use It?
- Trade the Ascending Triangle: A Step-by-Step Practical Guide
- What Is the Stochastic Oscillator and How to Use It
- How to Trade the Descending Triangle Pattern
- High Frequency Trading: Speed, Algorithms, and Market Impact
- What Is Volume Profile and How to Use It in Trading
- What Is a Morning Star Pattern Candlestick?
- Trade with Parabolic SAR: A Practical Analysis Guide
- Evening Star Pattern: Structure, Rules, and Risk Controls
- Kelly Criterion: Formula, Position Sizing, and Risk
- What Is the NYSE Minimum Trading Price? Rules Explained
Disclaimer: The content on this page is intended for educational and informational purposes only. It does not constitute financial, investment, tax, or legal advice, and should not be interpreted as a recommendation to buy, sell, or hold any financial instrument or asset. Trading and investing involve significant risk, including the possible loss of your entire capital. Products such as forex, CFDs, and cryptocurrencies carry additional risks due to leverage, high volatility, and limited regulatory protection in some jurisdictions. Past performance of any financial instrument does not guarantee future results. Any market views, forecasts, or opinions expressed are those of the author at the time of writing and may not reflect current market conditions. Platform features, fees, and regulatory status are subject to change — always verify information directly with the relevant provider or regulator before making any financial decision. BrokerSpecs may receive compensation from third parties featured on this site. Always conduct your own due diligence and consider seeking advice from a licensed financial professional before investing. Portions of this article were prepared with the assistance of AI tools and reviewed by our editorial team before publication.