


Related Tags
Entering a position in a volatile market often feels like navigating unmapped open water—prices surge violently, drop suddenly, and resume course just as you exit. Many technical analysis tools simply tell you where the price has been, but Elliott Wave theory attempts to provide a structural map of where the overall market cycle is going by analyzing collective market sentiment.
Rather than treating price swings as random noise, this approach organizes market behavior into recognizable, recurring fractal patterns. When applied correctly alongside strict risk management, wave mechanics allow you to identify structural entry points, set precise invalidation levels, and measure probability—without relying on guesswork or hype.
Historical Context: From Dow Theory to Wave Mechanics
To understand how Elliott Wave analysis developed, it helps to look back at its foundations. In the late 19th and early 20th centuries, Charles Dow’s Dow Theory established principles for analyzing market trends and described three broad phases of a major market move: accumulation, public participation, and distribution. Dow’s work also highlighted the influence of investor behavior on market trends.
In the 1930s, accountant Ralph Nelson Elliott built upon ideas associated with Dow Theory after studying decades of stock-market data across multiple timeframes. Elliott's original wave principle proposed that market prices unfold in recurring wave structures that reflect changes in collective investor psychology. He also observed that similar structures could appear at different degrees of trend, creating the self-similar or fractal-like patterns that are central to Elliott Wave analysis.
Because collective crowd psychology continuously swings between optimism and pessimism, these sentiment cycles generate identical wave structures across multi-year charts down to minute-by-minute order books. Today, institutional trading desks utilize these fractal principles to gauge where a market sits within its broader cycle.
Core Mechanics of Elliott Wave Theory in Technical Analysis
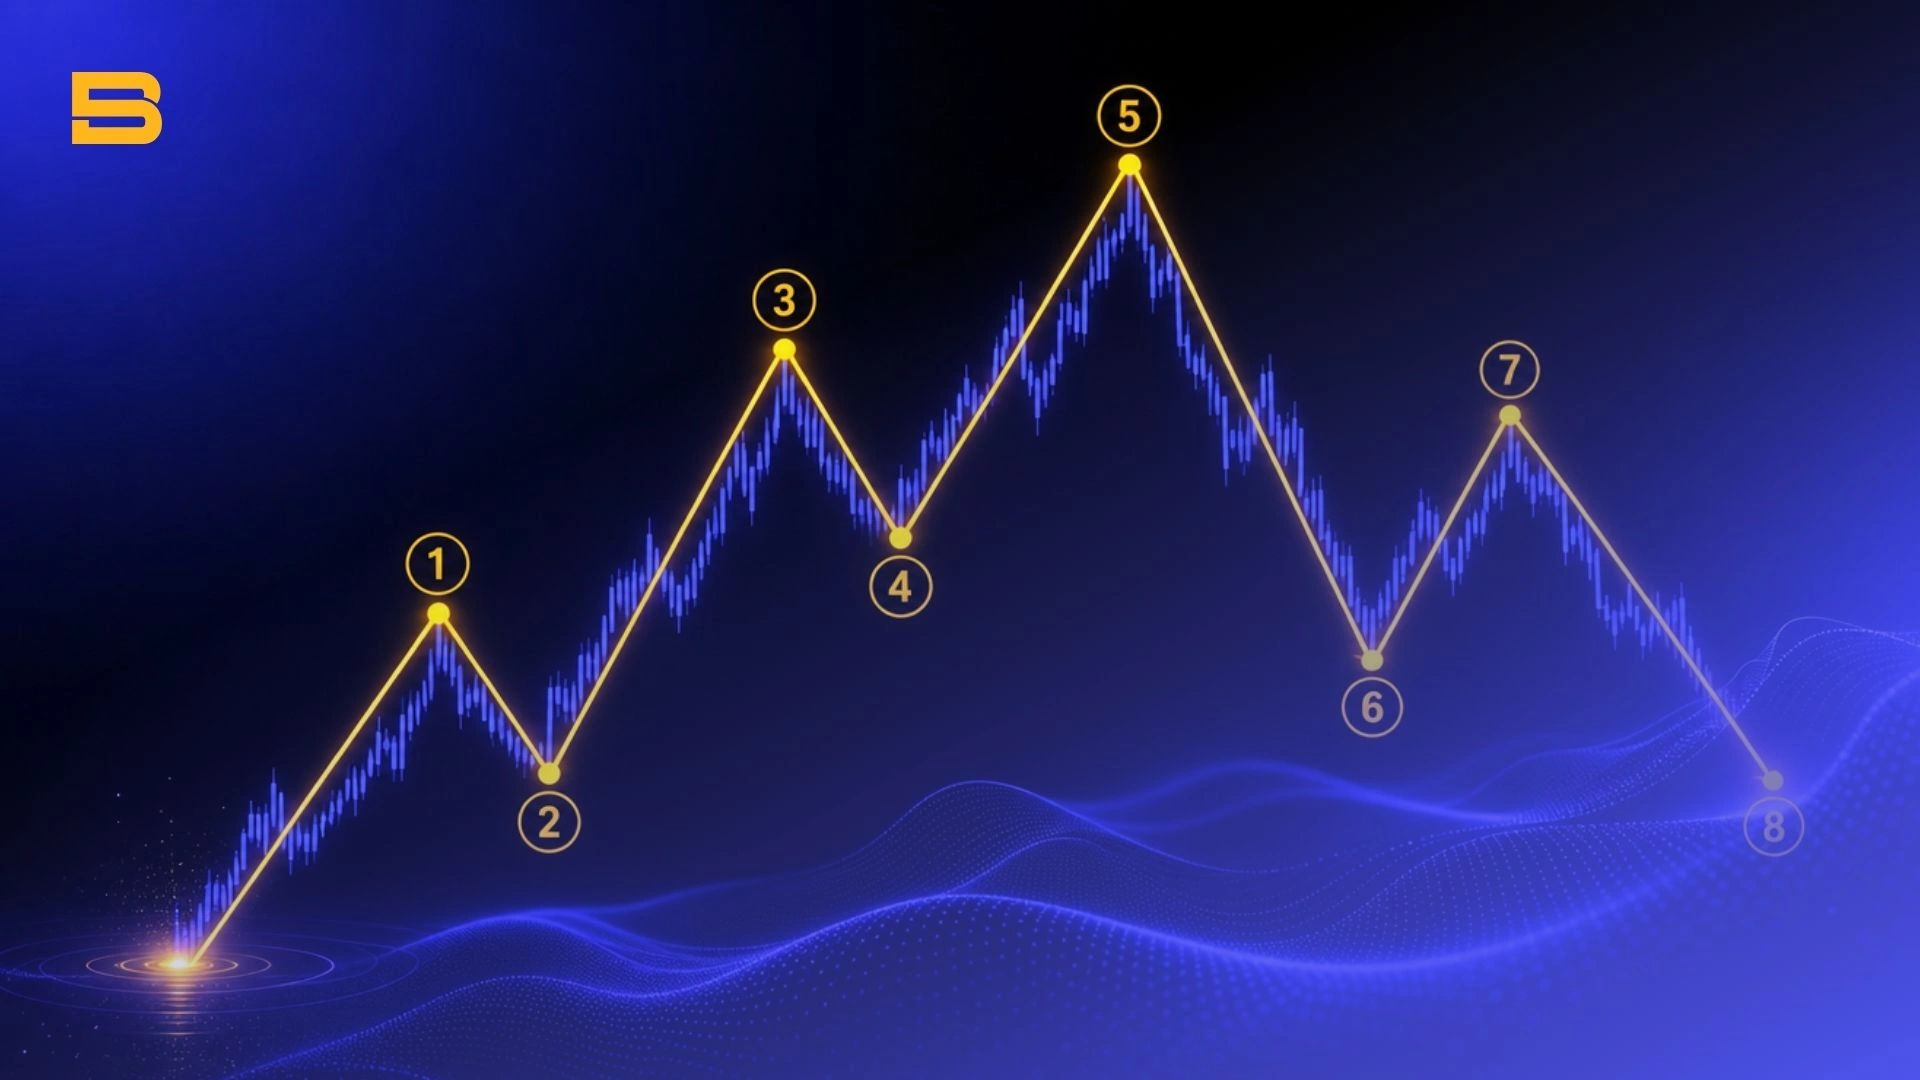
In modern technical analysis, Elliott Wave Theory is used as a framework for interpreting how market prices may develop through recurring wave structures. The basic framework proposes an 8-wave cycle. It consists of a 5-wave motive phase that moves in the direction of the larger trend, followed by a 3-wave corrective phase that moves against or retraces part of that trend. These wave patterns are intended to reflect changes in collective market behavior and investor psychology, as stated by the Chartered Financial Analyst (CFA) Institute.
Impulse Waves vs. Corrective Waves (The 5-3 Structure)
The foundation of Elliott Wave theory rests on distinguishing between impulse and corrective waves. Impulse waves build directional momentum, while corrective waves temporarily digest gains or losses.
The Motive (Impulse) Phase (Waves 1 to 5):
- Wave 1: An initial trend impulse driven by early accumulation.
- Wave 2: A partial retracement as early buyers take profit and late shorts enter.
- Wave 3: The strongest, longest, and most explosive wave, driven by widespread market participation.
- Wave 4: A complex consolidation phase where profit-taking temporarily pauses the trend.
- Wave 5: The final leg of the trend, often driven by retail FOMO and institutional distribution.
The Corrective Phase (Waves A, B, C):
- Wave A: The initial breakdown or bounce against the main trend.
- Wave B: A deceptive counter-trend rally that traps late buyers or sellers.
- Wave C: A decisive continuation of the correction, completing the full cycle.
The Three Inviolable Rules of Wave Structure
While market noise can make wave counting complex, you must never compromise on the three mechanical rules of wave structure. If a single one of these rules is broken, your wave count is immediately invalidated and must be discarded:
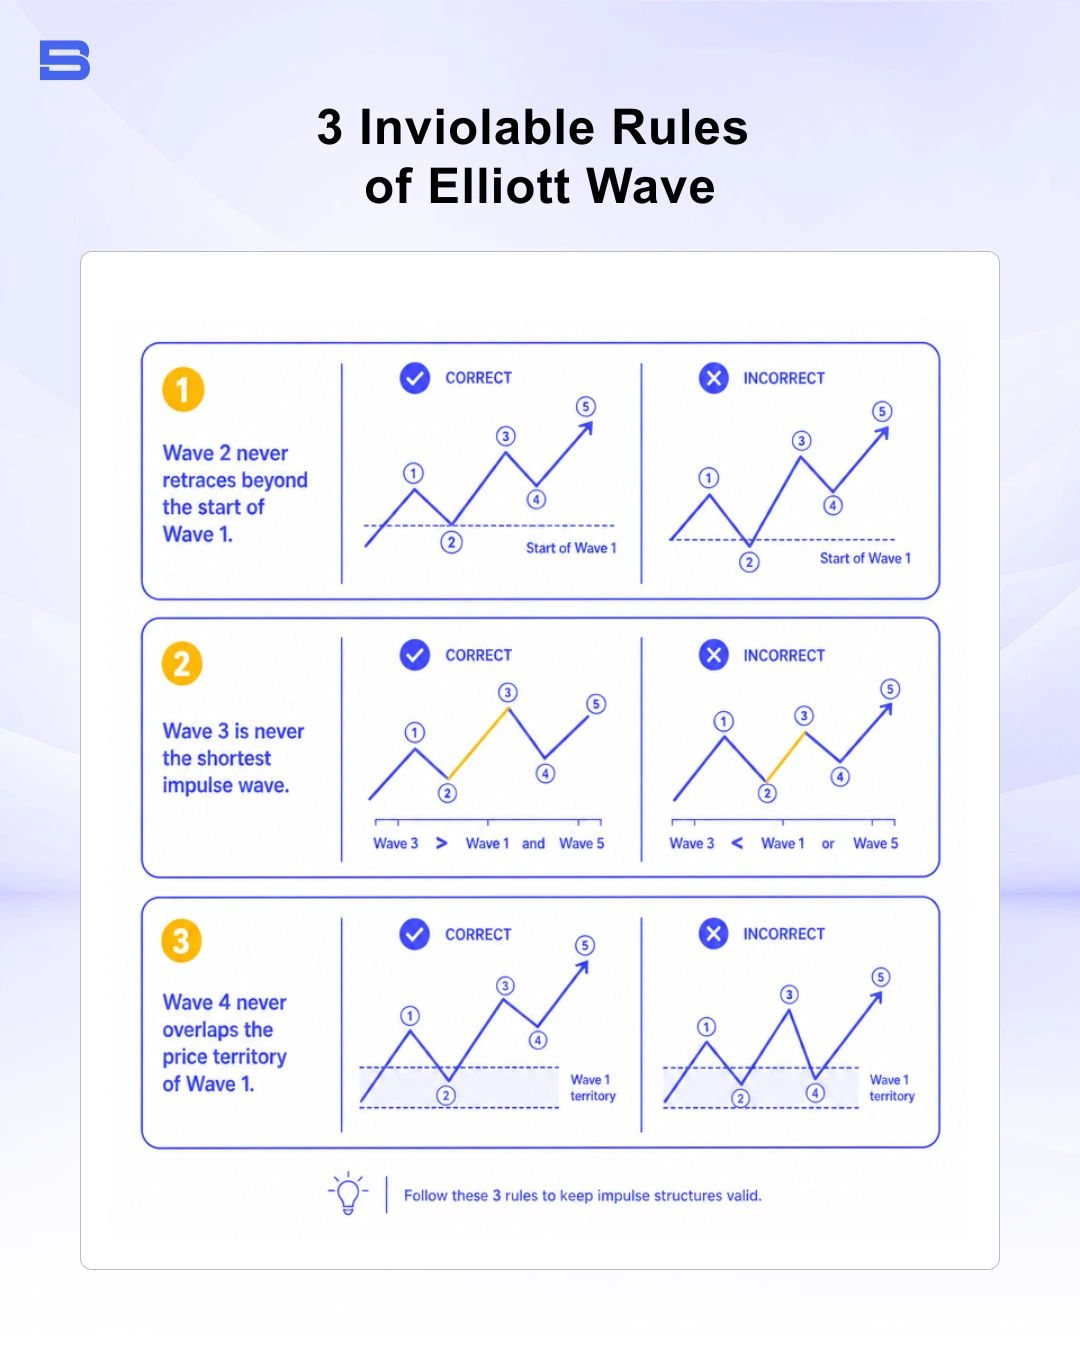
- Rule 1: Wave 2 can never retrace more than 100% of Wave 1. (Price cannot move beyond the starting point of Wave 1).
- Rule 2: Wave 3 is never the shortest among the three motive waves (Waves 1, 3, and 5).
- Rule 3: Wave 4 can never enter the price territory of Wave 1 in a standard impulse wave.
Combining Elliott Wave Analysis with Fibonacci Retracement Levels
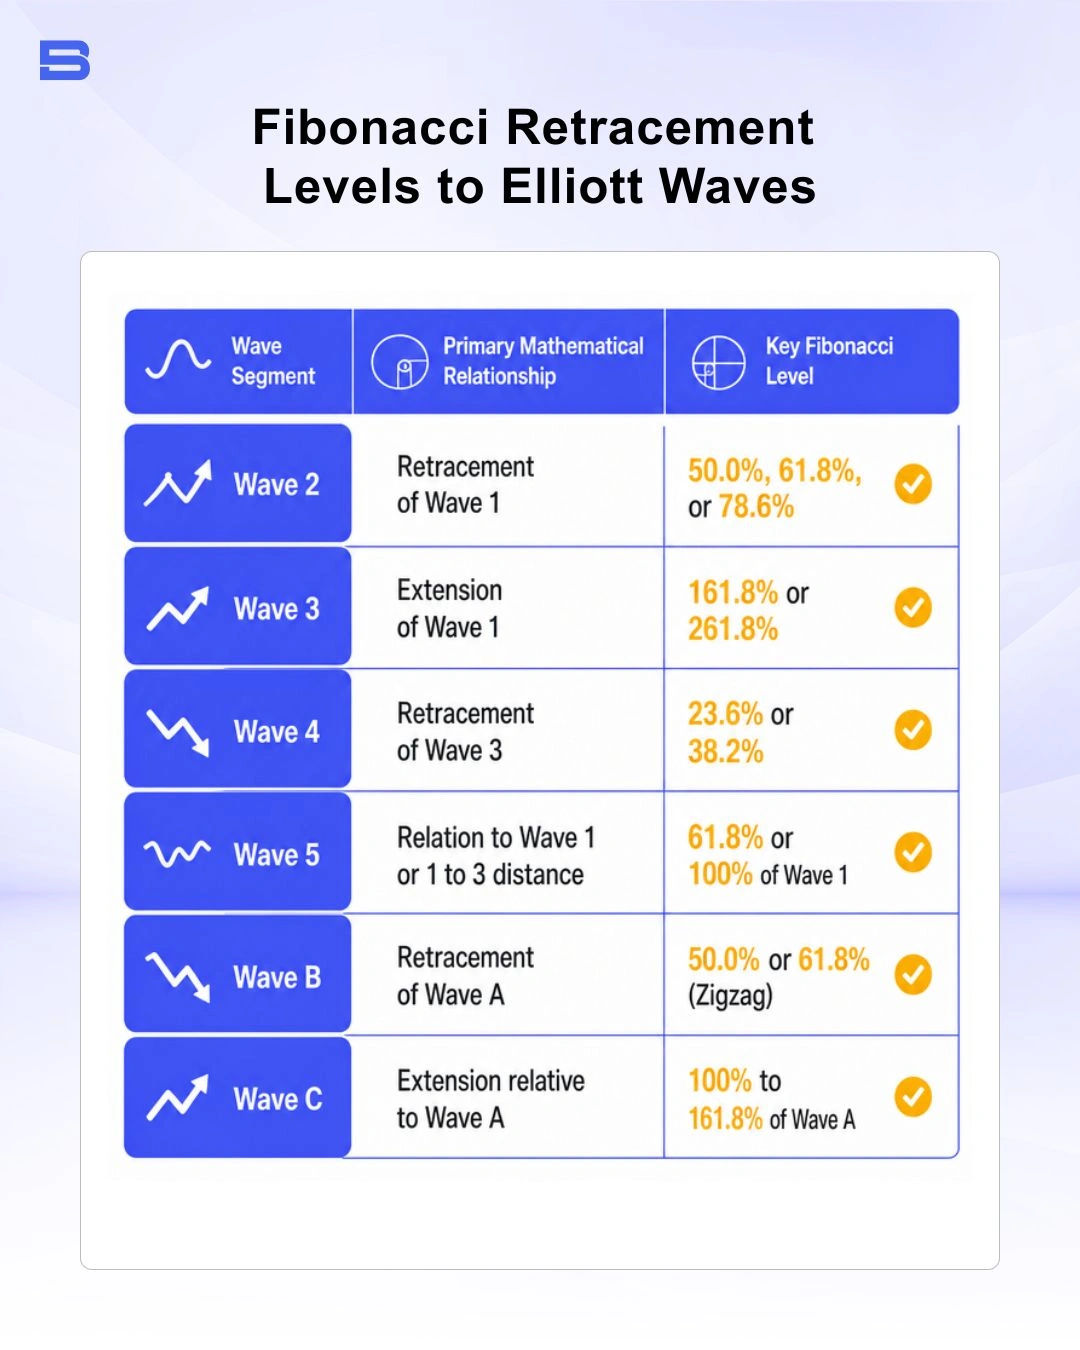
A wave count gives you structural direction, but pairing it with Fibonacci retracement and extension levels gives you precise execution targets. Because crowd psychology turns at predictable mathematical ratios, waves frequently terminate near key Fibonacci zones.
Worked Example: Applying Fibonacci to a Wave 2 Retracement
Asset A breaks out from $100 to $150 (Wave 1, a $50 gain). Wave 2 begins pulling back. Instead of guessing where Wave 2 ends, you draw a Fibonacci retracement from $100 to $150. A standard Wave 2 typically retraces between 50% ($125) and 61.8% ($119.10).
If price action holds the $119.10 support level, you enter a long position. To target Wave 3, project a 161.8% Fibonacci extension of Wave 1 ($50 × 1.618 = $80.90) from the Wave 2 low ($119.10), giving an objective profit-taking target at $200.00.
Risk Management: Setting Wave Invalidation Levels
The true power of Elliott Wave theory is not predictive forecasting—it is providing clear, objective wave invalidation levels. Every trade hypothesis requires a level where you accept you are wrong, making stop-loss placement mechanical rather than emotional.
For instance, if you identify a setup as a Wave 2 retracement, your stop-loss order belongs directly below the origin of Wave 1. Because Rule 1 states Wave 2 cannot retrace past 100% of Wave 1, any price print below that level explicitly invalidates your count.
Using clear invalidation levels allows you to calculate exact risk-reward ratios. If your entry risk is $5 per share (distance to the Wave 1 start) and your Wave 3 target offers $20 per share (161.8% extension), your trade setup delivers an asymmetric 1:4 risk-to-reward ratio. If the market breaks the invalidation point, you exit immediately with a controlled loss and re-evaluate alternate counts.
Reality Check: Accuracy, Subjectivity, and Trading Limitations
When asking how accurate is Elliott Wave theory, you must recognize its major drawback: subjectivity. In real-time trading, five analysts looking at the same daily chart can produce five different valid wave counts. Hindsight bias makes past charts look obvious, but forward-looking wave counting is inherently probabilistic.
To reduce subjectivity, never trade Elliott Wave counts in isolation. Combine your counts with momentum indicators like the Relative Strength Index (RSI) or Moving Average Convergence Divergence (MACD) indicator to confirm wave characteristics (such as momentum divergence during Wave 5). Relying on wave structure for context and technical indicators for confirmation builds a far more resilient trading approach.
The Bottom Line
Elliott Wave theory provides a structured lens to interpret market cycles, helping you separate temporary market noise from true trend developments. However, counting waves is an evolving hypothesis, not a flawless crystal ball. By combining core wave mechanics with Fibonacci projections, confirming indicators, and strict invalidation levels, you can transform wave counts into a disciplined, high-probability risk management framework.
- How to Build an Investment Plan That Actually Works for You?
- What Is the MACD Indicator and How to Use It
- What Is a Wedge Pattern in Trading?
- What Is Ichimoku Cloud Strategy? A Complete Trading System
- Mastering Elliott Wave Theory: Rules and Trading Strategies
- News Trading: Strategies, Execution Risks, and Risk Control
- What Is an Iron Condor Options Strategy?
- Backtesting Explained: What It Is and Why It Really Matters
- Grid Trading: Mechanics, Parameters, and Risk Strategies
- What Is Breakout Trading and How Does It Work?
- Mean Reversion: Technical Strategies and Risk Frameworks
- Momentum Trading: Indicators, Strategies, and Risk Control
- Hammer Candlestick: Structure, Meaning, and Strategy
- Doji Candlestick: Types, Signals, and Trading Strategies
- What Is the Sharpe Ratio and How to Calculate It
- What Is VWAP and How Do Traders Use It?
- Trade the Ascending Triangle: A Step-by-Step Practical Guide
- What Is the Stochastic Oscillator and How to Use It
- How to Trade the Descending Triangle Pattern
- High Frequency Trading: Speed, Algorithms, and Market Impact
- What Is Volume Profile and How to Use It in Trading
- What Is a Morning Star Pattern Candlestick?
- Trade with Parabolic SAR: A Practical Analysis Guide
- Evening Star Pattern: Structure, Rules, and Risk Controls
- Kelly Criterion: Formula, Position Sizing, and Risk
- What Is the NYSE Minimum Trading Price? Rules Explained
Disclaimer: The content on this page is intended for educational and informational purposes only. It does not constitute financial, investment, tax, or legal advice, and should not be interpreted as a recommendation to buy, sell, or hold any financial instrument or asset. Trading and investing involve significant risk, including the possible loss of your entire capital. Products such as forex, CFDs, and cryptocurrencies carry additional risks due to leverage, high volatility, and limited regulatory protection in some jurisdictions. Past performance of any financial instrument does not guarantee future results. Any market views, forecasts, or opinions expressed are those of the author at the time of writing and may not reflect current market conditions. Platform features, fees, and regulatory status are subject to change — always verify information directly with the relevant provider or regulator before making any financial decision. BrokerSpecs may receive compensation from third parties featured on this site. Always conduct your own due diligence and consider seeking advice from a licensed financial professional before investing. Portions of this article were prepared with the assistance of AI tools and reviewed by our editorial team before publication.