


Related Tags
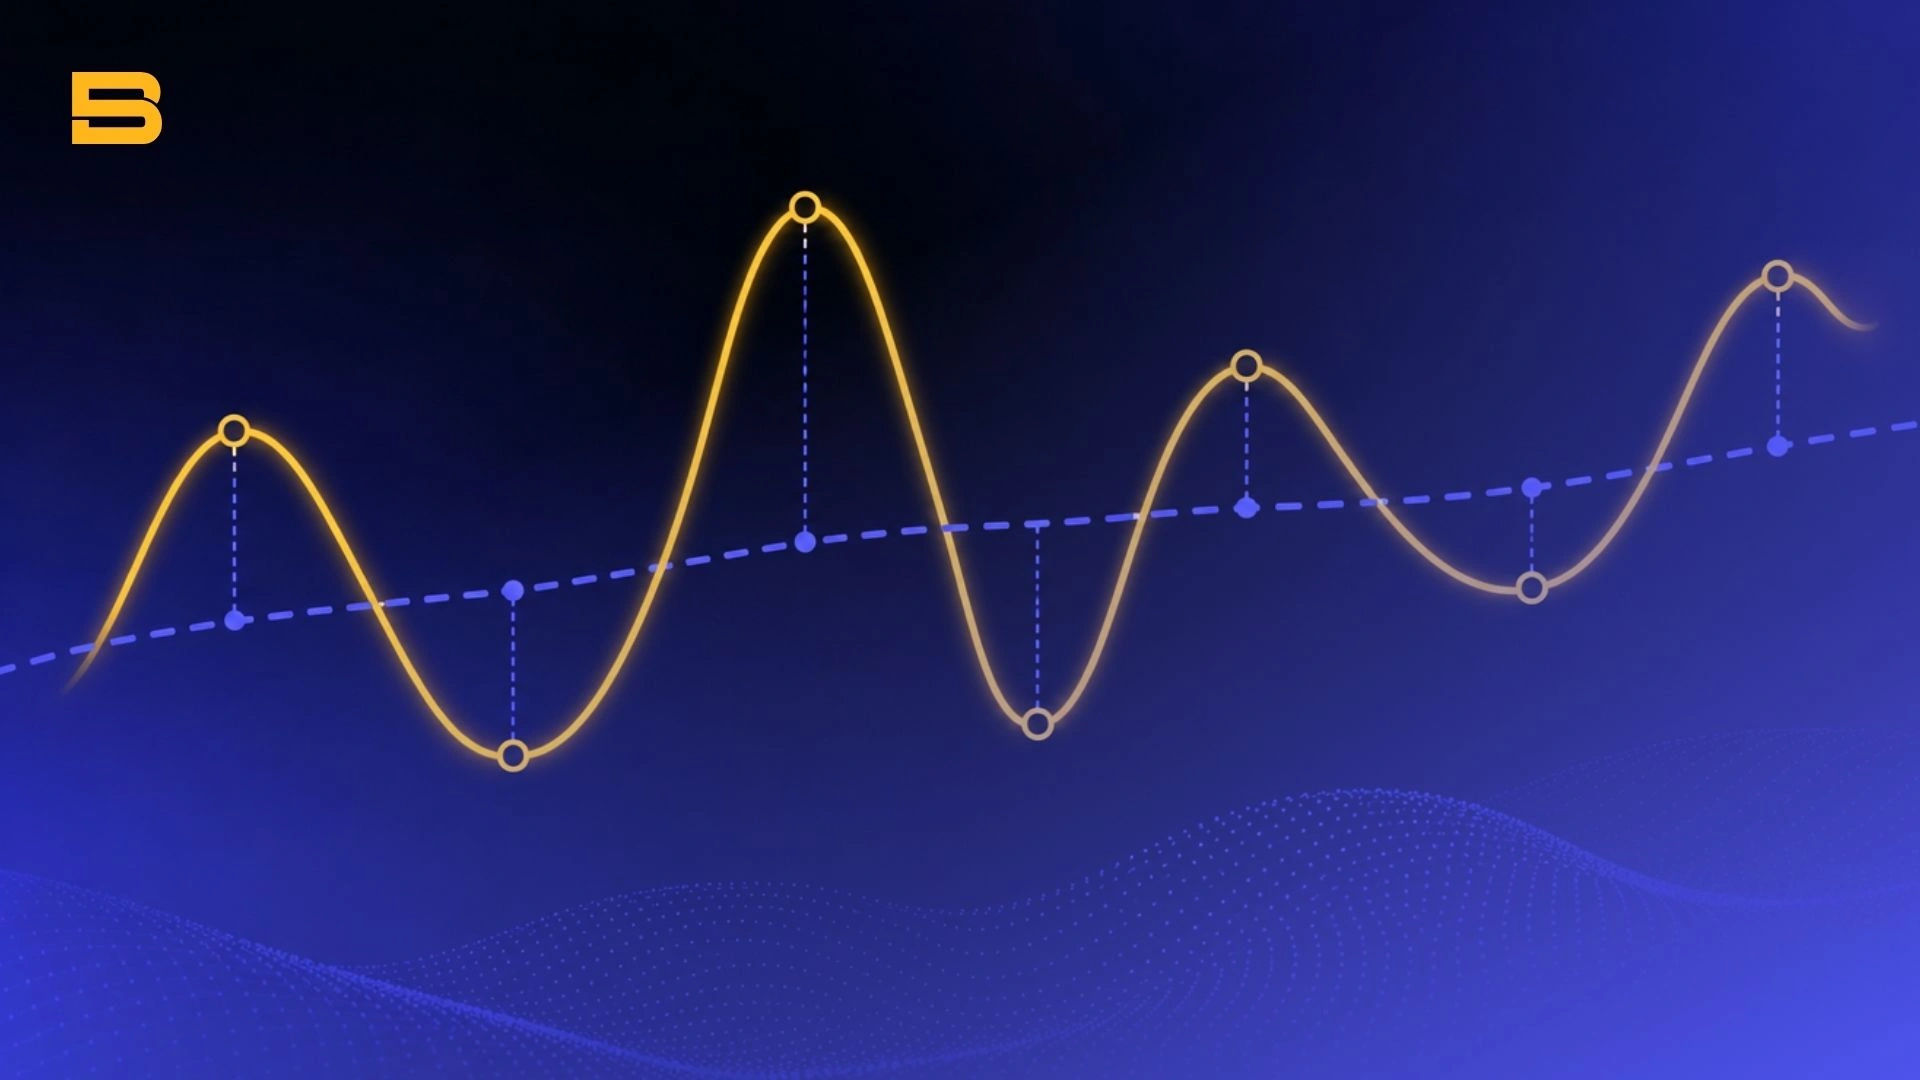
Picture an asset price surging past its daily range after an aggressive breakout. It feels tempting to jump in and ride the momentum. However, statistical reality often asserts itself, and the price snaps back toward its historical baseline like an overstretched rubber band.
Learning to identify these statistical overextensions gives traders a structural framework to capitalize on temporary price extremes rather than falling into the trap of late-stage momentum moves.
What Is Mean Reversion in Trading?
This theory suggests that asset price volatility and historical returns eventually return to their long-term average or mean baseline. This statistical property rests on the concept that price extremes driven by irrational market sentiment, sudden liquidity imbalances, or overextended news events are temporary. Over time, the fundamental forces of supply and demand pull market valuations back toward an equilibrium range.
Market mechanisms naturally drive this reversion through institutional rebalancing and liquidity provision. When prices move too far from fair value, fundamental investors step in to sell overvalued assets or buy discounted ones, bringing prices back toward central moving averages.
However, the primary assumption behind this strategy's setups is that the underlying regime remains stable. In strong, macro-driven markets, the baseline average itself can shift permanently, making blind reversion bets dangerous without strict risk controls.
How Do You Trade Mean Reversion? Core Indicators and Strategies
To trade mean reversion effectively, you must quantitatively define what constitutes an overextended market. Traders rely on statistical indicators to measure how far an asset has deviated from its baseline, taking positions that anticipate a price retracement back toward central levels.
Using Moving Averages as Mean Targets
A simple moving average (SMA) or exponential moving average (EMA) serves as a dynamic baseline representing the average market price over a set lookback period. The 20-day and 50-day moving averages are common central targets for reversion strategies. When price stretches significantly far above or below a simple moving average, you can monitor for price exhaustion to target a move back toward that average line.
Bollinger Band and RSI Mean Reversion Setups
Combining volatility channels with momentum indicators provides explicit parameters for finding extreme price extensions:
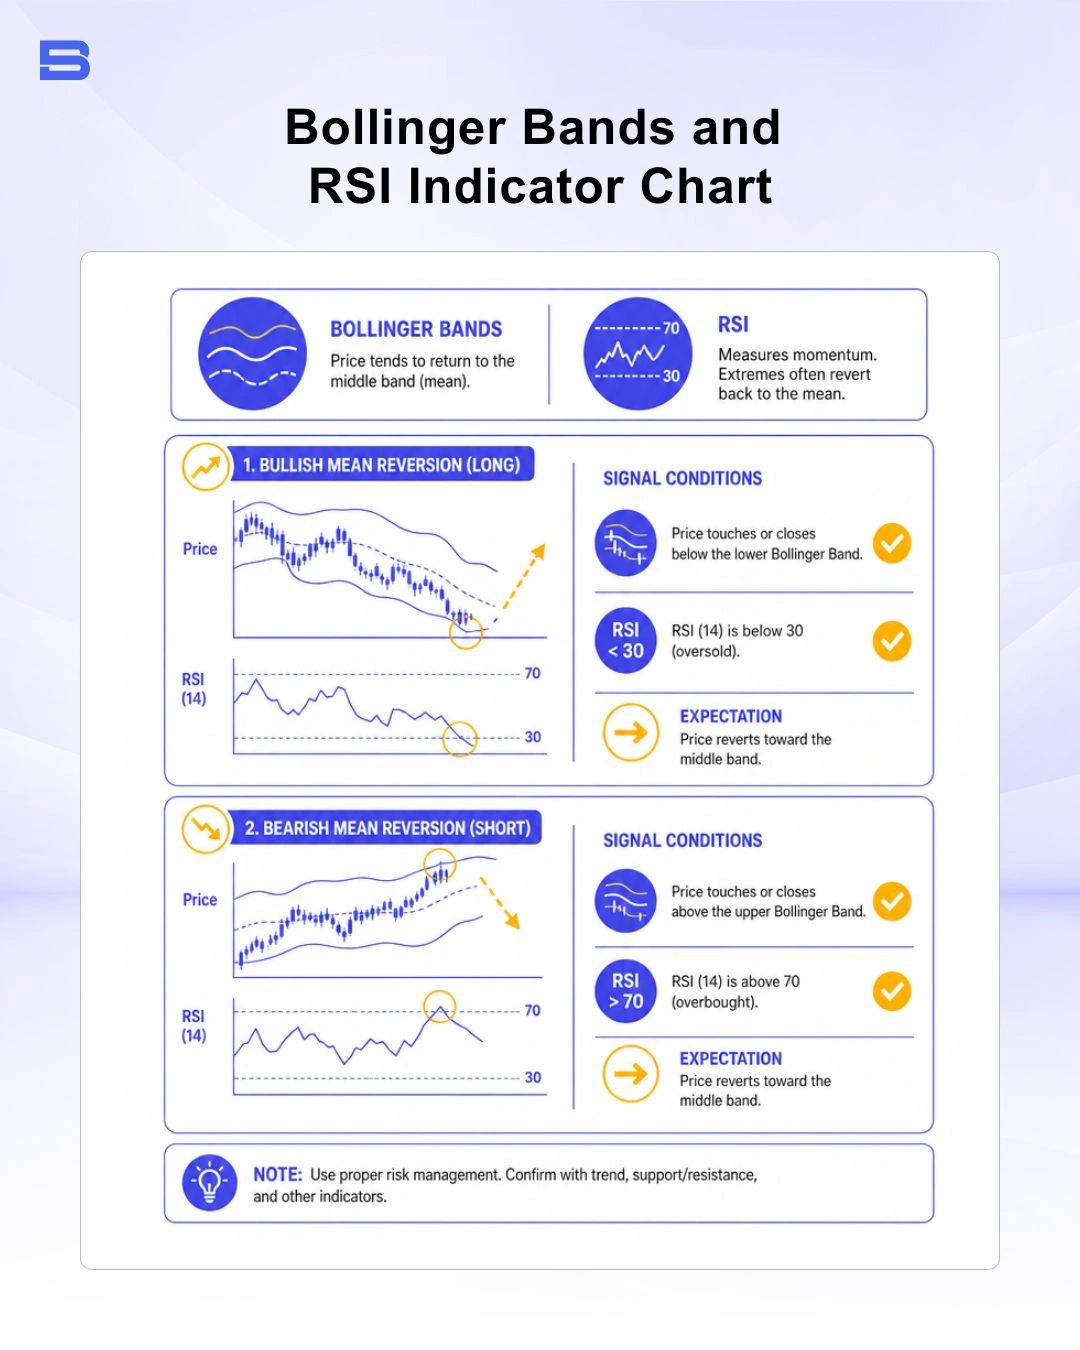
- Bollinger Bands: Composed of a central 20-period simple moving average and two outer bands set at two standard deviations above and below it. Although a normal distribution places roughly 95% of observations within ±2 standard deviations, financial prices are not normally distributed, so Bollinger Bands do not necessarily contain 95% of prices. A move touching or exceeding the outer bands indicates statistical overextension.
- Relative Strength Index (RSI): An oscillator measuring the velocity and magnitude of price movements on a scale from 0 to 100. Combining overbought/oversold indicators—such as RSI readings above 70 or below 30—with outer Bollinger Band touches provides a reinforced trading strategy trigger.
Identifying Reversion Levels with Support and Resistance
Relying on statistical overextension alone can lead to premature entries during strong momentum runs. Pairing standard deviation signals with established horizontal support and resistance levels ensures that you enter trades only where historic buying or selling pressure aligns with technical overextension.
Practical Example of Mean Reversion in Trading
To illustrate how a mean reversion trade works in practice, consider a worked trade setup using a 20-day Simple Moving Average ($100.00) and a standard deviation calculation of $2.00.
Worked Scenario Parameters
- Current Asset Price: $105.00 (Spiked aggressively higher following an earnings announcement)
- 20-day SMA Baseline: $100.00
- Upper Bollinger Band (+2 Standard Deviations): $104.00 ($100 + [2 × $2.00])
- RSI (14-period): 78 (Indicating overbought conditions)
Execution and Risk Setup
- Trade Signal: The asset price at $105.00 sits more than 2.5 standard deviations above its 20-day SMA, breaking above the upper Bollinger Band while the RSI exceeds 70.
- Short Entry: A short position is entered at $104.50 once a 15-minute confirmation candle closes back inside the upper Bollinger Band.
- Stop-Loss Placement: Placed above the recent swing high at $106.50 (Risk = $2.00 per unit).
- Profit Target: Set near the dynamic 20-day SMA baseline at $100.50 (Target Gain = $4.00 per unit).
This setup establishes a structured 1:2 Risk-to-Reward ratio, capitalizing on the statistical likelihood of the price returning toward its 20-day average baseline.
Comparing Mean Reversion with Grid Trading and Trend Following
This strategy is one of several core execution methodologies. Understanding how it differs from momentum-based strategies or automated grid architectures helps you select the appropriate tool for current market conditions.
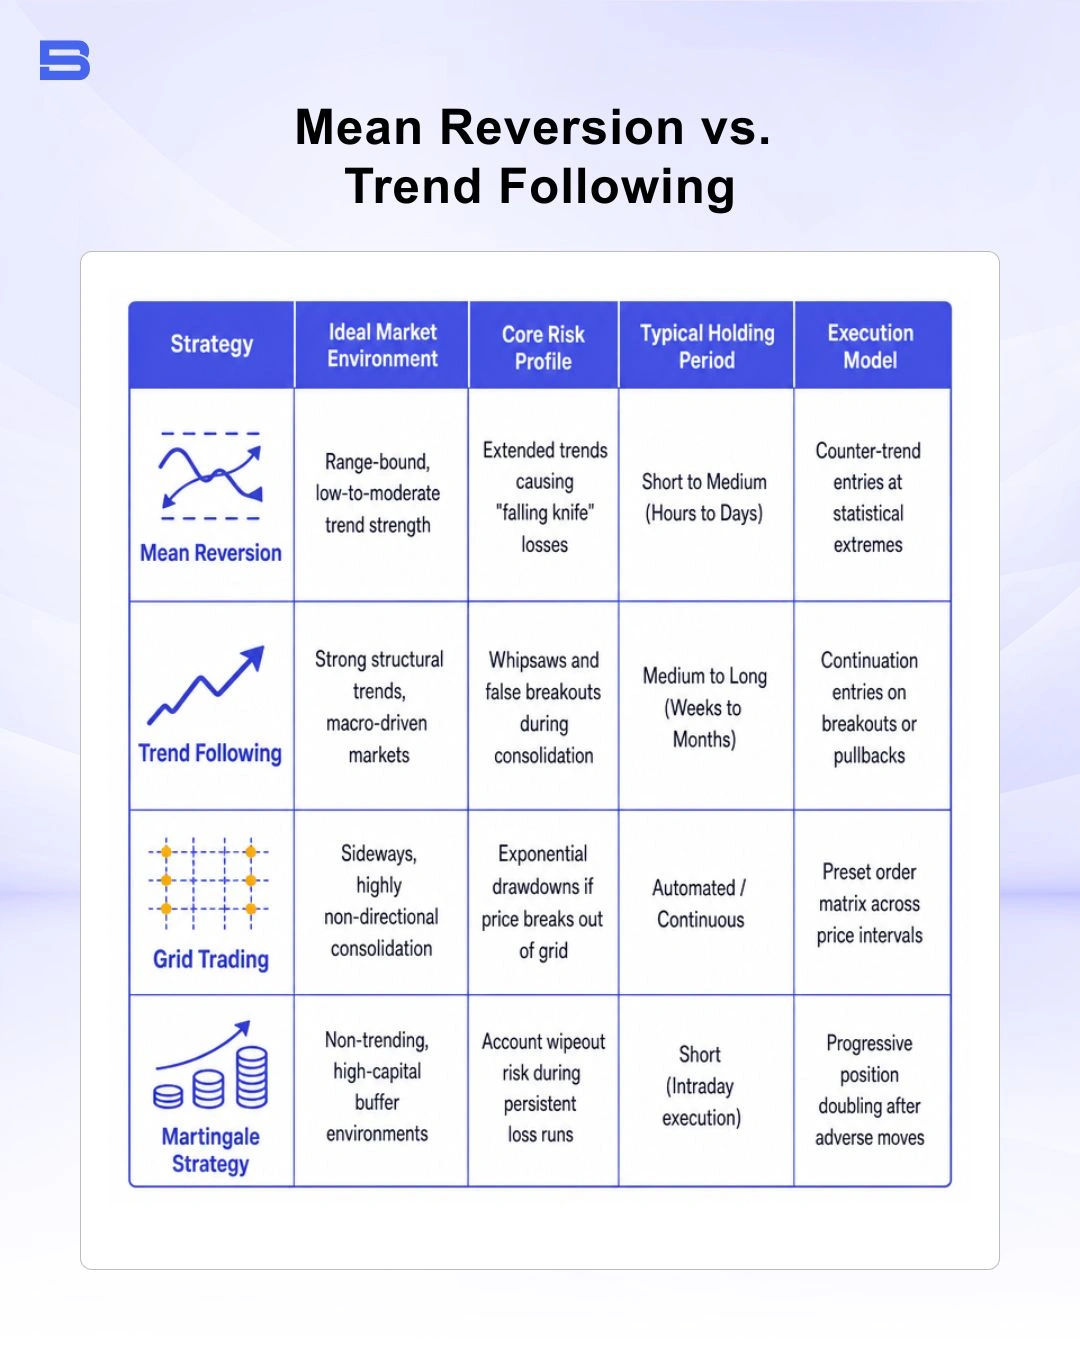
While this approach seeks profits by trading temporary extremes back toward a center, trend following strategies seek to capitalize on sustained price movements in one direction, often using breakout trading methods.
Grid systems place static buy and sell orders at set intervals, and aggressive position-sizing rules like a martingale strategy double trade size after losses—approaches that carry severe structural risks if a market trends persistently without retracing.
If you’re looking to build a balanced portfolio, often combine short-term reversion strategies with longer-term position trading tactics across non-correlated asset classes.
Key Risk Management Rules to Avoid the Falling Knife
The principal failure mode of mean reversion trading is "catching a falling knife"—attempting to buy a collapsing asset or short a surging asset during a structural breakout. When underlying fundamentals shift, historical averages change, and price can continue moving further out of bounds without reverting.
To guard your capital against catastrophic trends, implement these strict risk parameters:
- Mandatory Stop-Loss Orders: Always define a strict stop-loss beyond recent market structure highs or lows. Never allow a counter-trend trade to turn into an unmanaged long-term drawdown.
- Wait for Price Confirmation: Avoid placing limit orders at outer technical boundaries. Wait for a reversal candlestick structure or momentum divergence before opening a position.
- Position Sizing Limits: Cap single-trade risk to a fraction of overall account equity. Counter-trend entries inherently suffer from lower win rates during strong macro cycles.
- Automated Risk Execution: Many institutional traders use automated risk limits or review execution strategies through copy trading platforms to enforce disciplined stop rules automatically.
Conclusion
Mean reversion trading is built on the principle that prices may move back toward their historical average after reaching extreme levels. Technical tools such as Bollinger Bands, RSI, moving averages, and volatility measures can help you identify potential mean-reversion opportunities, but no indicator guarantees a reversal.
Effective execution requires more than identifying overbought or oversold conditions. You should consider market regime, volatility, position sizing, stop-loss placement, and liquidity before entering a trade. Strong trends can keep prices away from their mean for extended periods, making risk management essential.
Ultimately, a disciplined mean reversion strategy combines technical confirmation with clearly defined entry and exit rules and controlled risk. Backtesting the approach across different market conditions can help determine whether the strategy has a sustainable edge before applying it to live trading.
- How to Build an Investment Plan That Actually Works for You?
- What Is the MACD Indicator and How to Use It
- What Is a Wedge Pattern in Trading?
- What Is Ichimoku Cloud Strategy? A Complete Trading System
- Mastering Elliott Wave Theory: Rules and Trading Strategies
- News Trading: Strategies, Execution Risks, and Risk Control
- What Is an Iron Condor Options Strategy?
- Backtesting Explained: What It Is and Why It Really Matters
- Grid Trading: Mechanics, Parameters, and Risk Strategies
- What Is Breakout Trading and How Does It Work?
- Mean Reversion: Technical Strategies and Risk Frameworks
- Momentum Trading: Indicators, Strategies, and Risk Control
- Hammer Candlestick: Structure, Meaning, and Strategy
- Doji Candlestick: Types, Signals, and Trading Strategies
- What Is the Sharpe Ratio and How to Calculate It
- What Is VWAP and How Do Traders Use It?
- Trade the Ascending Triangle: A Step-by-Step Practical Guide
- What Is the Stochastic Oscillator and How to Use It
- How to Trade the Descending Triangle Pattern
- High Frequency Trading: Speed, Algorithms, and Market Impact
- What Is Volume Profile and How to Use It in Trading
- What Is a Morning Star Pattern Candlestick?
- Trade with Parabolic SAR: A Practical Analysis Guide
- Evening Star Pattern: Structure, Rules, and Risk Controls
- Kelly Criterion: Formula, Position Sizing, and Risk
- What Is the NYSE Minimum Trading Price? Rules Explained
Disclaimer: The content on this page is intended for educational and informational purposes only. It does not constitute financial, investment, tax, or legal advice, and should not be interpreted as a recommendation to buy, sell, or hold any financial instrument or asset. Trading and investing involve significant risk, including the possible loss of your entire capital. Products such as forex, CFDs, and cryptocurrencies carry additional risks due to leverage, high volatility, and limited regulatory protection in some jurisdictions. Past performance of any financial instrument does not guarantee future results. Any market views, forecasts, or opinions expressed are those of the author at the time of writing and may not reflect current market conditions. Platform features, fees, and regulatory status are subject to change — always verify information directly with the relevant provider or regulator before making any financial decision. BrokerSpecs may receive compensation from third parties featured on this site. Always conduct your own due diligence and consider seeking advice from a licensed financial professional before investing. Portions of this article were prepared with the assistance of AI tools and reviewed by our editorial team before publication.