



Related Tags
Entering a market just as momentum shifts can feel like catching a powerful wave right as it breaks. Breakout trading is a tactical approach centered on identifying when an asset's price is constrained within a clear technical range. It positions you to trade the explosive movement that occurs once price finally pierces those boundaries.
To trade breakouts effectively, you must understand how market consolidation leads to rapid price expansion, how to confirm real market participation, and how to manage risk when momentum fails.
Breakout Trading Explained: The Core Mechanics
Breakout trading is an execution strategy designed to enter a position when an asset's price moves beyond a defined level of support and resistance with increased volume. When prices consolidate within a tight range, buying and selling pressure builds up like a compressed spring. Once the boundary gives way, price often moves aggressively in the direction of the breach as trapped traders exit and momentum traders join.
Consider a currency pair or stock trading between a support boundary of $100 and a resistance ceiling of $105 over several weeks. During this consolidation, market participation typically contracts. If buyers absorb all available supply at $105 and push the candle close to $106.50 on volume that is 1.5 to 2 times the 20-period average, a valid bullish breakout has occurred. The trader enters a long position expecting the price expansion to continue.
Identifying Support and Resistance Levels for Breakouts
Accurate boundary identification forms the foundation of every breakout trade. Support represents a price level where buying demand historically prevents further declines, while resistance is a ceiling where selling pressure halts moves upward.
Traders identify these levels through horizontal price channels, sloping trendlines, or established chart patterns such as triangles and rectangles. To draw reliable levels, connect at least two to three distinct price touches on your chart. The clearer and more widely observed a technical level is, the greater the volume interest when price breaks through.
How Do You Identify a Breakout?
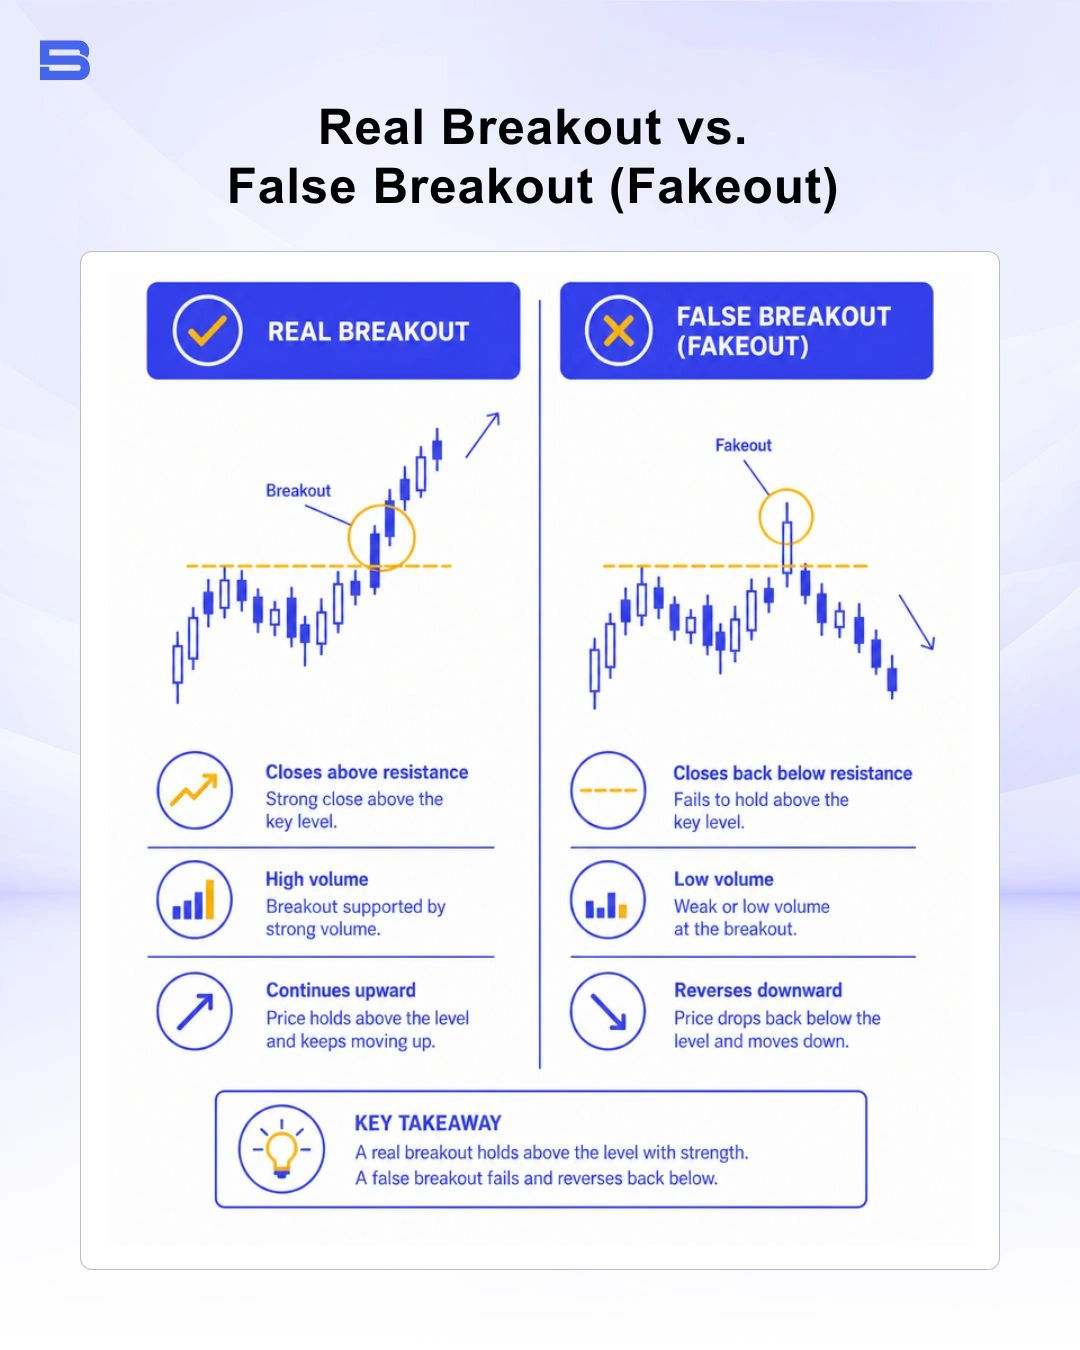
Identifying a true breakout requires looking beyond a brief price spike across a technical line. Validating a setup involves checking structural candle Closes, volume expansion, and market context.
Standard market guidelines from regulatory institutions like the Securities Commission Malaysia (SC) emphasize the importance of systematic execution over emotional impulse, especially in volatile conditions.
Technical Indicators to Confirm Breakout Strength
Technical indicators serve as secondary filters to verify whether a price push has real institutional backing.
- Volume Indicators: A sudden spike in volume confirms that institutional participants are committing capital to the move.
- Volatility Bands: Indicators like Bollinger Bands contract during low-volatility consolidation; an expansion of the bands confirms a transition into a volatility breakout.
- Moving Averages: Aligning breakouts with short-term moving average direction ensures you trade in harmony with the broader momentum trend.
How to Identify and Avoid a False Breakout
A false breakout (or fakeout) occurs when price temporarily breaks a key level but immediately lacks follow-through, reversing back into the previous consolidation range. Fakeouts often happen when institutional market makers seek liquidity above key highs or below obvious lows.
To avoid falling for fakeouts, wait for a full timeframe candle to close beyond the level rather than placing market orders on intra-candle spikes. Alternatively, wait for a breakout-and-retest setup, where price briefly retests the broken boundary (now acting as new support or resistance) before resuming its new trajectory.
Range Trading vs. Breakout Trading: Key Differences
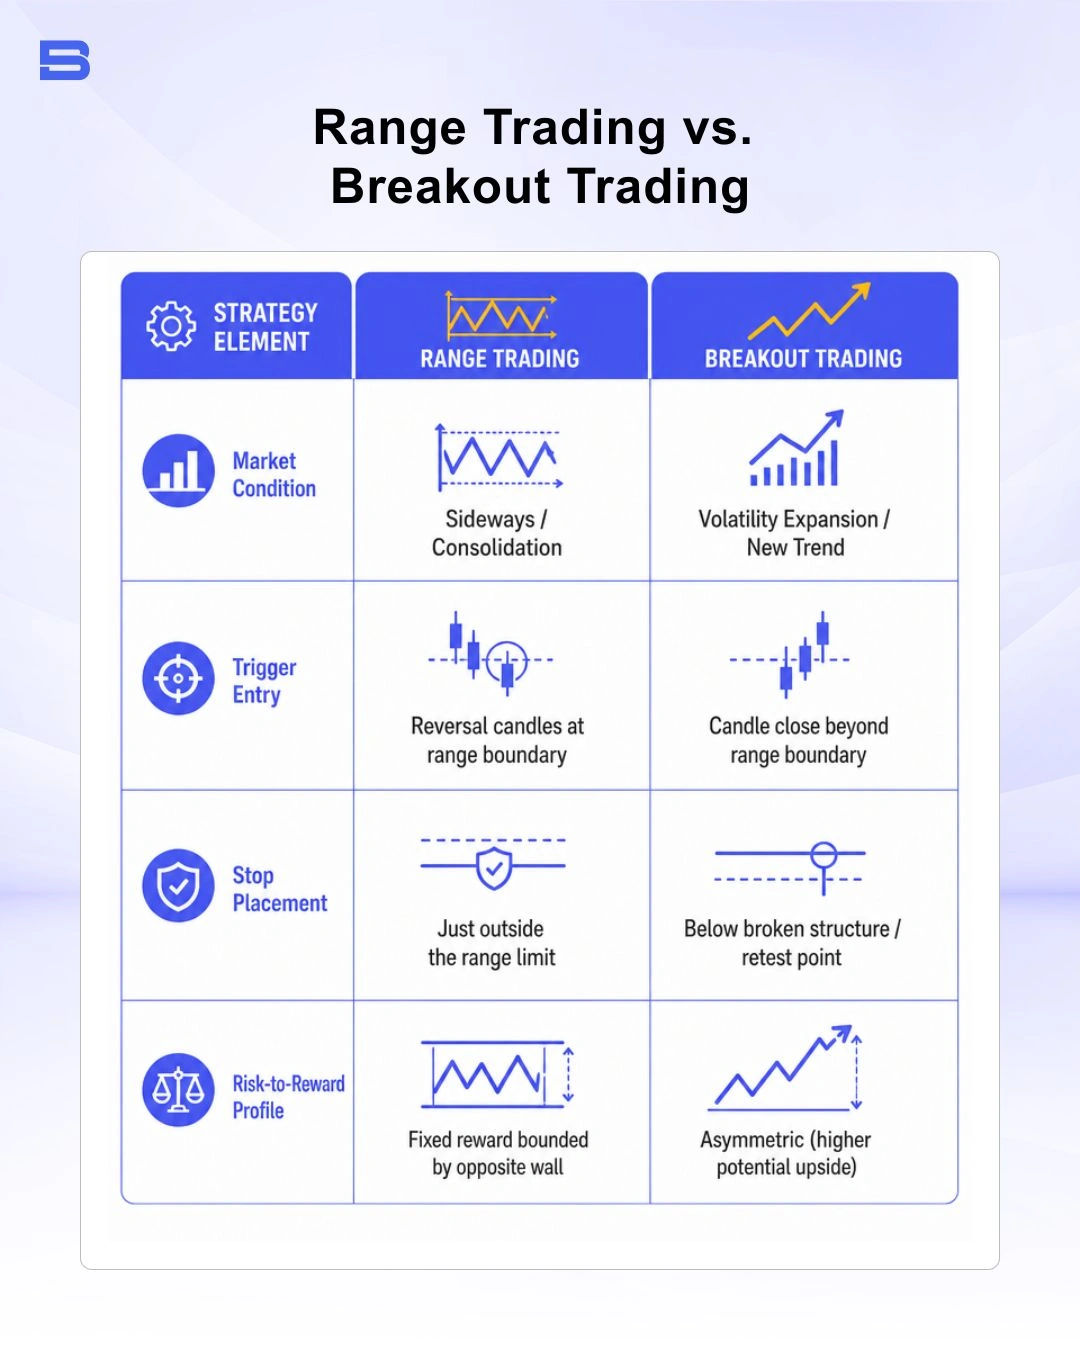
While range trading profits from price bouncing back and forth between established upper and lower boundaries using mean reversion techniques, breakout trading explicitly bets on those boundaries failing. Related approaches like pairs trading—trading the price relationship between two correlated assets—also rely on price reverting to historical statistical means.
How Breakout Trading Relates to Momentum Trading
Breakout trading is closely linked to momentum trading because the catalyst for a breakout is a surge in price velocity. When price breaks through a major consolidation area, trader psychology shifts rapidly. Short sellers are forced to buy back positions to cover losses, while sidelined buyers rush in out of fear of missing the trend.
This combined buying interest accelerates market sentiment and transforms a simple structural breach into a sustained, high-velocity trend continuation.
Comparing Breakout Trading to Position Trading
Different trading styles rely on varied execution timeframes and holding horizons. Understanding where breakout execution sits relative to long-term position trading helps you align setups with your personal trading schedule.
- Day Trading: Day trading involves opening and closing breakout trades within the same session to avoid overnight risk.
- Swing Trading: Swing trading targets multi-day breakouts, seeking to capture the multi-candle expansion phase following range failure.
- Position Trading: Position trading applies breakout logic to weekly or monthly charts, holding assets over months to capture major macro-driven structural shifts.
Risk Management and Position Sizing for Breakout Setups
Because false breakouts are a natural cost of trading this strategy, proper risk management is vital. Professional standards set by organizations like the CFA Institute emphasize that long-term survival in technical execution depends heavily on controlled position sizing and defined stop-loss parameters.
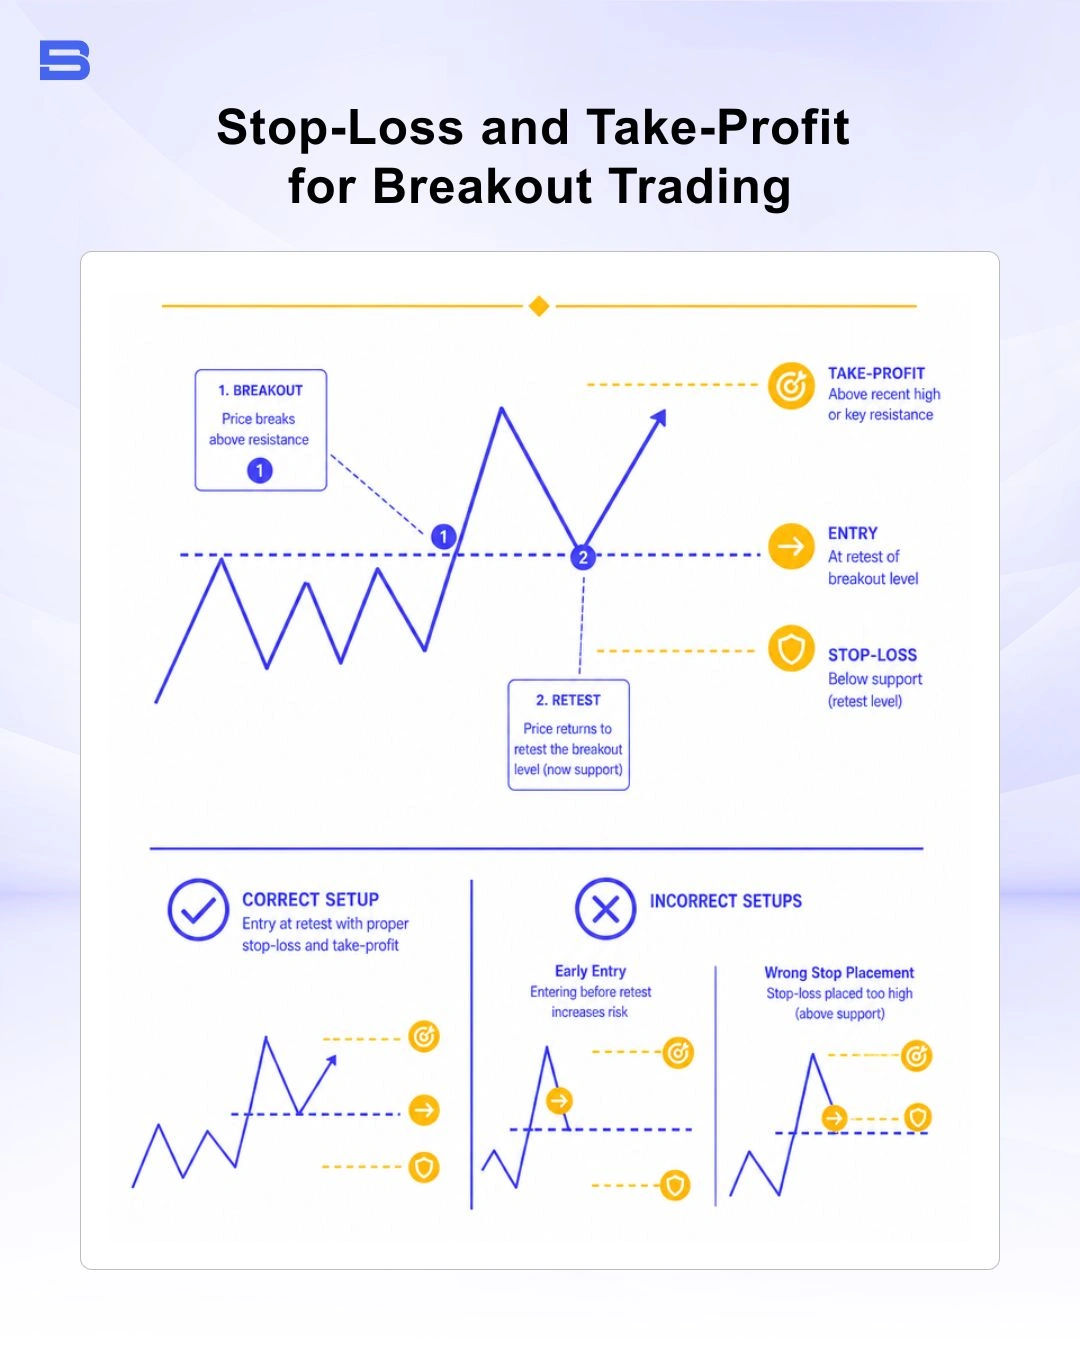
Stop-Loss Placement: Place your stop-loss just inside the broken structure or below the low of the breakout candle. If price slips back deep into the range, the premise of the breakout is invalidated.
- Position Sizing: Never escalate position sizes to recover losses from fakeouts—avoiding aggressive scaling techniques, such as a martingale strategy (doubling your stake after every loss), is critical to preserving capital.
- Risk-to-Reward Ratio: Aim for a minimum 1:2 or 1:3 risk-to-reward ratio to ensure that profitable trades comfortably cover failed breakouts. For instance, risking $200 on a trade should aim for a $400 to $600 gain.
Key Takeaways for Trading Breakouts Successfully
Mastering breakout trading requires patience to wait for clear structural consolidation and the discipline to verify entries with volume and candle closes. By managing downside risk through strategic stop placement and fixed position sizing, you can consistently capitalize on market momentum shifts while protecting your capital.
- How to Build an Investment Plan That Actually Works for You?
- What Is the MACD Indicator and How to Use It
- What Is a Wedge Pattern in Trading?
- What Is Ichimoku Cloud Strategy? A Complete Trading System
- Mastering Elliott Wave Theory: Rules and Trading Strategies
- News Trading: Strategies, Execution Risks, and Risk Control
- What Is an Iron Condor Options Strategy?
- Backtesting Explained: What It Is and Why It Really Matters
- Grid Trading: Mechanics, Parameters, and Risk Strategies
- What Is Breakout Trading and How Does It Work?
- Mean Reversion: Technical Strategies and Risk Frameworks
- Momentum Trading: Indicators, Strategies, and Risk Control
- Hammer Candlestick: Structure, Meaning, and Strategy
- Doji Candlestick: Types, Signals, and Trading Strategies
- What Is the Sharpe Ratio and How to Calculate It
- What Is VWAP and How Do Traders Use It?
- Trade the Ascending Triangle: A Step-by-Step Practical Guide
- What Is the Stochastic Oscillator and How to Use It
- How to Trade the Descending Triangle Pattern
- High Frequency Trading: Speed, Algorithms, and Market Impact
- What Is Volume Profile and How to Use It in Trading
- What Is a Morning Star Pattern Candlestick?
- Trade with Parabolic SAR: A Practical Analysis Guide
- Evening Star Pattern: Structure, Rules, and Risk Controls
- Kelly Criterion: Formula, Position Sizing, and Risk
- What Is the NYSE Minimum Trading Price? Rules Explained
Disclaimer: The content on this page is intended for educational and informational purposes only. It does not constitute financial, investment, tax, or legal advice, and should not be interpreted as a recommendation to buy, sell, or hold any financial instrument or asset. Trading and investing involve significant risk, including the possible loss of your entire capital. Products such as forex, CFDs, and cryptocurrencies carry additional risks due to leverage, high volatility, and limited regulatory protection in some jurisdictions. Past performance of any financial instrument does not guarantee future results. Any market views, forecasts, or opinions expressed are those of the author at the time of writing and may not reflect current market conditions. Platform features, fees, and regulatory status are subject to change — always verify information directly with the relevant provider or regulator before making any financial decision. BrokerSpecs may receive compensation from third parties featured on this site. Always conduct your own due diligence and consider seeking advice from a licensed financial professional before investing. Portions of this article were prepared with the assistance of AI tools and reviewed by our editorial team before publication.