


Related Tags
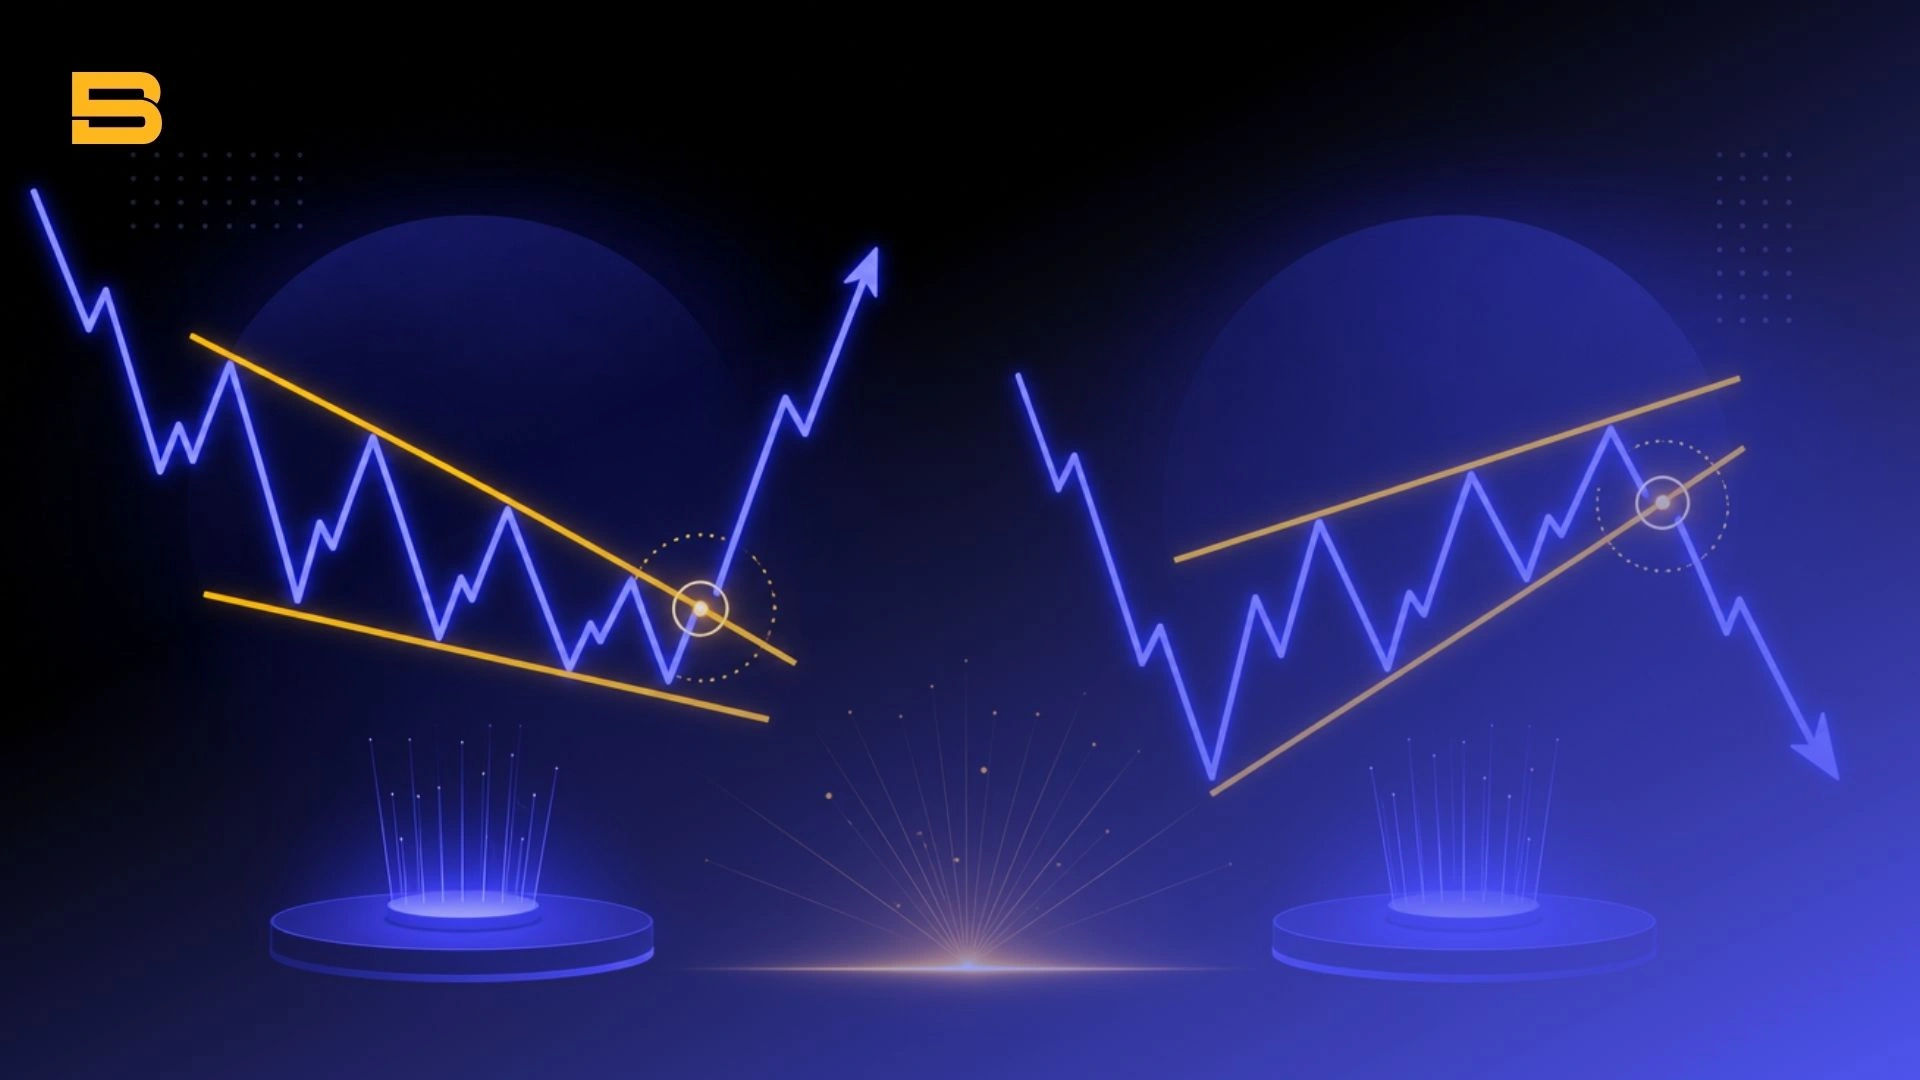
Imagine sitting in front of your trading terminal, watching price swings shrink into an increasingly narrow squeeze. The market's rhythm slows down, volatility dies off, and price gets pinned between two converging trendlines. You know an explosive move is brewing—you just need to know which way the dam will break.
This coiled spring setup is the classic wedge pattern. Used by technical traders across forex, stocks, and crypto markets, wedges offer a structured way to identify when a trend is losing steam or getting ready to launch its next major leg.
What Is a Wedge Pattern in Trading?
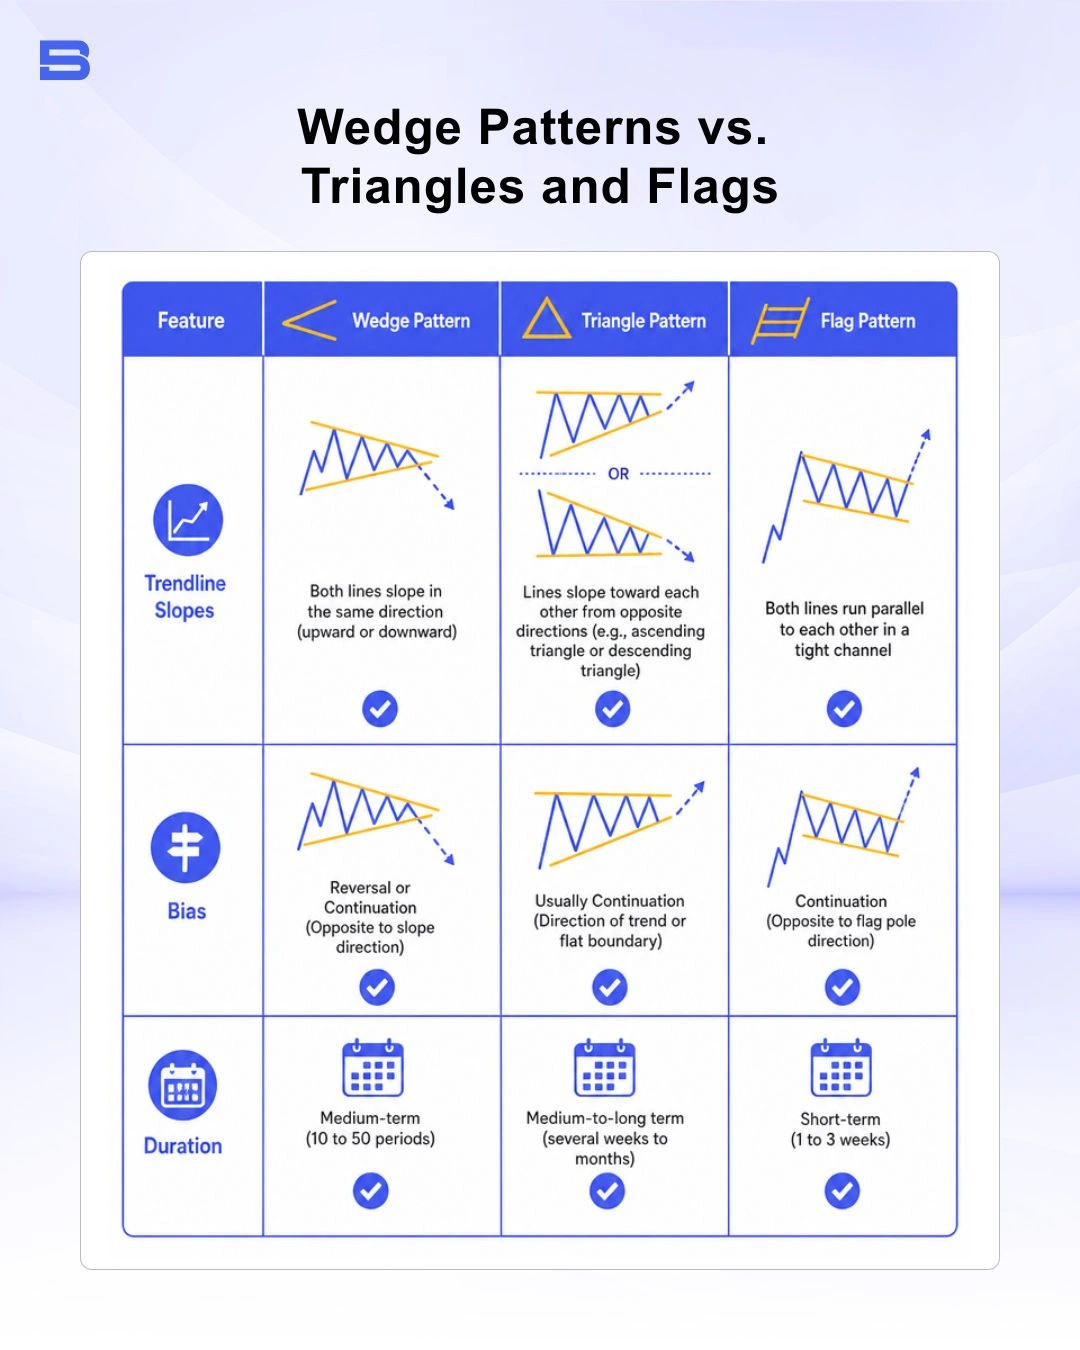
A wedge pattern is a technical price formation formed by two converging trendlines moving in the same upward or downward direction over 10 to 50 trading periods. Unlike triangles where trendlines slope in opposite directions, both boundaries of a wedge slope in the same direction—either both upward or both downward.
At its core, a wedge reflects a market where buyers and sellers are compressing volatility. As price advances toward the point where the lines intersect (the apex), trading volume historically contracts. This shrinking range signals that one side of the market is exhausting its capital, paving the way for a sharp breakout when price finally breaches one of the boundaries.
Understanding the Rising Wedge Pattern
A rising wedge pattern occurs when price forms higher highs and higher lows within two upward-sloping, converging trendlines. The key structural feature is that the lower support line has a steeper slope than the upper resistance line.
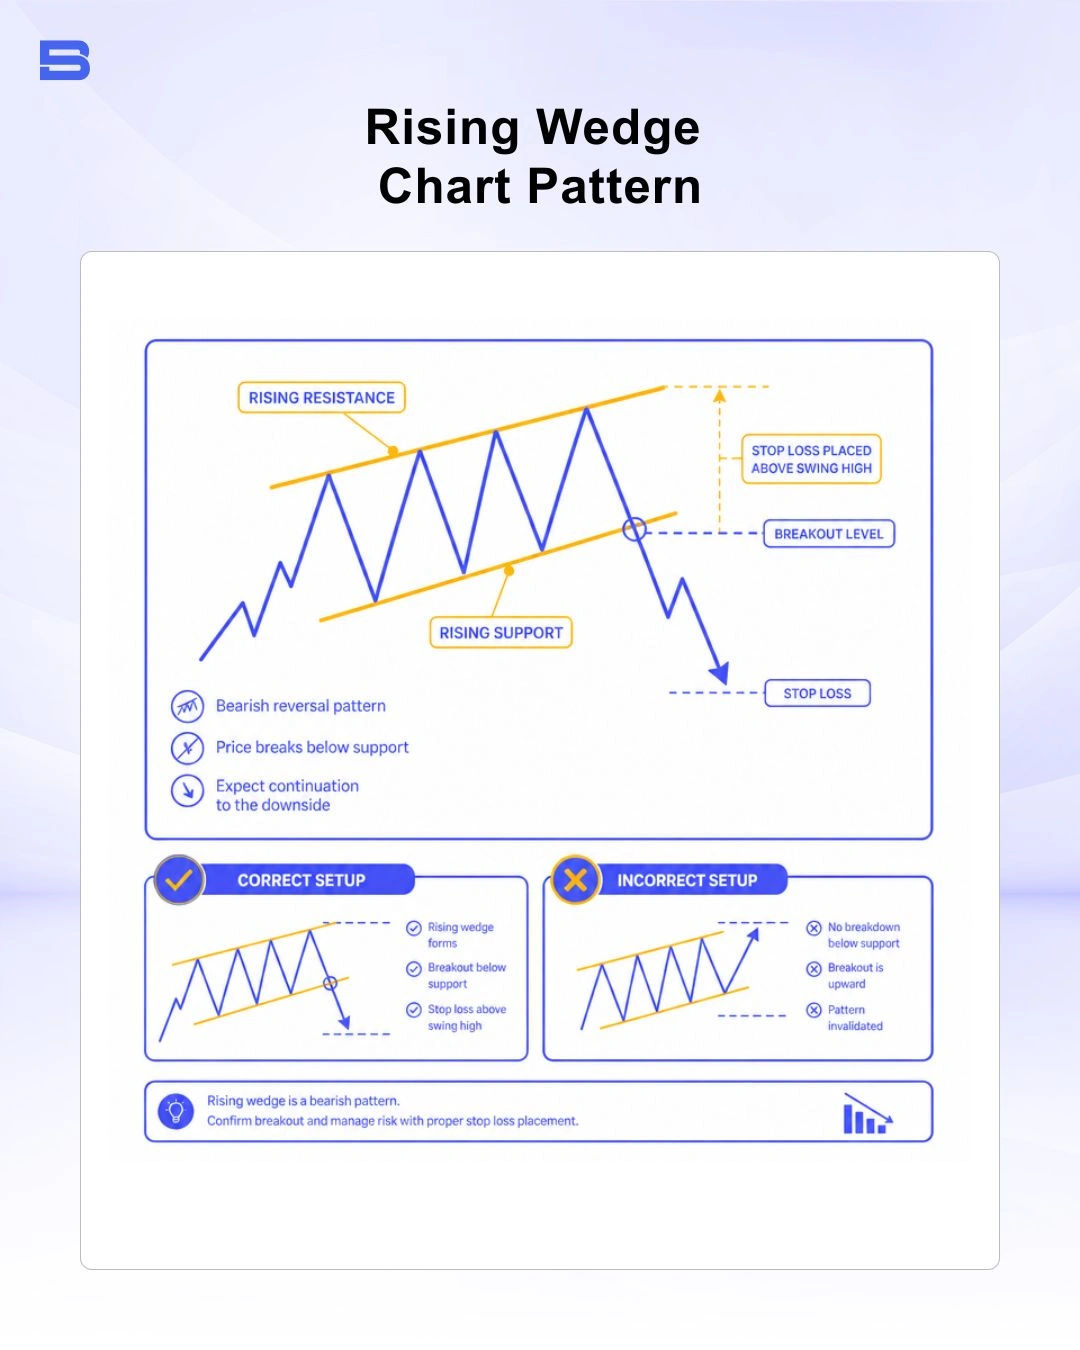
Even though price is reaching higher levels, a rising wedge is inherently bearish. The flatter resistance slope shows that buyers are struggling to push prices higher with each successive swing. Momentum is fading, and demand is drying up.
A rising wedge functions in two distinct market contexts:
- Bearish Reversal: Forms after a prolonged uptrend. The failure of buyers to maintain upward momentum signals a potential trend reversal to the downside.
- Bearish Continuation: Forms as a temporary upward pullback within an established downtrend. Once the consolidation exhausts itself, price breaks support to resume the broader downward trend.
Understanding the Falling Wedge Pattern
A falling wedge pattern occurs when price forms lower lows and lower highs bounded by two downward-sloping, converging trendlines. Here, the upper resistance line slopes more steeply than the lower support line.
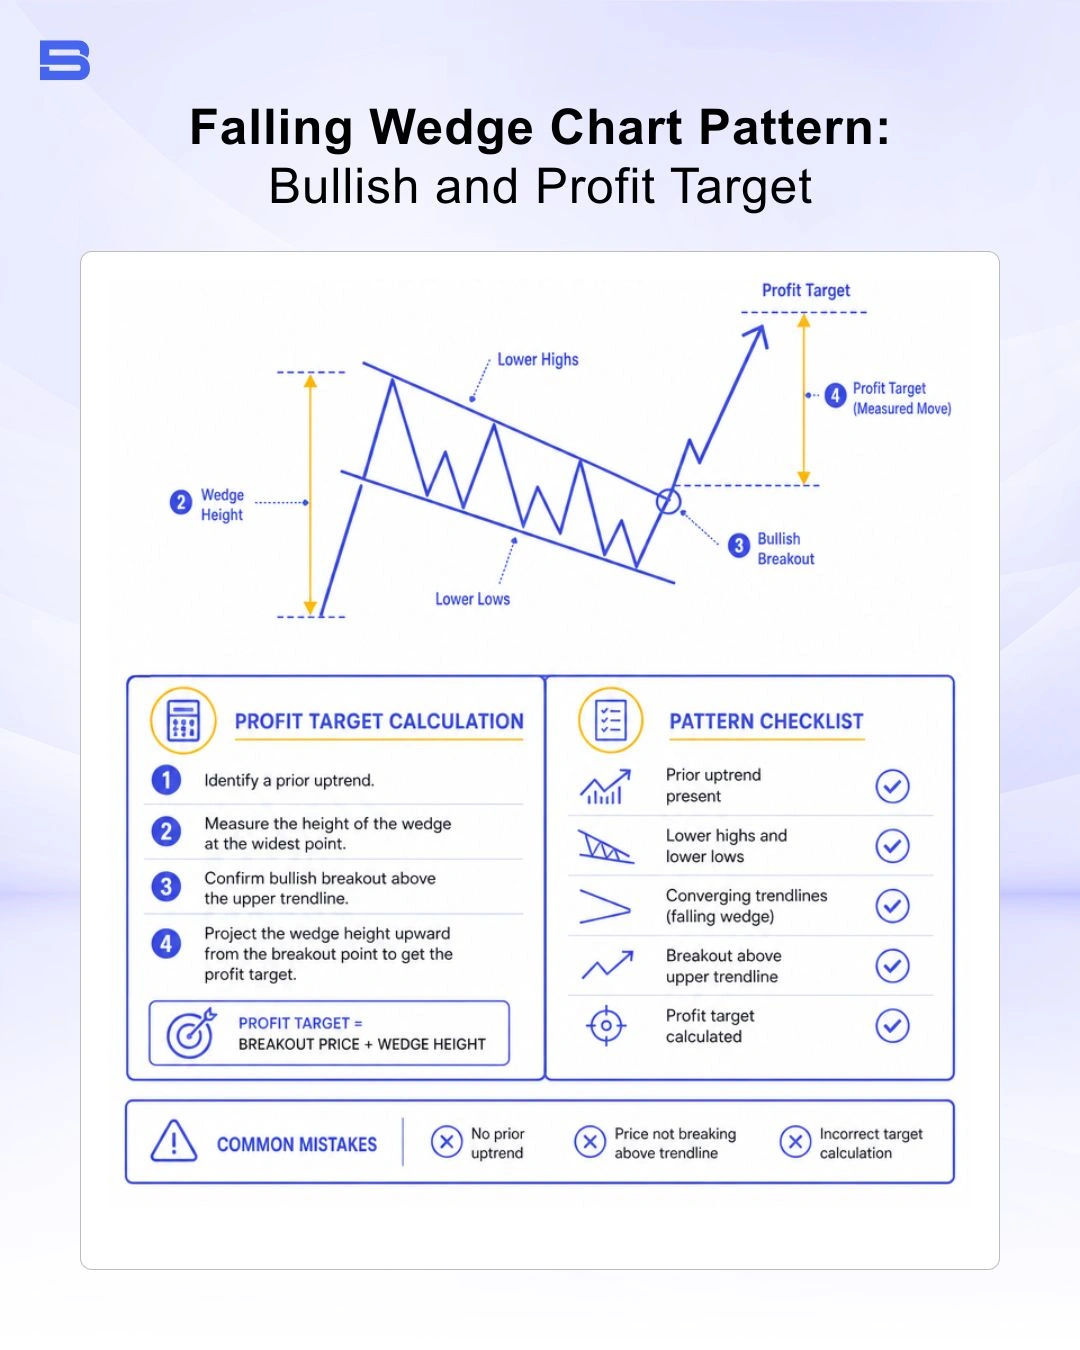
Despite its downward price movement, a falling wedge is generally considered a bullish formation. The downward-sloping resistance line reflects weakening selling pressure, while the support line suggests buyers are increasingly stepping in as price declines.
Candlesticks within the wedge can help traders identify shifts in momentum and potential bullish reversal signals, particularly near the pattern’s lower boundary and breakout point.
A falling wedge operates in two scenarios:
- Bullish Reversal: Appears at the end of a prolonged downtrend, signaling that selling pressure has run its course and a new uptrend is beginning.
- Bullish Continuation: Appears as a short-term downward correction within an ongoing uptrend. Once price breaks above resistance, the dominant upward trend resumes.
How Do You Trade a Wedge Pattern Step-by-Step?
Trading a wedge effectively requires patience, clear rules, and precise execution rather than guessing the outcome before the break occurs.
- Step 1: Identify and Validate Structure. Locate price making higher highs/lows (rising wedge) or lower highs/lows (falling wedge). Ensure at least two distinct touches on both the upper and lower trendlines.
- Step 2: Confirm Contracting Volume. Verify that trading volume steadily decreases as price approaches the apex of the wedge, confirming consolidation.
- Step 3: Wait for a Confirmed Breakout. Do not enter inside the pattern. Wait for a candle to close decisively outside the boundary line (above resistance for a falling wedge, below support for a rising wedge), ideally accompanied by a surge in volume.
- Step 4: Execute Execution Rules. Place your entry, stop-loss, and profit targets based on established technical parameters.
Entry, Stop-Loss, and Profit-Target Execution Rules
Precision in trade execution ensures your risk remains controlled relative to your potential gain:
- Entry Point: Enter market-on-close when a breakout candle completes outside the trendline, or place a limit order on a throwback (also called a retest) — when price briefly returns to the broken trendline before continuing in the breakout direction.
- Stop-Loss Placement: For a falling wedge breakout, place your stop-loss just below the lowest swing low within the wedge structure. For a rising wedge breakdown, set your stop-loss just above the highest swing high.
- Take-Profit Target: Measure the maximum vertical height (the back/base) of the wedge structure. Project that exact vertical distance from the breakout point to establish your minimum profit target.
Numerical Worked Example:
Suppose EUR/USD forms a falling wedge between 1.0700 and 1.0820, creating a maximum structure height of 120 pips (1.0820 - 1.0700 = 0.0120). Price breaks out above the upper resistance line at 1.0850. You enter long at 1.0850, place your stop-loss below the recent swing low at 1.0810 (40 pips risk), and set your take-profit target by adding 120 pips to your entry, aiming for 1.0970 (120 pips reward). This provides a clear 3:1 reward-to-risk ratio.
Key Differences: Wedge Patterns vs. Triangles and Flags
Traders often confuse wedges with other technical formations, such as the triangle pattern or flag pattern. The primary distinction lies in trendline slope and expected breakout direction.
Common Trading Pitfalls and False Breakout Risks
While technical formations offer clear structural boundaries, no technical pattern works 100% of the time. Statistical research on chart patterns shows that wedge formations can experience meaningful failure rates, with reported rates varying by wedge type and breakout direction.
According to an independent statistical study by trader and author Thomas Bulkowski — based on his own historical backtesting of thousands of chart patterns (2021 edition) rather than an official regulatory dataset — wedge formations showed failure rates of around 19%–29% for several breakout scenarios, while rising wedges showed substantially higher failure rates for certain breakout directions. False breakouts, or “fakeouts,” can occur when price briefly moves beyond a pattern boundary before reversing.
Regulatory authorities like the Securities Commission Malaysia (SC) frequently remind investors that leverage amplifies both gains and losses—a 2.5% adverse price spike following a false breakout can wipe out significant margin if risk parameters are ignored.
To mitigate false breakout risks:
- Never trade in anticipation of the break before it occurs.
- Require a volume surge on the breakout candle to confirm institutional participation.
- Be aware of broader structural levels; a wedge breaking into a major horizontal boundary, like a double top pattern resistance zone, can trigger immediate rejection.
Conclusion
A wedge pattern in trading helps traders identify potential trend continuation or reversal opportunities by analysing converging support and resistance lines. Rising wedges are generally bearish, while falling wedges are typically bullish.
However, traders should not rely on the pattern alone. Combining wedge formations with candlestick signals, trading volume, momentum indicators, and confirmation of a breakout can help reduce the risk of false signals. As with any technical analysis tool, proper risk management and stop-loss strategies remain essential.
- How to Build an Investment Plan That Actually Works for You?
- What Is the MACD Indicator and How to Use It
- What Is a Wedge Pattern in Trading?
- What Is Ichimoku Cloud Strategy? A Complete Trading System
- Mastering Elliott Wave Theory: Rules and Trading Strategies
- News Trading: Strategies, Execution Risks, and Risk Control
- What Is an Iron Condor Options Strategy?
- Backtesting Explained: What It Is and Why It Really Matters
- Grid Trading: Mechanics, Parameters, and Risk Strategies
- What Is Breakout Trading and How Does It Work?
- Mean Reversion: Technical Strategies and Risk Frameworks
- Momentum Trading: Indicators, Strategies, and Risk Control
- Hammer Candlestick: Structure, Meaning, and Strategy
- Doji Candlestick: Types, Signals, and Trading Strategies
- What Is the Sharpe Ratio and How to Calculate It
- What Is VWAP and How Do Traders Use It?
- Trade the Ascending Triangle: A Step-by-Step Practical Guide
- What Is the Stochastic Oscillator and How to Use It
- How to Trade the Descending Triangle Pattern
- High Frequency Trading: Speed, Algorithms, and Market Impact
- What Is Volume Profile and How to Use It in Trading
- What Is a Morning Star Pattern Candlestick?
- Trade with Parabolic SAR: A Practical Analysis Guide
- Evening Star Pattern: Structure, Rules, and Risk Controls
- Kelly Criterion: Formula, Position Sizing, and Risk
- What Is the NYSE Minimum Trading Price? Rules Explained
Disclaimer: The content on this page is intended for educational and informational purposes only. It does not constitute financial, investment, tax, or legal advice, and should not be interpreted as a recommendation to buy, sell, or hold any financial instrument or asset. Trading and investing involve significant risk, including the possible loss of your entire capital. Products such as forex, CFDs, and cryptocurrencies carry additional risks due to leverage, high volatility, and limited regulatory protection in some jurisdictions. Past performance of any financial instrument does not guarantee future results. Any market views, forecasts, or opinions expressed are those of the author at the time of writing and may not reflect current market conditions. Platform features, fees, and regulatory status are subject to change — always verify information directly with the relevant provider or regulator before making any financial decision. BrokerSpecs may receive compensation from third parties featured on this site. Always conduct your own due diligence and consider seeking advice from a licensed financial professional before investing. Portions of this article were prepared with the assistance of AI tools and reviewed by our editorial team before publication.