


Related Tags
You open your laptop after a long day at work, pull up a stock chart, and notice a familiar pattern. A company you have been watching has steadily dropped over the past week, hitting a price floor where buyers historically step in. Instead of panicking or trying to catch a lightning-fast breakout within seconds, you calmly place an order to buy, planning to hold the asset for several days or weeks until the momentum shifts upward.
This is the reality of swing trading. Unlike day traders who are glued to multiple screens, fighting the clock, swing traders operate on a broader canvas, looking to capture the structural "swings" or price waves built into financial markets. It bridges the gap between high-velocity day trading and multi-year investing, offering a distinct rhythm that fits naturally around a standard schedule.
How Swing Trading Works in the Real Market
So, what is swing trading in practice? At its core, swing trading is a speculative strategy where you hold an asset anywhere from a couple of days to several weeks. Swing trading is a speculative trading strategy where you hold a stock, forex pair, or other asset for anywhere from a few days to several weeks, aiming to capture one meaningful price "swing" rather than an intraday move or a multi-year trend.
The primary goal is to capture a chunk of a potential price move. By zooming out to daily or four-hour charts, you look past the erratic hourly noise of the market to focus on broader, more predictable trends.
Markets rarely move in straight lines. Even in a strong bull market, prices rally, pull back to catch their breath, and rally again. Swing traders look to buy at these brief moments of exhaustion (troughs) and sell when the momentum reaches a short-term peak. The strategy relies heavily on technical analysis to spot these turning points, though many traders also keep a close eye on corporate earnings or macroeconomic data that might spark a multi-day trend.

Swing Trading vs. Day Trading: Finding Your Rhythm
Choosing how to approach the markets often comes down to your personal schedule, psychological tolerance, and available time. While both styles seek to profit from short-term price movements, they operate in completely different structural lanes.
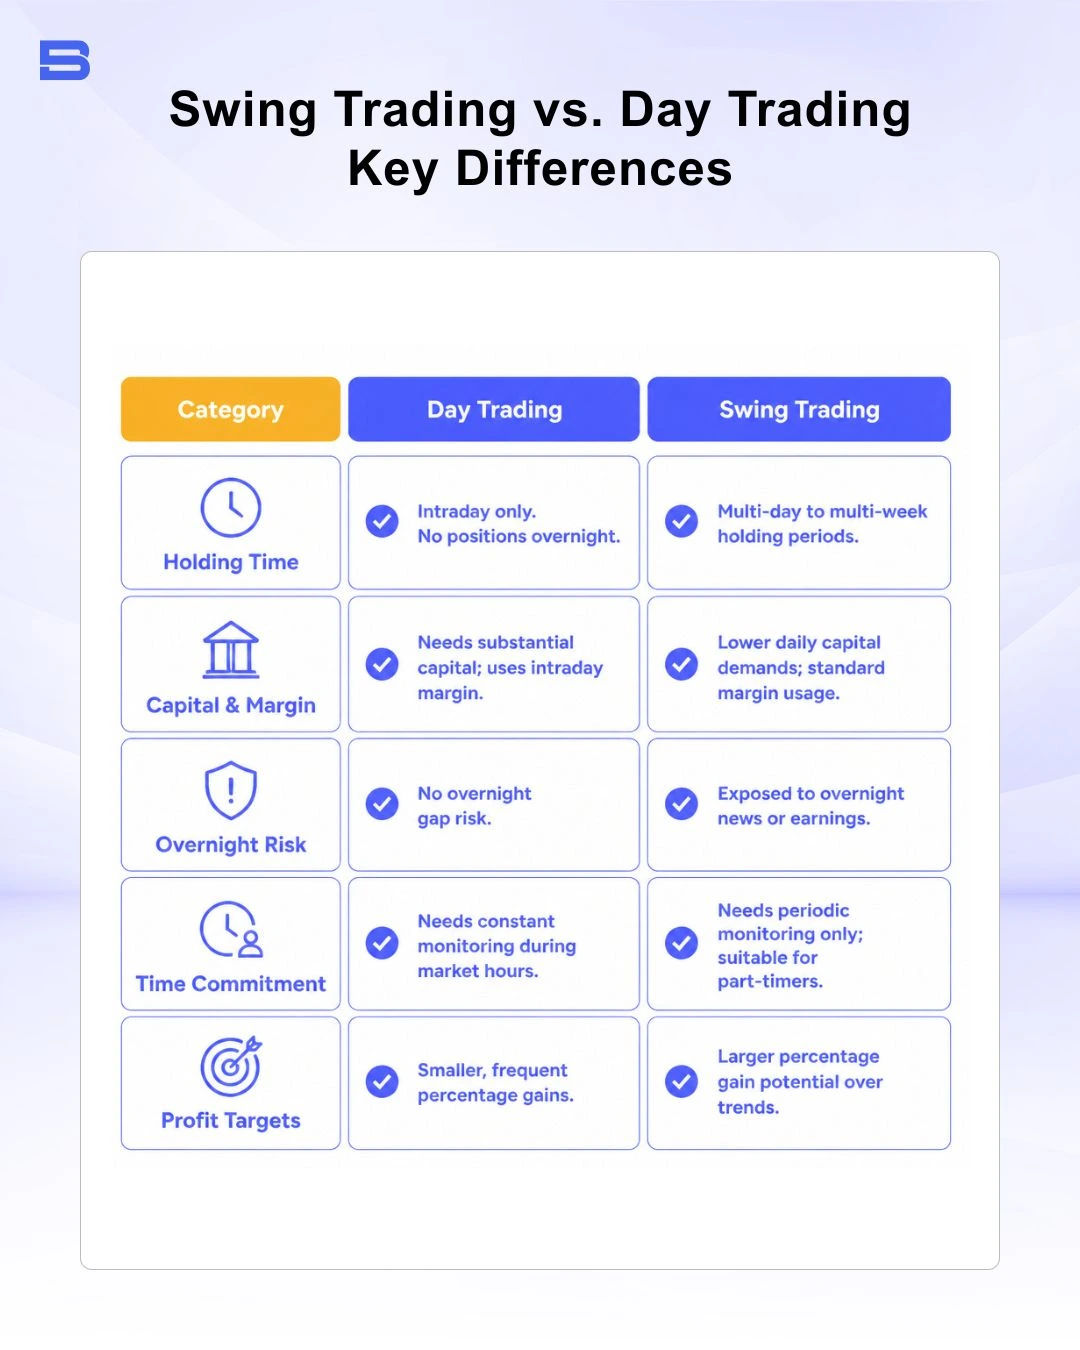
The most significant operational difference is overnight risk. Day traders close all positions before the closing bell rings, ensuring they sleep soundly without worrying about unexpected news breaking overnight. Swing traders willingly accept overnight risk. If a company releases disastrous news or a regulatory body shifts policy while the market is closed, the asset could gap down significantly the next morning, bypassing your planned stop-loss orders.
For readers who want to go deeper on risk management mechanics, see FINRA's investor guidance on stop-loss orders or an overview of technical analysis basics from Investopedia.
A Real-World Swing Trade Scenario
To understand the mechanics, let us look at a worked example using a theoretical asset setup. Suppose you are tracking a stock, ABC Tech, which has established a strong technical floor—known as support—around the $150 mark.
- The Setup: You observe ABC Tech pull back from $165 down to $151 over six trading days. The selling pressure begins to dry up, and a bullish reversal candle forms on the daily chart.
- The Plan: You decide to buy 50 shares at $152. To protect your capital, you place a stop-loss order just below the recent floor at $147. You set a profit target at $162, right below the previous major peak.
- The Math: Your risk per share is $5 ($152 entry minus $147 stop-loss). Your total capital at risk is $250 ($5 risk multiplied by 50 shares). Your potential reward is $10 per share ($162 target minus $152 entry), yielding a potential profit of $500. This sets up a clean 1:2 risk-to-reward ratio, meaning you stand to make twice as much as you're risking if the trade works out.
- The Outcome: The market turns in your direction. Over the next five days, institutional buying lifts the stock. On the sixth day, a strong morning rally pushes the price to $162.50, triggering your take-profit order at $162.
By executing this plan, you captured a meaningful gain over a single week without needing to monitor the ticker every minute of the trading day. However, if the stock had broken below support instead, your stop-loss would have triggered at $147, capping your loss precisely at the pre-calculated $250.
Core Swing Trading Strategies
Successful swing trading relies on executing a repeatable, rule-based strategy rather than relying on gut feelings. Most strategies fall into two major categories:
Trend Trading (Pullbacks)
In an established uptrend, you wait for the asset price to temporarily drop to a key moving average (a line that smooths out recent prices to show the general trend) or support level.
Breakout Trading
This strategy involves watching an asset compress into a tight trading range or chart pattern. When the price forcefully breaks above the ceiling of resistance on high trading volume, you enter the trade, expecting a swift multi-day continuation of that breakout momentum.
Managing the Realities of Market Swings
Swing trading offers a balanced path for those looking to interact with the financial markets without letting price charts consume their entire daily routine. By shifting your perspective from minutes to days, you gain the time to analyze setups deeply, plan your risk meticulously, and let structural market trends do the heavy lifting.
However, trading over multi-day horizons requires patience to let trades develop and the emotional fortitude to accept overnight gaps. If you are looking to start, many traders choose to test their strategies using a demo account or with highly conservative position sizes first — though the right approach depends on your own risk tolerance, capital, and experience level, and this should not be taken as individual investment advice.
- What Is Trading and How Does Trading Work?
- Trading Fundamentals: A Guide for Beginners
- Trading vs. Investing: What Are the Key Differences?
- Trading Terms and Terminologies Every Beginner Should Know
- Common Trading Mistakes Beginners Make and How to Avoid
- Understanding Risk and Reward in Trading: A Complete Guide
- Guide to the Different Types of Financial Markets
- Investment Basics: Definition, Strategies, and How to Invest
- Benefits of Investing: Financial Growth and Security
- What Is Swing Trading? A Practical Guide For Beginners
- What Is Spot Trading? A Guide for Beginners
- What Are Futures in Trading? A Guide for Beginners
- Understanding Bull Markets: Growth & Strategy
- How to Read a Candlestick Chart: A Guide for Beginners
- Is Trading Gambling? The Truth About Risk
- Pip in Forex: How It Works & How to Calculate It
- What Is the Bid-Ask Spread in Trading? A Guide for Beginners
- What Is a Margin Call? A Guide for Beginners
- Market Volatility Explained: What It Is and How to Trade It
- Drawdown in Trading: Meaning, Math, and Risk
- Understanding Slippage in Trading: Causes and Control
- Forex Lot Size Explained: Standard, Mini & Micro
- Trailing Stop vs Stop Loss: Essential Risk Strategy
- How Asset Allocation Works: Strategies Explained
- Understanding Market Trading Hours & Sessions
- Market Makers Explained: A Trader's Guide
- Portfolio Diversification: A Strategy Guide
- Capital Gains Explained: How Investment Taxes Work
- Stock Market Circuit Breakers: How Trading Halts Work
- What Is an IPO? How Initial Public Offerings Work
- What Is a Secondary Market? A Complete Guide
- What Is a Stock Exchange? Functions and Overview Explained
- Understanding Ticker Symbols: A Market Guide
- How Clearing Houses Work in Financial Markets
- Stock Market After Labor Day: Trends and What To Expect
Disclaimer: The content on this page is intended for educational and informational purposes only. It does not constitute financial, investment, tax, or legal advice, and should not be interpreted as a recommendation to buy, sell, or hold any financial instrument or asset. Trading and investing involve significant risk, including the possible loss of your entire capital. Products such as forex, CFDs, and cryptocurrencies carry additional risks due to leverage, high volatility, and limited regulatory protection in some jurisdictions. Past performance of any financial instrument does not guarantee future results. Any market views, forecasts, or opinions expressed are those of the author at the time of writing and may not reflect current market conditions. Platform features, fees, and regulatory status are subject to change — always verify information directly with the relevant provider or regulator before making any financial decision. BrokerSpecs may receive compensation from third parties featured on this site. Always conduct your own due diligence and consider seeking advice from a licensed financial professional before investing.