


Related Tags
You open your trading platform for the first time, eager to analyze the market, only to be greeted by a wall of flickering red and green rectangles. Lines spike up and down, and numbers shift constantly. If you feel overwhelmed, you are not alone—nearly every successful trader once looked at a candlestick chart and wondered how to make sense of the noise.
Learning to read a candlestick chart is like learning a new language. Once you understand the basic grammar, those confusing shapes transform into a vivid story of buyer and seller psychology, revealing exactly who is controlling the market moment by moment.
What Is a Candlestick Chart?
Learning how to read candlestick charts opens the door to understanding price action across multiple asset classes — including forex, stocks, crypto, and commodities — using a single, universal visual language.
A candlestick chart is a visual tool used by traders to track price movements over a specific timeframe. Originating in 18th-century Japan, where rice traders used them to track market sentiment, these charts have become the standard visual format for modern technical analysis across forex, stocks, crypto, and commodities.
Unlike a simple line chart—which only shows the closing price over time—a single candlestick packs four vital pieces of price data into one easy-to-read figure:
- Open: The price when the time period began.
- High: The highest price reached during the period.
- Low: The lowest price reached during the period.
- Close: The final price when the period ended.
Together, these four points are known as OHLC data — short for Open, High, Low, Close. By viewing a sequence of candlesticks, you can instantly see whether buyers (bulls) or sellers (bears) are driving the market narrative.
Anatomy of a Candlestick: The 4 Core Elements
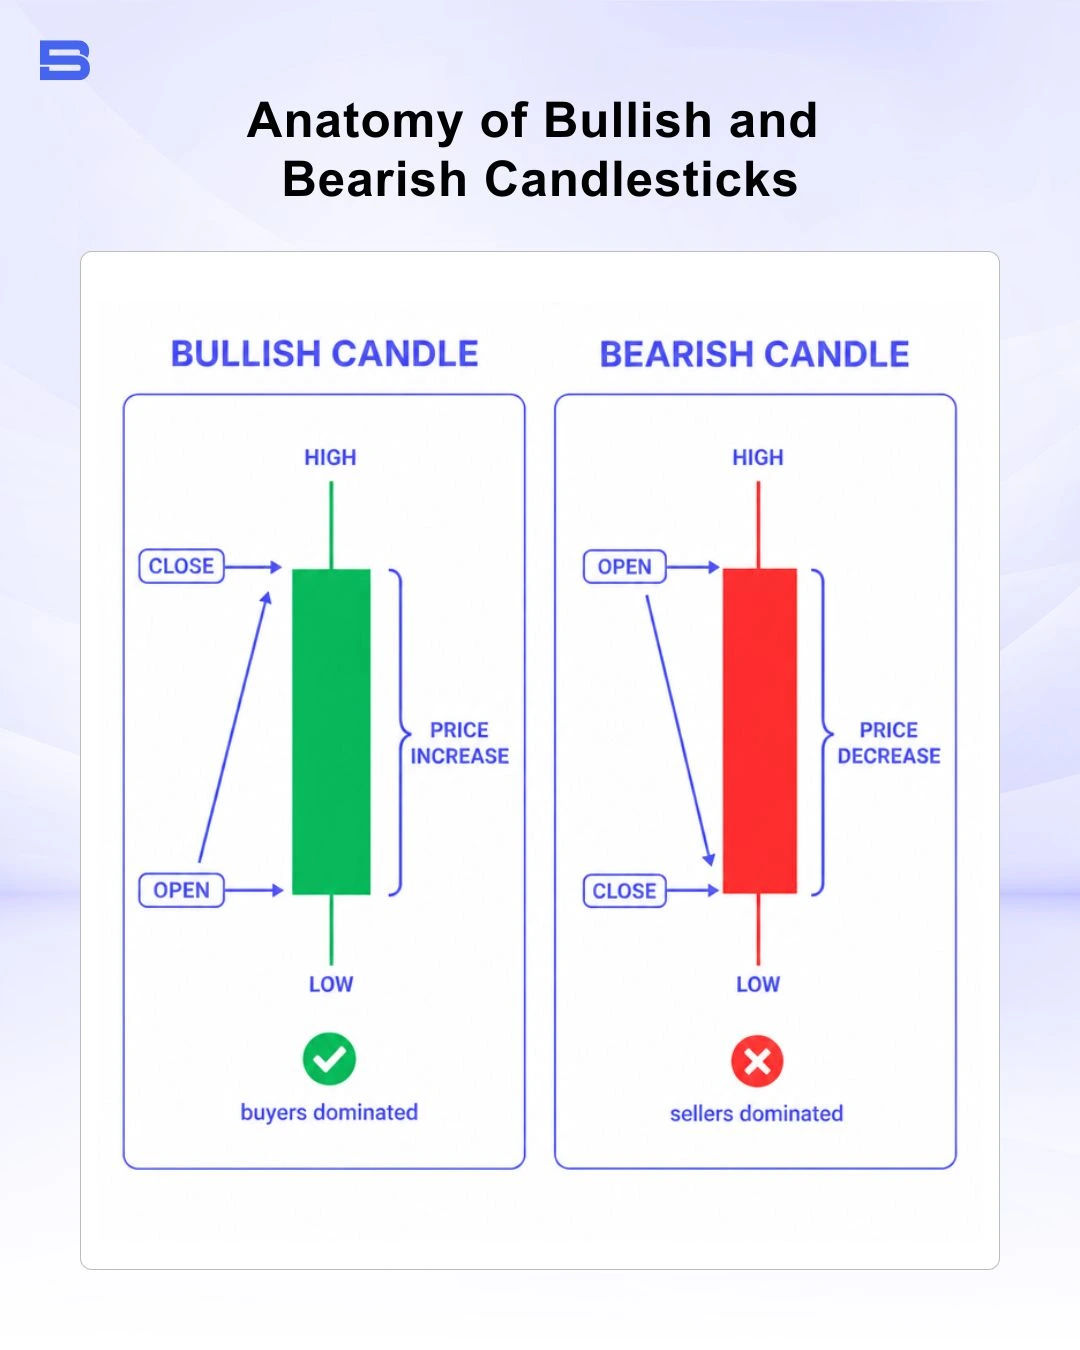
To interpret candlestick charts accurately, you must break down a single candle into its structural parts. Every candlestick consists of a central body and extended lines above or below it.
1. The Body (Real Body)
The wide, rectangular section of the candle is called the real body. It represents the price difference between the period's opening and closing prices. A long body indicates strong buying or selling pressure, while a short body suggests minimal price movement and market hesitation.
2. The Color
The body color tells you the direction of the market during that timeframe:
- Green (or White): Bullish candle. The price closed higher than it opened.
- Red (or Black): Bearish candle. The price closed lower than it opened.
3. The Upper Shadow (Wick)
The vertical line extending above the real body marks the highest price traded during the session. It represents how far buyers managed to push the price upward before sellers pushed it back down.
4. The Lower Shadow (Tail)
The vertical line extending below the real body marks the lowest price traded. It shows how low sellers pushed the price before buyers stepped in to push it back up.
Step-by-Step: How to Read Price Action on a Candlestick
Reading a candlestick is not just about identifying shapes; it is about evaluating market force. By observing the balance between the body and shadows, you can decipher market sentiment.
Measuring Buyer vs. Seller Control
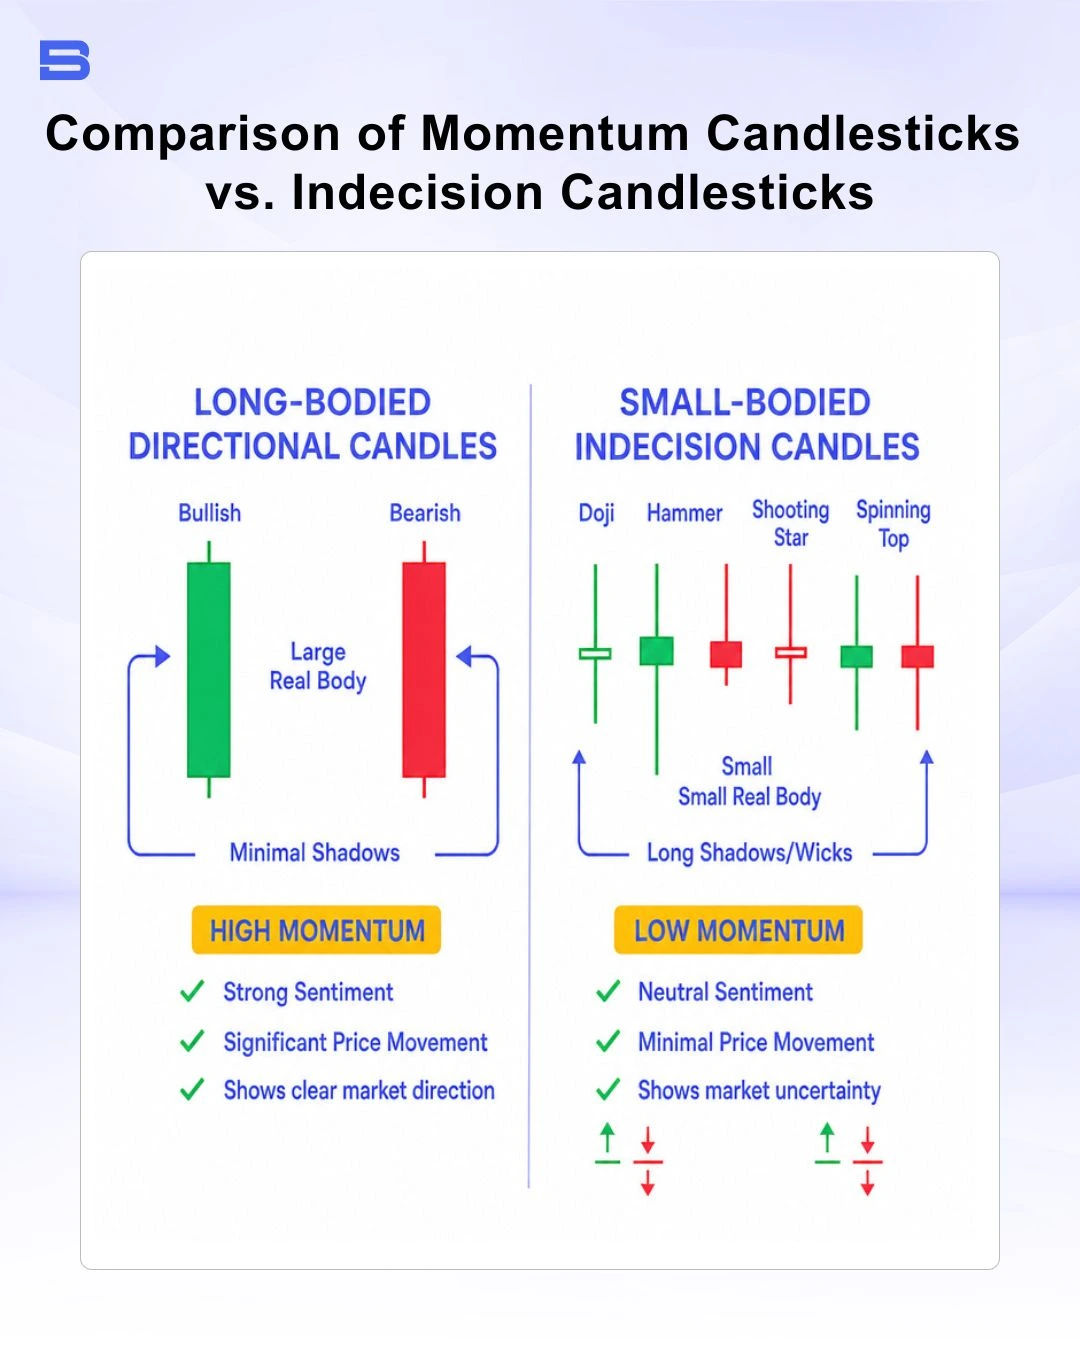
- Long Green Body with Short Wicks: Buyers were in full control from start to finish. Demand heavily outweighed supply.
- Long Red Body with Short Wicks: Sellers dominated the session, aggressively pushing prices downward.
- Small Body with Long Upper and Lower Wicks: Neither buyers nor sellers could hold control. The market experienced high volatility but ultimately closed near where it opened—a state of indecision.
Real-World Example: Reading a Trade Setup
Imagine you are trading EUR/USD (the Euro against the US Dollar) on a 1-hour chart, and the current candle opens at 1.0850.
The Setup: During the hour, aggressive buyers drive the price up to a high of 1.0910.
The Reversal: Near the top, sellers enter the market and force the price back down, causing the candle to close at 1.0860. The low of the hour was 1.0845.
The Math:
Body Size = 1.0860 - 1.0850 = 10 pips (Bullish)
Upper Wick = 1.0910 - 1.0860 = 50 pips
Lower Wick= 1.0850 - 1.0845 = 5 pips
The Interpretation: Although the candle ended green (+10 pips), the massive 50-pip upper wick reveals that buyers failed to sustain the rally. Sellers aggressively rejected the high price, signaling that a downward move or market exhaustion may be coming next.
Essential Japanese Candlestick Patterns to Know
While individual candles give short-term clues, multi-candle patterns reveal broader shifts in trend direction. Here are three essential patterns every beginner should recognize:
1. The Hammer (Single Candle Reversal)
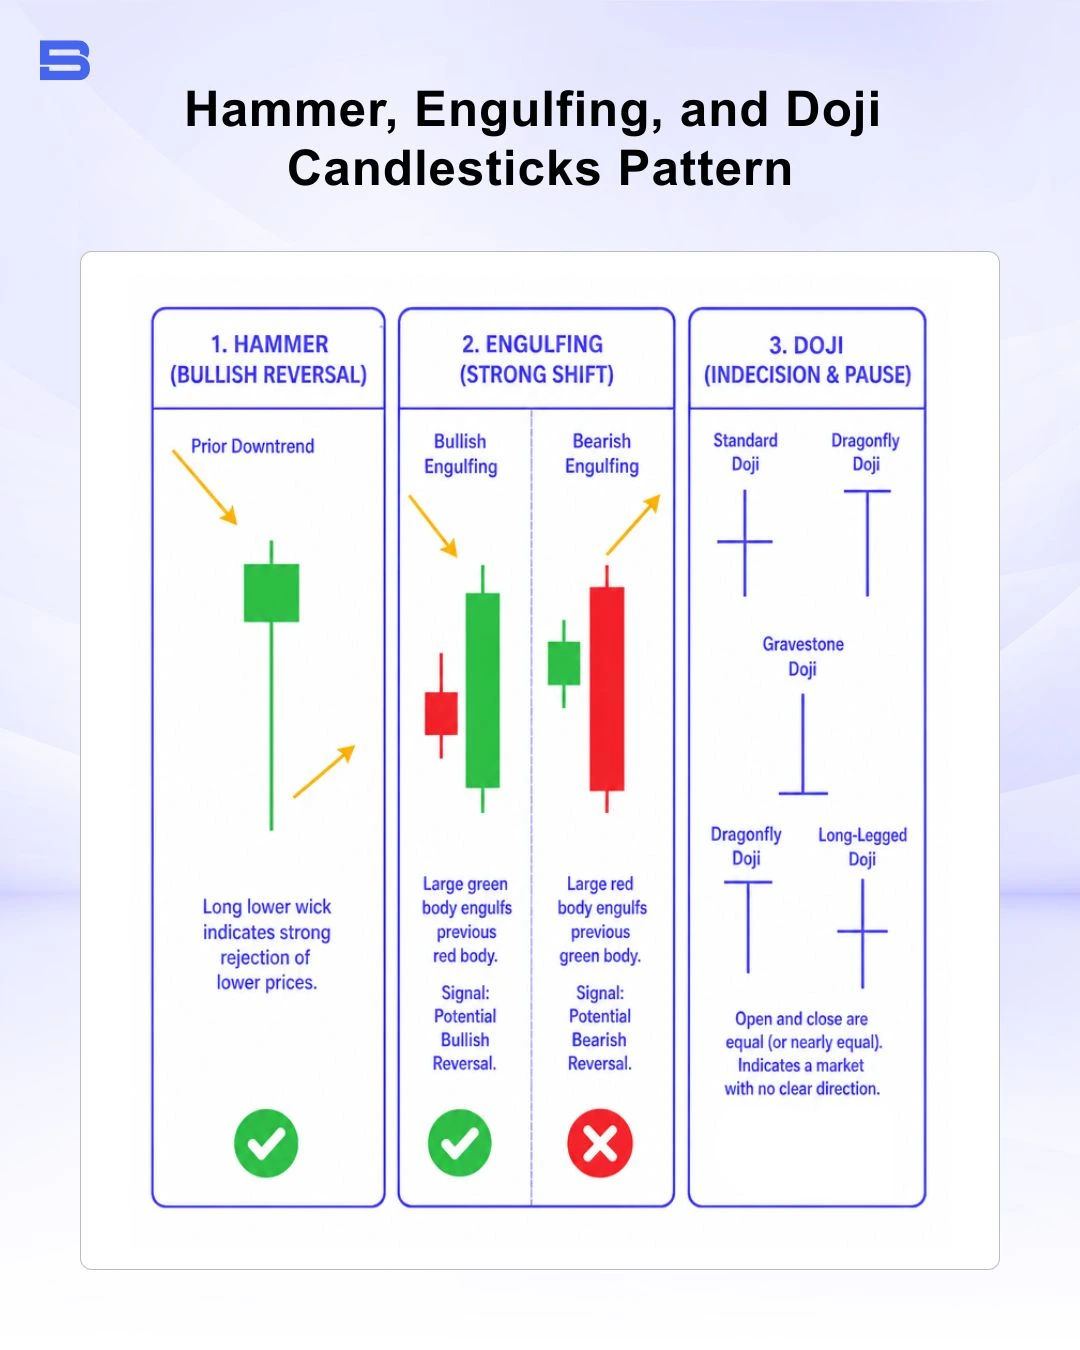
- What it looks like: A small body at the top of the price range with a long lower wick (at least twice the length of the body) and little to no upper wick.
- What it means: Occurring after a downtrend, a Hammer indicates that sellers tried to drive prices lower, but strong buying pressure stepped in to rescue the price. It suggests a potential bullish reversal.
2. The Bullish / Bearish Engulfing (Two-Candle Pattern)
- What it looks like: A two-candle reversal pattern where a smaller candle is followed immediately by a larger candle whose body completely "engulfs" the previous candle's body.
- What it means: A Bullish Engulfing pattern (small red candle followed by a large green candle) signals a powerful shift in momentum from sellers to buyers. Conversely, a Bearish Engulfing pattern signals that sellers have seized control.
3. The Doji (Indecision Pattern)
- What it looks like: A candle where the open and close prices are nearly identical, resulting in a cross-like shape with virtually no body.
- What it means: A Doji represents temporary equilibrium and indecision. When appearing at the end of an extended uptrend or downtrend, it often warns that the prevailing trend is losing steam.
3 Common Pitfalls to Avoid When Reading Charts
While candlestick charts provide valuable insights, relying on them incorrectly can lead to unnecessary trading losses.
- Trading Patterns in Isolation: A Hammer candle appearing in the middle of a sideways market carries far less weight than one forming at a major historical support. Combining candlestick patterns with support and resistance levels can provide additional confirmation, depending on your overall trading strategy.
- Ignoring the Timeframe Context: A bullish pattern on a 5-minute chart may represent a tiny price fluctuation, whereas the same pattern on a Daily chart signals a major market shift. Higher timeframes offer higher-reliability signals.
- Failing to Manage Risk: No candlestick pattern is 100% reliable, so it's important always to set clear stop-loss orders and define your risk before entering a trade.
Final Thoughts
Mastering candlestick charts is a foundational skill that will serve you throughout your entire trading journey. By learning to look beyond simple red and green shapes and focusing on what the wicks and bodies reveal about market sentiment, you gain a clear view of who is winning the tug-of-war between buyers and sellers. Start by practicing on higher timeframes and combining these visual signals with key support and resistance zones.
- What Is Trading and How Does Trading Work?
- Trading Fundamentals: A Guide for Beginners
- Trading vs. Investing: What Are the Key Differences?
- Trading Terms and Terminologies Every Beginner Should Know
- Common Trading Mistakes Beginners Make and How to Avoid
- Understanding Risk and Reward in Trading: A Complete Guide
- Guide to the Different Types of Financial Markets
- Investment Basics: Definition, Strategies, and How to Invest
- Benefits of Investing: Financial Growth and Security
- What Is Swing Trading? A Practical Guide For Beginners
- What Is Spot Trading? A Guide for Beginners
- What Are Futures in Trading? A Guide for Beginners
- Understanding Bull Markets: Growth & Strategy
- How to Read a Candlestick Chart: A Guide for Beginners
- Is Trading Gambling? The Truth About Risk
- Pip in Forex: How It Works & How to Calculate It
- What Is the Bid-Ask Spread in Trading? A Guide for Beginners
- What Is a Margin Call? A Guide for Beginners
- Market Volatility Explained: What It Is and How to Trade It
- Drawdown in Trading: Meaning, Math, and Risk
- Understanding Slippage in Trading: Causes and Control
- Forex Lot Size Explained: Standard, Mini & Micro
- Trailing Stop vs Stop Loss: Essential Risk Strategy
- How Asset Allocation Works: Strategies Explained
- Understanding Market Trading Hours & Sessions
- Market Makers Explained: A Trader's Guide
- Portfolio Diversification: A Strategy Guide
- Capital Gains Explained: How Investment Taxes Work
- Stock Market Circuit Breakers: How Trading Halts Work
- What Is an IPO? How Initial Public Offerings Work
- What Is a Secondary Market? A Complete Guide
- What Is a Stock Exchange? Functions and Overview Explained
- Understanding Ticker Symbols: A Market Guide
- How Clearing Houses Work in Financial Markets
- Stock Market After Labor Day: Trends and What To Expect
Disclaimer: The content on this page is intended for educational and informational purposes only. It does not constitute financial, investment, tax, or legal advice, and should not be interpreted as a recommendation to buy, sell, or hold any financial instrument or asset. Trading and investing involve significant risk, including the possible loss of your entire capital. Products such as forex, CFDs, and cryptocurrencies carry additional risks due to leverage, high volatility, and limited regulatory protection in some jurisdictions. Past performance of any financial instrument does not guarantee future results. Any market views, forecasts, or opinions expressed are those of the author at the time of writing and may not reflect current market conditions. Platform features, fees, and regulatory status are subject to change — always verify information directly with the relevant provider or regulator before making any financial decision. BrokerSpecs may receive compensation from third parties featured on this site. Always conduct your own due diligence and consider seeking advice from a licensed financial professional before investing. Portions of this article were prepared with the assistance of AI tools and reviewed by our editorial team before publication.