


- What Is Trading and How Does Trading Work?
- Trading Fundamentals: A Guide for Beginners
- Trading vs. Investing: What Are the Key Differences?
- Trading Terms and Terminologies Every Beginner Should Know
- Common Trading Mistakes Beginners Make and How to Avoid
- Understanding Risk and Reward in Trading: A Complete Guide
- Guide to the Different Types of Financial Markets
- Investment Basics: Definition, Strategies, and How to Invest
- Benefits of Investing: Financial Growth and Security
- What Is Swing Trading? A Practical Guide For Beginners
- What Is Spot Trading? A Guide for Beginners
- What Are Futures in Trading? A Guide for Beginners
- Understanding Bull Markets: Growth & Strategy
- How to Read a Candlestick Chart: A Guide for Beginners
- Is Trading Gambling? The Truth About Risk
- Pip in Forex: How It Works & How to Calculate It
- What Is the Bid-Ask Spread in Trading? A Guide for Beginners
- What Is a Margin Call? A Guide for Beginners
- Market Volatility Explained: What It Is and How to Trade It
- Drawdown in Trading: Meaning, Math, and Risk
- Understanding Slippage in Trading: Causes and Control
- Forex Lot Size Explained: Standard, Mini & Micro
- Trailing Stop vs Stop Loss: Essential Risk Strategy
- How Asset Allocation Works: Strategies Explained
- Understanding Market Trading Hours & Sessions
- Market Makers Explained: A Trader's Guide
- Portfolio Diversification: A Strategy Guide
- Capital Gains Explained: How Investment Taxes Work
- Stock Market Circuit Breakers: How Trading Halts Work
- What Is an IPO? How Initial Public Offerings Work
- What Is a Secondary Market? A Complete Guide
- What Is a Stock Exchange? Functions and Overview Explained
- Understanding Ticker Symbols: A Market Guide
- How Clearing Houses Work in Financial Markets
- Stock Market After Labor Day: Trends and What To Expect
You have just enjoyed a solid run. A string of disciplined trades pushed your account balance to an all-time high, and your confidence is soaring. Then the market shifts.
A couple of stopped-out positions turn into a four-trade losing streak, and suddenly your account balance is slipping backward. As you watch your hard-earned equity erode, you are experiencing one of the most vital—yet psychologically taxing—realities of market participation: drawdown.
Every trader, from retail beginners to seasoned institutional portfolio managers, deals with drawdown. It is not necessarily a sign that your strategy is broken; rather, it is the price of admission for taking market risk. However, how you measure, manage, and recover from drawdown will ultimately determine whether your account thrives over the long term or suffers catastrophic capital loss.
What Is Drawdown in Trading? (Peak-to-Trough Explained)
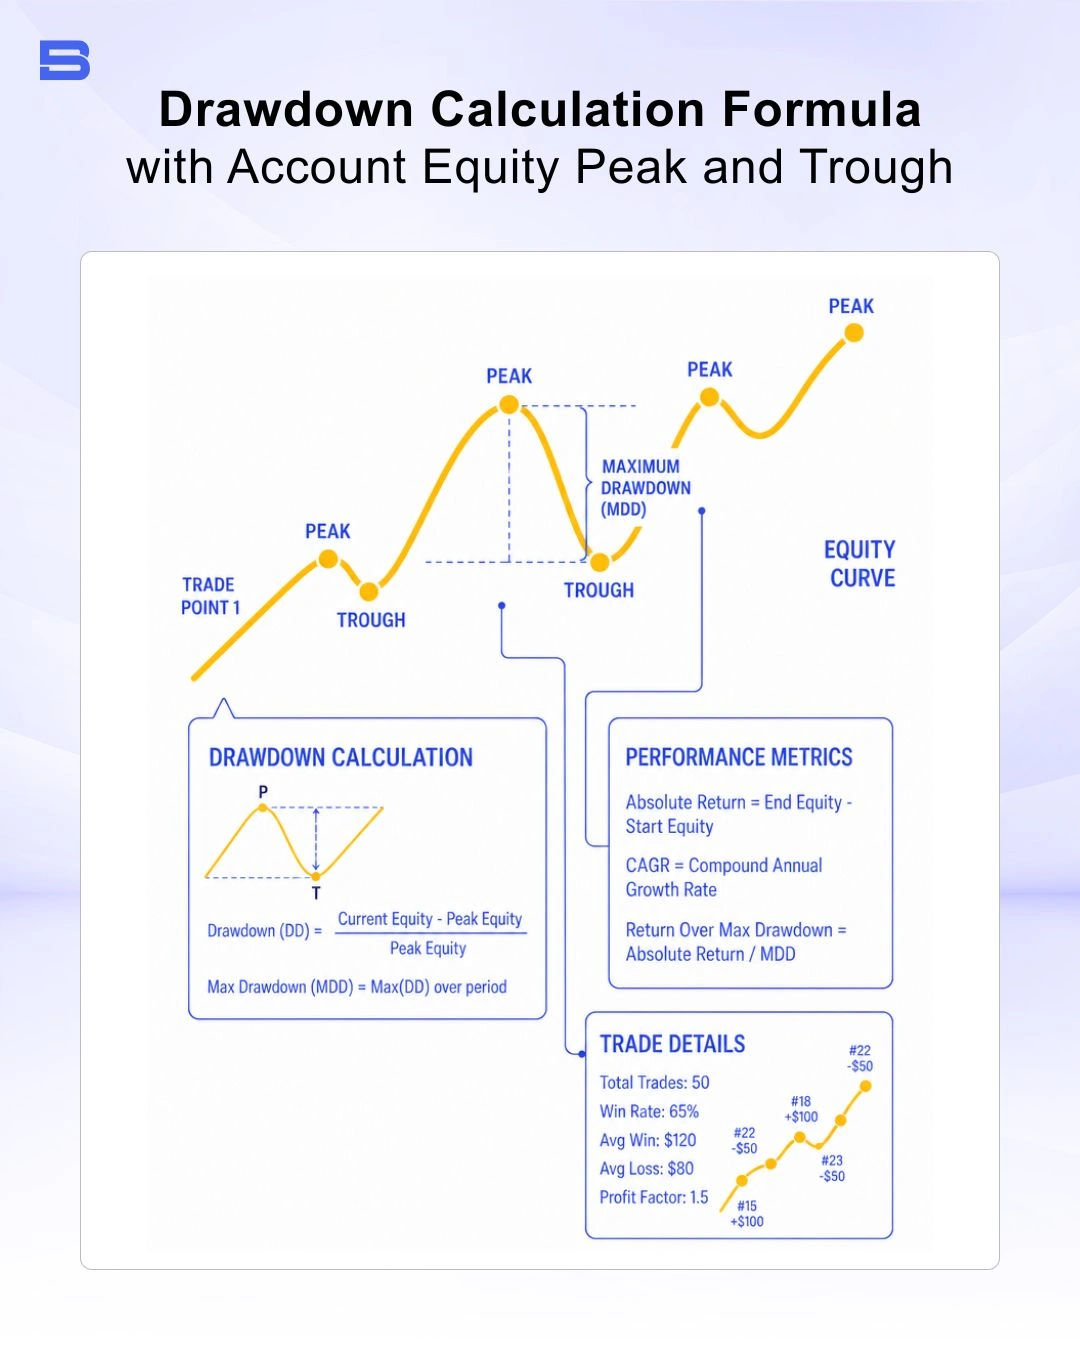
In financial trading, drawdown measures the percentage drop from a specific high point (peak) in your account equity down to a subsequent low point (trough) before a new high is established. It answers a crucial question: How much money has my account lost from its absolute highest point?
It is important to emphasize that this metric is calculated from peak equity, not from your starting deposit. If you fund an account with $5,000, grow it to $10,000, and then experience losses that drop your equity to $8,000, your peak-to-trough loss is calculated against the $10,000 high—not your initial $5,000 deposit.
Worked Example: Calculating Peak-to-Trough Drawdown
To see how this works in practice, let us walk through a typical scenario across a series of trades.
- Initial Deposit: $10,000
- Peak Account Value: After several winning trades, your balance reaches $15,000.
- Losing Streak: A series of losses reduces your balance down to $12,000 before you regain profitability.
To calculate the drawdown percentage, we use the following standard formula:
Drawdown (%) = [(Peak Value - Trough Value) / Peak Value] x 100
Plugging in our numbers:
- Calculate the dollar loss: $15,000 - $12,000 = $3,000
- Divide by the peak value: $3,000 / $15,000 = 0.20
- Convert to percentage: 0.20 * 100 = 20%
In this example, your account experienced a 20% peak-to-trough loss ($3,000 loss from peak). Even though your account is still up $2,000 relative to your initial $10,000 deposit, your peak-to-trough decline stands at 20%.
The Asymmetry of Loss: Why Drawdowns Escalate Fast
Understanding drawdown math is critical because losses and gains do not operate symmetrically. When your capital declines, each remaining dollar represents a larger percentage of your remaining pool. Consequently, as drawdowns deepen, the gain required simply to return to breakeven expands exponentially.
If you lose 10% of a $10,000 account, your remaining balance is $9,000. To get back to $10,000, you need to earn $1,000. On a $9,000 base, a $1,000 gain requires an 11.1% return.
However, if you suffer a 50% peak-to-trough loss, your $10,000 account shrinks to $5,000. To recover that lost $5,000 starting from a $5,000 balance, you must generate a 100% gain just to get back to where you started.
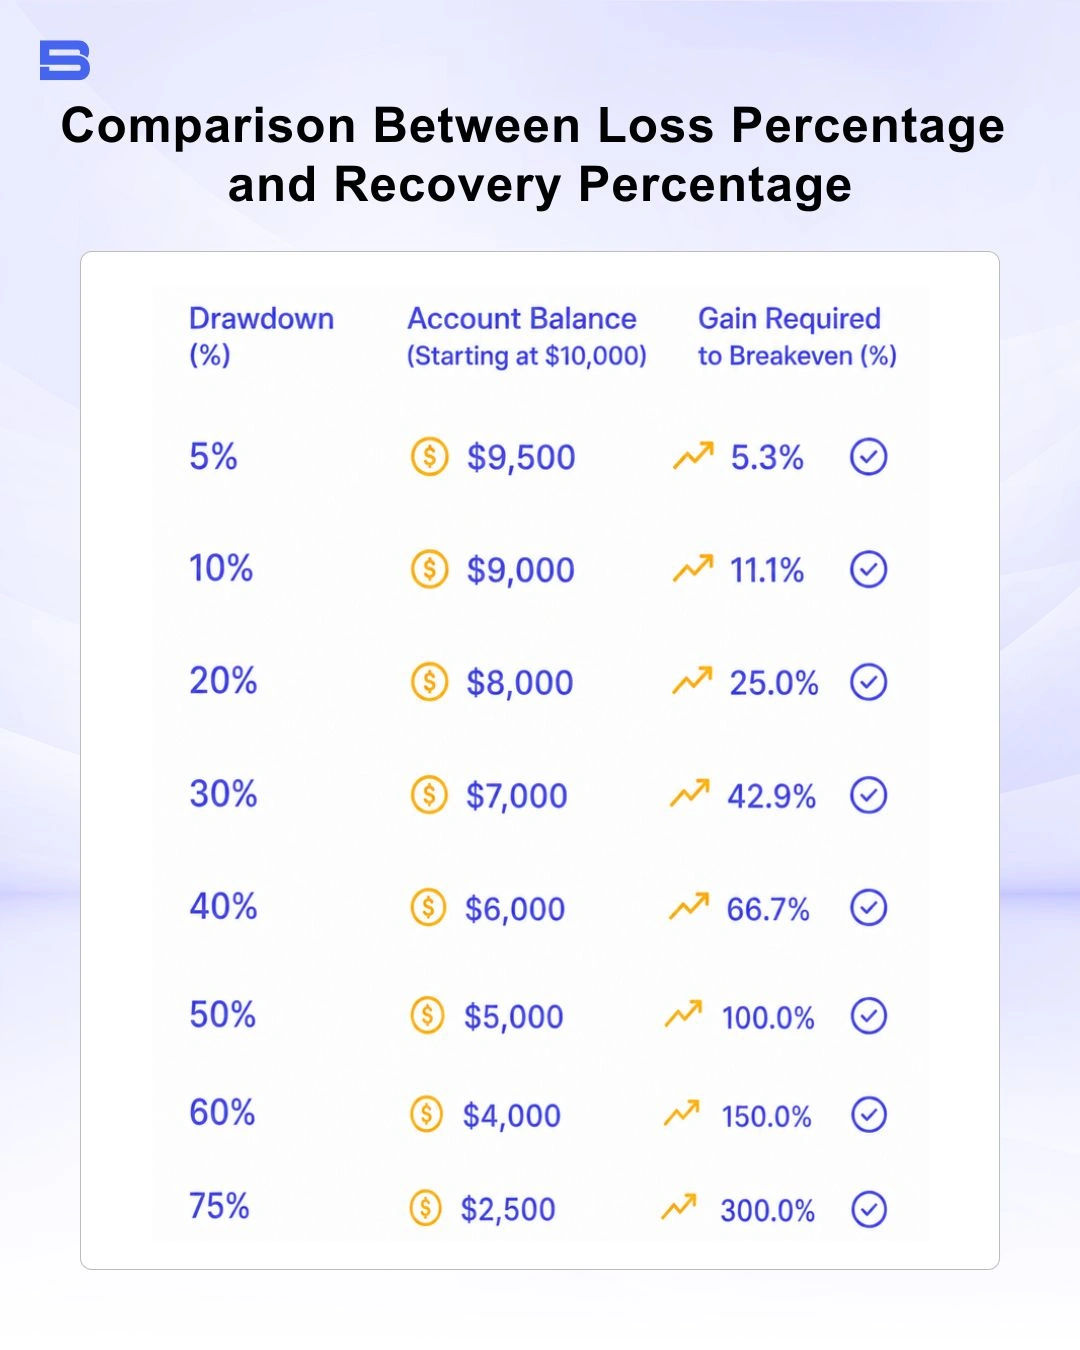
This exponential relationship explains why institutional fund managers prioritize risk preservation over sheer profitability. Once a peak-to-trough decline exceeds 20% to 25%, digging your way out requires exceptional performance or taking on dangerous levels of leverage, which often leads to total account liquidation.
Types of Drawdowns You Must Track
When evaluating trading performance or analyzing automated trading strategies, you will encounter three distinct variations of this metric:
1. Current Drawdown
This measures your live, ongoing peak-to-trough decline right now. If your account peaked at $20,000 yesterday and sits at $18,500 today, your current peak-to-trough decline is 7.5%.
2. Maximum Drawdown (Max DD)
Maximum drawdown is the single worst peak-to-trough loss an account or strategy has experienced over a historical backtest or live trading period. For instance, if a trading strategy ran for three years and its worst historical decline was 18.5%, its Max DD is 18.5%. Two other common risk-adjusted return metrics, the Sharpe ratio and Sortino ratio, do not directly use Max DD in their mathematical formulas—they instead measure risk using volatility and downside deviation. This distinction is a common point of confusion for newer traders.
3. Floating vs. Closed Drawdown
- Closed Drawdown: Calculated strictly based on closed positions and realized account balance.
- Floating (Unrealized) Drawdown: Factors in open positions currently showing unrealized losses. Ignoring floating drawdown can give a false sense of security, as open positions exposed to wide market swings can dangerously stress your margin call requirements.
What Is an Acceptable Drawdown Percentage?
There is no universal magic number for peak-to-trough decline, as acceptable limits depend on your risk tolerance, trading style, and overall capital strategy.
- Conservative / Institutional Style: Many proprietary trading firms and hedge funds are known to apply strict internal peak-to-trough loss limits, often in the single-to-low-double-digit percentage range, though the exact figure varies firm by firm and is not governed by a single public standard.
- Moderate Growth Style: Retail traders focused on consistent, long-term growth commonly aim to keep peak-to-trough loss loosely in the 10%–20% range, though this reflects a general industry pattern rather than a formal rule, and the right target varies by individual strategy. Staying under roughly 20% keeps required breakeven returns realistic (under 25%).
- Aggressive / High-Volatility Style: Traders pursuing aggressive crypto or high-leverage scalping strategies often tolerate peak-to-trough losses loosely in the 20%–35%-plus range, though this is a general behavioral pattern rather than a fixed benchmark. While returns can be high, the mathematical recovery curve becomes steep at this level, requiring strict discipline in trading psychology.
Key Rule of Thumb: Traders whose strategy shows a maximum drawdown beyond 25% to 30% often find it useful to reassess their position sizing rules, since this can help smooth out portfolio volatility — though the right approach depends on each trader's own risk tolerance and goals.
Practical Strategies to Control Drawdown
Preventing deep drawdowns is far easier than recovering from them. Here are actionable risk management techniques to protect your capital:
1. Implement Fixed Percentage Position Sizing
Never risk a random dollar amount per trade. Risking a small, fixed percentage of your account (e.g., 1% or 2%) per trade automatically scales down your position size during a drawdown. As your account equity decreases, your absolute dollar risk per trade contracts, slowing down capital erosion during cold streaks.
2. Enforce Hard Stop-Loss Discipline
Uncontrolled drawdowns almost always stem from holding onto losing trades in the hope that the market will reverse. Consistently using stop-loss orders ensures that individual trade losses remain minor bumps rather than catastrophic hits.
3. Establish Daily or Weekly Loss Limits
Set explicit maximum loss rules for specific time frames. For example, if you lose 3% of your account balance in a single trading day, stop trading for the remainder of that day. Step back, review your trade log, and return when market conditions realign with your edge.
For instance, a trader whose account falls from a $10,000 peak to $8,000 during the day would calculate this as (($10,000 - $8,000) / $10,000) * 100, resulting in a 20% drawdown—well past a typical daily stop point.
The Bottom Line
Drawdown is an inevitable aspect of trading. The goal of a successful trader is not to avoid drawdown entirely—which is mathematically impossible—but to control its depth so that recovery remains straightforward. By monitoring your peak-to-trough metrics, respecting the exponential asymmetry of trading losses, and adhering to strict risk management rules, you can safeguard your account equity and remain in the game for the long run.
Disclaimer: The content on this page is intended for educational and informational purposes only. It does not constitute financial, investment, tax, or legal advice, and should not be interpreted as a recommendation to buy, sell, or hold any financial instrument or asset. Trading and investing involve significant risk, including the possible loss of your entire capital. Products such as forex, CFDs, and cryptocurrencies carry additional risks due to leverage, high volatility, and limited regulatory protection in some jurisdictions. Past performance of any financial instrument does not guarantee future results. Any market views, forecasts, or opinions expressed are those of the author at the time of writing and may not reflect current market conditions. Platform features, fees, and regulatory status are subject to change — always verify information directly with the relevant provider or regulator before making any financial decision. BrokerSpecs may receive compensation from third parties featured on this site. Always conduct your own due diligence and consider seeking advice from a licensed financial professional before investing.