


- What Is Trading and How Does Trading Work?
- Trading Fundamentals: A Guide for Beginners
- Trading vs. Investing: What Are the Key Differences?
- Trading Terms and Terminologies Every Beginner Should Know
- Common Trading Mistakes Beginners Make and How to Avoid
- Understanding Risk and Reward in Trading: A Complete Guide
- Guide to the Different Types of Financial Markets
- Investment Basics: Definition, Strategies, and How to Invest
- Benefits of Investing: Financial Growth and Security
- What Is Swing Trading? A Practical Guide For Beginners
- What Is Spot Trading? A Guide for Beginners
- What Are Futures in Trading? A Guide for Beginners
- Understanding Bull Markets: Growth & Strategy
- How to Read a Candlestick Chart: A Guide for Beginners
- Is Trading Gambling? The Truth About Risk
- Pip in Forex: How It Works & How to Calculate It
- What Is the Bid-Ask Spread in Trading? A Guide for Beginners
- What Is a Margin Call? A Guide for Beginners
- Market Volatility Explained: What It Is and How to Trade It
Imagine browsing two stocks: Company A trades at $500 per share, while Company B trades at just $5 per share. It is remarkably easy to fall into the trap of assuming Company A is a massive corporate giant and Company B is a tiny bargain. But if Company A only has 1 million shares outstanding while Company B has 10 billion, Company A is worth $500 million while Company B is worth $50 billion.
Looking at share price alone gives you a completely skewed view of a company’s true size. To understand what a business is actually worth on the open market, you need to look at its market capitalization.
What Is Market Capitalization?
Market capitalization—frequently shortened to "market cap"—represents the total aggregate value of all a company's outstanding shares of stock. It is the price tag that the stock market places on a publicly traded corporation at any given second.
Understanding market cap prevents you from mistaking a cheap share price for a cheap business valuation. Here’s the breakdown:
Market Cap = Current Share Price x Total Outstanding Shares
A Worked Example: Calculating Market Cap
Let's walk through how this calculation works in practice across two distinct businesses:
Company Alpha:
Current Share Price: $150
Total Outstanding Shares: 50 million
Calculation: $150 × 50,000,000
Market Cap: $7.5 billion
Company Beta:
Current Share Price: $15
Total Outstanding Shares: 2 billion
Calculation: $15 × 2,000,000,000
Market Cap: $30 billion
Even though Company Alpha has a share price ten times higher than Company Beta, Company Beta is actually four times larger in total market size. Understanding this calculation keeps your portfolio focused on actual size and risk rather than psychological share-price optics.
The Four Primary Market Cap Categories
Investors group companies into specific categories based on their total market value. Categorizing stocks this way gives you an immediate blueprint for what kind of volatility, growth, and stability you can expect from an investment.
As of mid-2026, the S&P 500's (Standard & Poor's 500) largest constituents illustrate this range well: several mega-cap technology names now sit well above the $200 billion mega-cap threshold, while the median S&P 500 company remains solidly large-cap.
1. Mega-Cap and Large-Cap Stocks
Market Cap Range: Large-cap stocks generally have a market cap of $10 billion or more, while mega-caps represent the giants valued at $200 billion or above, per standard classification standards such as by Financial Industry Regulatory Authority (FINRA).
Characteristics: These are usually well-established household names with stable revenue streams, strong balance sheets, and global brand recognition.
Risk/Reward Profile: Lower volatility and limited explosive price growth, but higher dividend reliability and operational resilience during economic downturns.
2. Mid-Cap Stocks
Market Cap Range: Mid-cap companies are typically valued between $2 billion and $10 billion, based on FINRA.
Characteristics: Mid-cap companies are established businesses positioned in growth industries. Many are actively expanding market share or transitioning from smaller enterprises.
Risk/Reward Profile: They offer a balanced middle ground—providing higher growth potential than large-cap stocks, alongside greater stability than small-cap stocks.
3. Small-Cap Stocks
Market Cap Range: FINRA classifies small-cap companies as those with values between $250 million and $2 billion.
Characteristics: Small-cap companies are younger businesses or niche players with significant potential for market expansion.
Risk/Reward Profile: High growth potential paired with elevated risk. These companies are more vulnerable to broad economic shocks and carry higher share price volatility.
4. Micro-Cap Stocks
Market Cap Range: Micro-cap companies are typically valued at less than $250 million, as per FINRA’s classifications.
Characteristics: Micro-cap stocks are often early-stage firms with limited financial track records, less analyst coverage, and lower trading liquidity.
Risk/Reward Profile: Highly speculative. They carry substantial risk of capital loss, but successful turnarounds or breakthroughs can lead to dramatic percentage gains.
Why Market Cap Matters to Investors
Market capitalization is far more than an abstract financial metric; it is one of the primary tools used to build balanced, resilient portfolios.
Risk Management and Asset Allocation: Your overall risk tolerance directly dictates how much exposure you should have across different tiers. Conservative investors or those nearing retirement often lean toward large-cap companies for income stability, whereas younger investors might allocate more heavily to mid-caps and small-caps for long-term growth.
Liquidity and Trading Costs: Large-cap stocks trade millions of shares daily, making it effortless to buy or sell positions instantly without shifting the price. In contrast, small-cap and micro-cap stocks can suffer from lower trading volume, widening the bid-ask spread and increasing execution costs.
Index Representation: Major stock indices like the S&P 500 or the Russell 2000 select member companies based heavily on market cap rules. When you buy broad market exchange-traded funds (ETF), understanding market cap helps you see exactly where your capital is allocated.
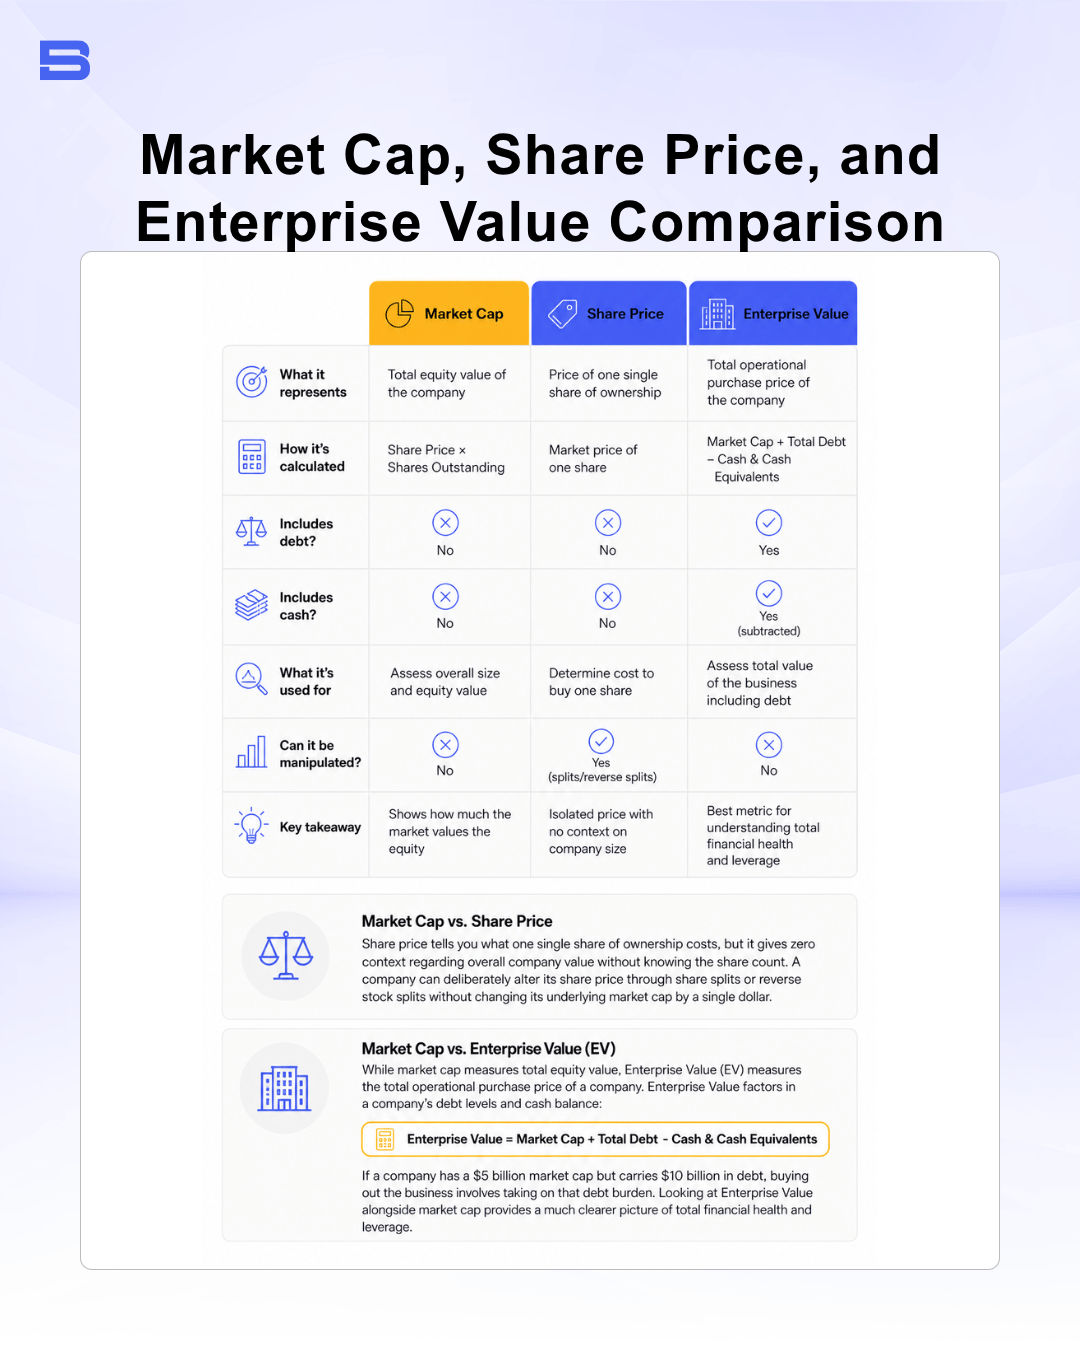
Market Cap vs. Share Price vs. Enterprise Value
Share price tells you only the cost of one single share, while market cap tells you the value of the entire company as priced by the stock market.
Enterprise value goes a step further than market cap by adding a company's debt and subtracting its cash, giving you a fuller picture of what it would actually cost to acquire the whole business, obligations included. When evaluating companies, confusing market cap with other financial metrics can lead to costly analytical errors.
Using Market Cap to Trade
Market capitalization is the foundational metric that cuts through the noise of daily share price movements. By understanding how market cap is calculated and how different cap sizes behave, you can evaluate companies objectively and build a portfolio that directly matches your personal risk tolerance and financial goals.
Before placing your next trade, consider looking past the per-share sticker price and evaluating the true size of the business you are buying into, as part of your own research process.
Disclaimer: The content on this page is intended for educational and informational purposes only. It does not constitute financial, investment, tax, or legal advice, and should not be interpreted as a recommendation to buy, sell, or hold any financial instrument or asset. Trading and investing involve significant risk, including the possible loss of your entire capital. Products such as forex, CFDs, and cryptocurrencies carry additional risks due to leverage, high volatility, and limited regulatory protection in some jurisdictions. Past performance of any financial instrument does not guarantee future results. Any market views, forecasts, or opinions expressed are those of the author at the time of writing and may not reflect current market conditions. Platform features, fees, and regulatory status are subject to change — always verify information directly with the relevant provider or regulator before making any financial decision. BrokerSpecs may receive compensation from third parties featured on this site. Always conduct your own due diligence and consider seeking advice from a licensed financial professional before investing.