


Related Tags
Imagine watching a stock slide lower for five straight sessions, opening with another steep drop at the morning bell before buyers suddenly step in and drive prices back up by the close. When you spot that abrupt shift in momentum on your chart, you may be looking at a piercing line formation. Recognizing this two-candle structure helps you evaluate whether selling pressure is fading, while reminding you to verify price action before risking capital.
What Is the Piercing Line Candlestick Pattern?
The piercing line candlestick pattern is a two-candle bullish reversal formation that appears after a downtrend when a green candle closes above the prior red candle’s midpoint.
During a sustained decline, sellers control each session and push closing prices progressively lower. On the second day of this formation, initial panic or overnight selling forces the market to open below the previous session’s low, yet buyers absorb the supply and rally prices past the halfway mark of the first candle’s real body. Traders watch this bullish reversal candlestick closely because it signals that demand may be overwhelming supply at support.
Still, a single two-candle formation does not guarantee that a downtrend has ended. Markets frequently pause after sharp drops only to resume falling once brief short-covering fades, so treating any pattern as an automatic entry trigger exposes your account to avoidable losses.
How to Identify a Piercing Candlestick Pattern
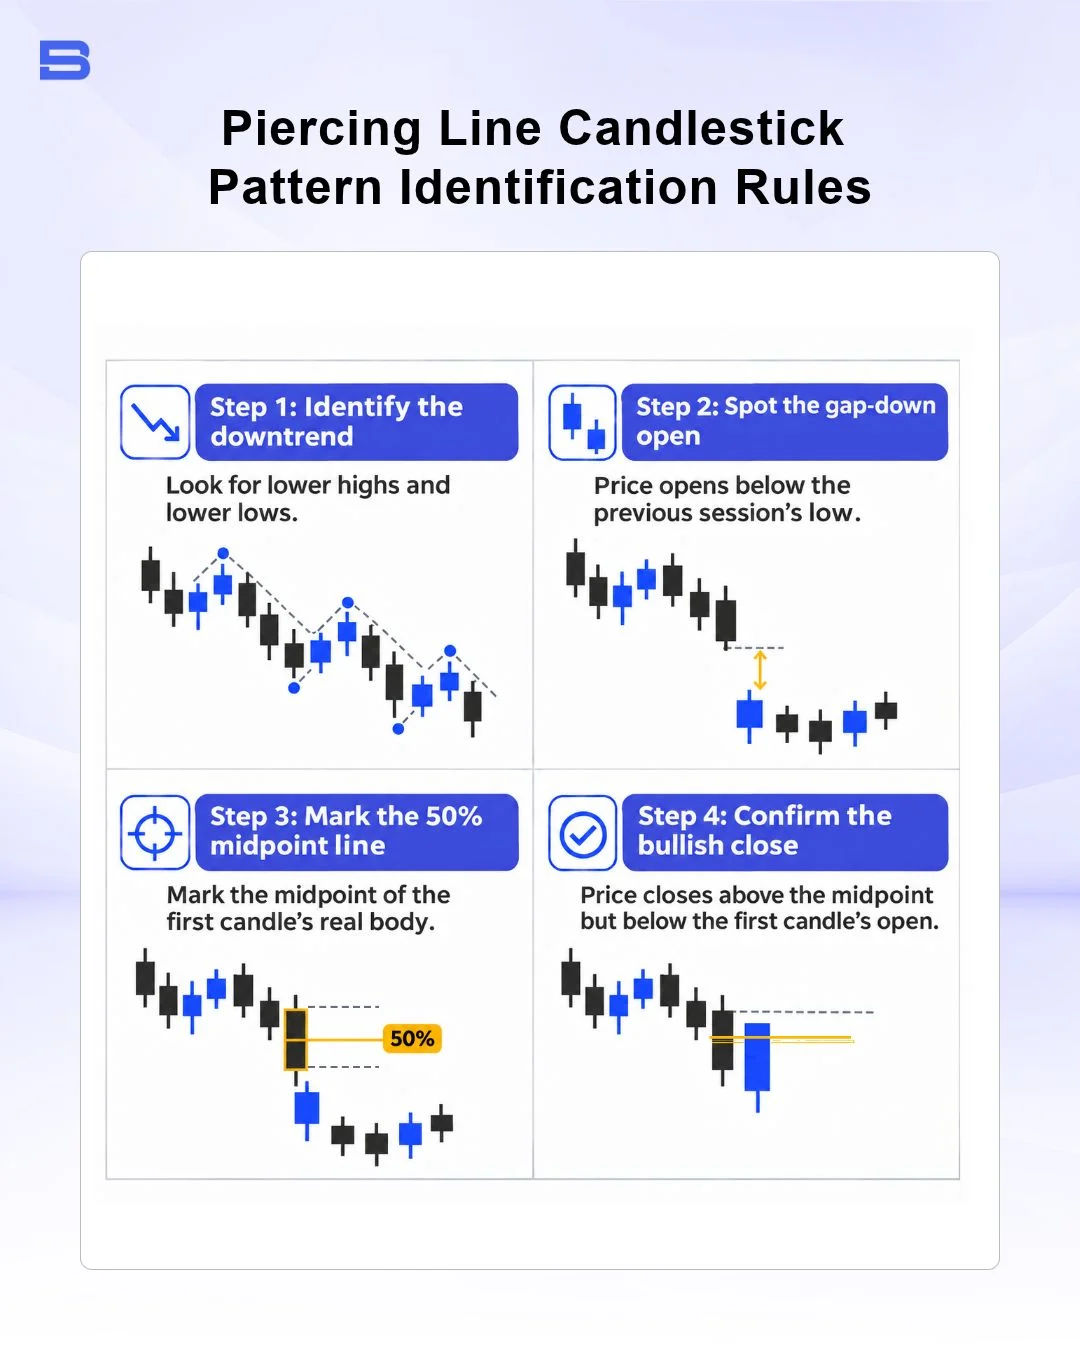
Spotting a valid piercing candlestick pattern requires checking four specific structural rules on your price chart before considering a trade.
- Established downtrend: Price must be moving clearly lower over several sessions so there is an active trend to reverse.
- Strong bearish first candle: Day one features a long red or black real body showing decisive selling pressure, though unlike a marubozu candlestick, it can still have small upper or lower shadows.
- Downward opening gap: Day two opens below the first candle’s low, creating a visible gap down at the session start.
Bullish close past the midpoint: Day two rallies strongly and closes above the 50% midpoint of the first candle’s real body, while remaining below day one’s opening price.
These four criteria separate a textbook piercing line from neighboring setups on your chart. If the second candle closes below the 50% mark, the setup is a thrusting or in-neck line (a bullish close that stays below the first candle’s midpoint), which tends to favor trend continuation. If the second candle stays completely inside the first candle’s body, you are looking at a bullish harami or an inside bar rather than a piercing formation. Interestingly, if you blend both candles on a higher timeframe, their combined price action creates a single bullish pin bar with a long lower wick.
Market structure also shapes how strictly you apply the gap-down rule across different assets. On daily charts of stocks listed on exchanges like Bursa Malaysia, overnight news and opening auctions regularly create true price gaps below the prior session’s low. In 24-hour markets such as forex, price rarely gaps between consecutive daily candles except over weekends, so traders often accept a second candle that opens near the prior close and still drives cleanly above the 50% midpoint.
Piercing Line Pattern vs. Dark Cloud Cover: Spotting the Bearish Mirror
Understanding this pattern becomes much easier when you compare it with its exact bearish opposite, the dark cloud cover pattern. While a piercing line appears at the bottom of a downtrend to warn of a potential upward reversal, dark cloud cover forms at the top of an uptrend when a strong bullish candle is followed by a gap-up open and a bearish close below the prior candle’s 50% midpoint.
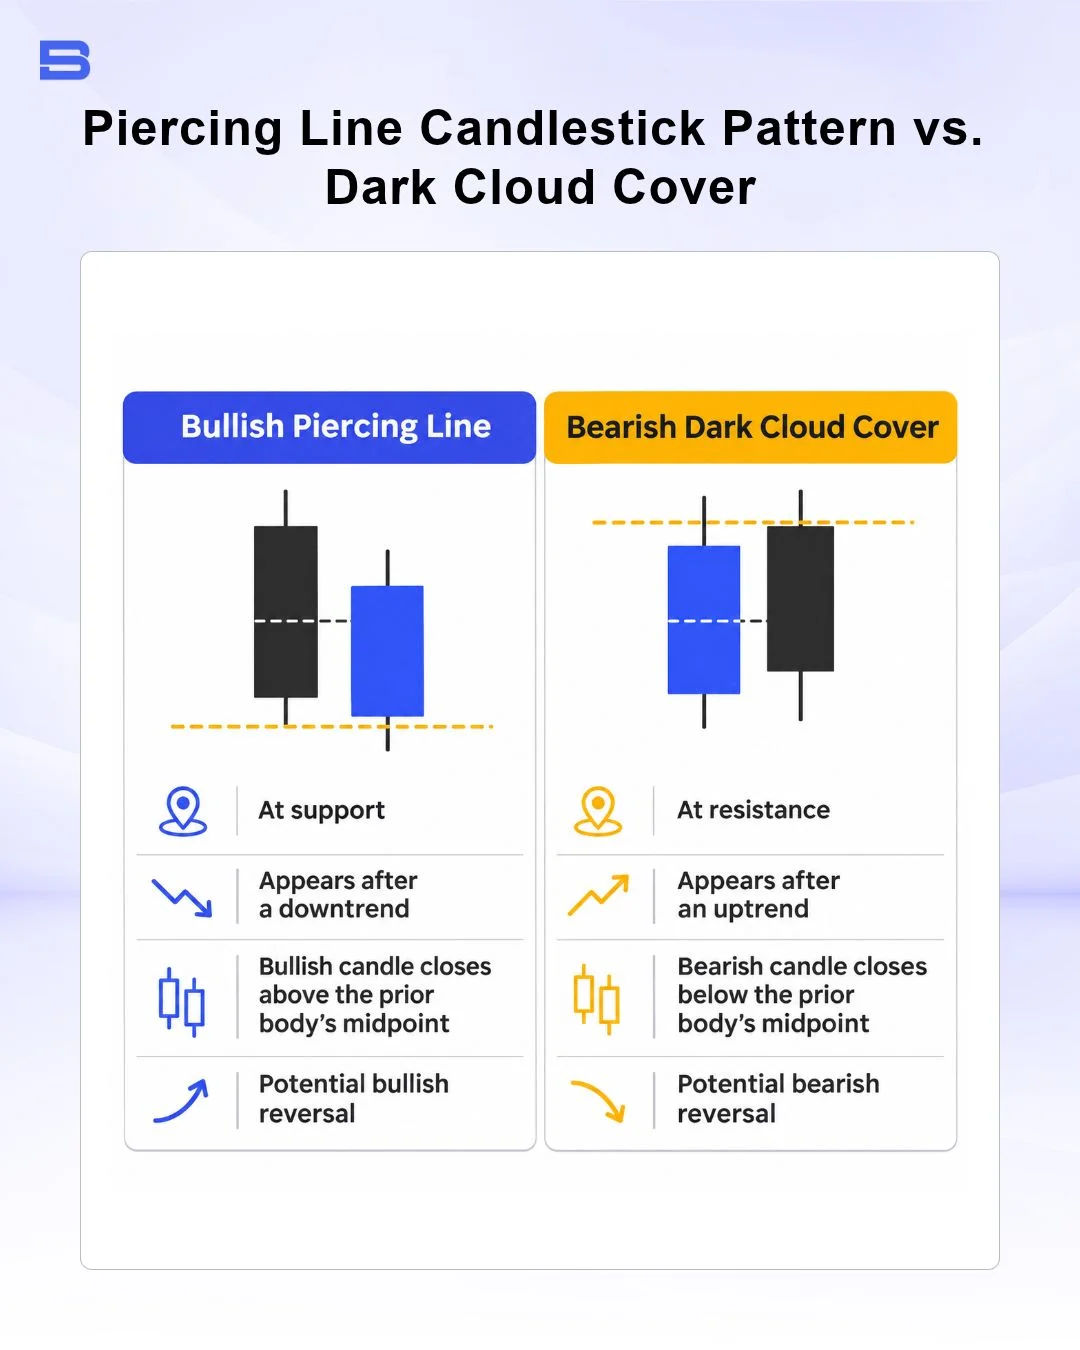
Both setups measure the same tug-of-war between opening momentum and closing conviction at market extremes. Just as traders pair a piercing line pattern with support levels to gauge buying interest, they watch dark cloud cover alongside resistance or other topping signals like a gravestone doji candlestick and a bearish harami to spot when an uptrend may be losing steam.
How to Trade the Piercing Line Pattern With Confirmation and Risk Controls
Entering a trade the moment the second candle closes exposes you to false reversals if sellers immediately regain control on the next bar. Instead, it is advisable to wait for confirmation, such as a third bullish candle closing above the second candle’s high, rising trading volume, or alignment with a major horizontal support zone. Combining this setup with nearby reversal clues like a tweezer bottom candlestick pattern, a dragonfly doji candlestick, or an inverted hammer candlestick can help filter out weak signals in choppy markets.
Consider a practical example using an RM10,000 stock trading account with a strict 1% maximum risk per trade, which limits your potential loss to RM100. Suppose a stock falls to a support level and prints a piercing line with a pattern low at RM3.95, followed by a confirmation candle closing at RM4.10. You place a buy entry at RM4.12 and set your stop-loss at RM3.92, just below the pattern low, creating a risk of RM0.20 per share.
Dividing your RM100 risk budget by RM0.20 per share gives a maximum position size of 500 shares. If the price rallies to your 1:2 risk-reward target at RM4.52, you gain RM200 before fees; however, if the 50% midpoint fails to hold and price drops through RM3.92, your stop-loss exits the position for a controlled RM100 loss.
Keep in mind that overnight gaps or sudden volatility can still cause stop orders to fill below your chosen stop price, a risk highlighted in investor guidance from the US Securities and Exchange Commission (SEC). Candlestick patterns do not produce consistent results, and how well any single pattern works can vary across markets, trading periods, and market conditions.
As the CFA Institute emphasizes in its risk-management guidance, predefined position limits and stop-loss controls are important for keeping potential losses within acceptable boundaries.
Conclusion
The piercing line candlestick pattern offers a structured way to spot potential bullish momentum shifts after a decline, provided you verify the 50% close, wait for confirmation, and size your position around a clear stop-loss. Combining pattern recognition with disciplined risk controls helps protect your capital whenever an expected reversal fails to follow through.
- How to Build an Investment Plan That Actually Works for You?
- What Is the MACD Indicator and How to Use It
- What Is a Wedge Pattern in Trading?
- What Is Ichimoku Cloud Strategy? A Complete Trading System
- Mastering Elliott Wave Theory: Rules and Trading Strategies
- News Trading: Strategies, Execution Risks, and Risk Control
- What Is an Iron Condor Options Strategy?
- Backtesting Explained: What It Is and Why It Really Matters
- Grid Trading: Mechanics, Parameters, and Risk Strategies
- What Is Breakout Trading and How Does It Work?
- Mean Reversion: Technical Strategies and Risk Frameworks
- Momentum Trading: Indicators, Strategies, and Risk Control
- Hammer Candlestick: Structure, Meaning, and Strategy
- Doji Candlestick: Types, Signals, and Trading Strategies
- What Is the Sharpe Ratio and How to Calculate It
- What Is VWAP and How Do Traders Use It?
- Trade the Ascending Triangle: A Step-by-Step Practical Guide
- What Is the Stochastic Oscillator and How to Use It
- How to Trade the Descending Triangle Pattern
- High Frequency Trading: Speed, Algorithms, and Market Impact
- What Is Volume Profile and How to Use It in Trading
- What Is a Morning Star Pattern Candlestick?
- Trade with Parabolic SAR: A Practical Analysis Guide
- Evening Star Pattern: Structure, Rules, and Risk Controls
- Kelly Criterion: Formula, Position Sizing, and Risk
- What Is the NYSE Minimum Trading Price? Rules Explained
Disclaimer: The content on this page is intended for educational and informational purposes only. It does not constitute financial, investment, tax, or legal advice, and should not be interpreted as a recommendation to buy, sell, or hold any financial instrument or asset. Trading and investing involve significant risk, including the possible loss of your entire capital. Products such as forex, CFDs, and cryptocurrencies carry additional risks due to leverage, high volatility, and limited regulatory protection in some jurisdictions. Past performance of any financial instrument does not guarantee future results. Any market views, forecasts, or opinions expressed are those of the author at the time of writing and may not reflect current market conditions. Platform features, fees, and regulatory status are subject to change — always verify information directly with the relevant provider or regulator before making any financial decision. BrokerSpecs may receive compensation from third parties featured on this site. Always conduct your own due diligence and consider seeking advice from a licensed financial professional before investing. Portions of this article were prepared with the assistance of AI tools and reviewed by our editorial team before publication.