



Related Tags
You watch an aggressive morning rally drive prices straight toward a multi-week resistance ceiling, pulling eager breakout buyers into the move. Within hours, the momentum stalls abruptly, aggressive sellers slam the price back down to where the session started, and late buyers find themselves trapped. This exact shift in intraday control creates the gravestone doji candlestick, offering traders a clear visual footprint of buyer exhaustion.
What Is a Gravestone Doji Candlestick Pattern?
A gravestone doji candlestick pattern is a bearish reversal candlestick characterized by a long upper shadow and an open, close, and low at virtually the same price. It shows that buyers pushed prices aggressively higher during the session before sellers completely erased those gains.
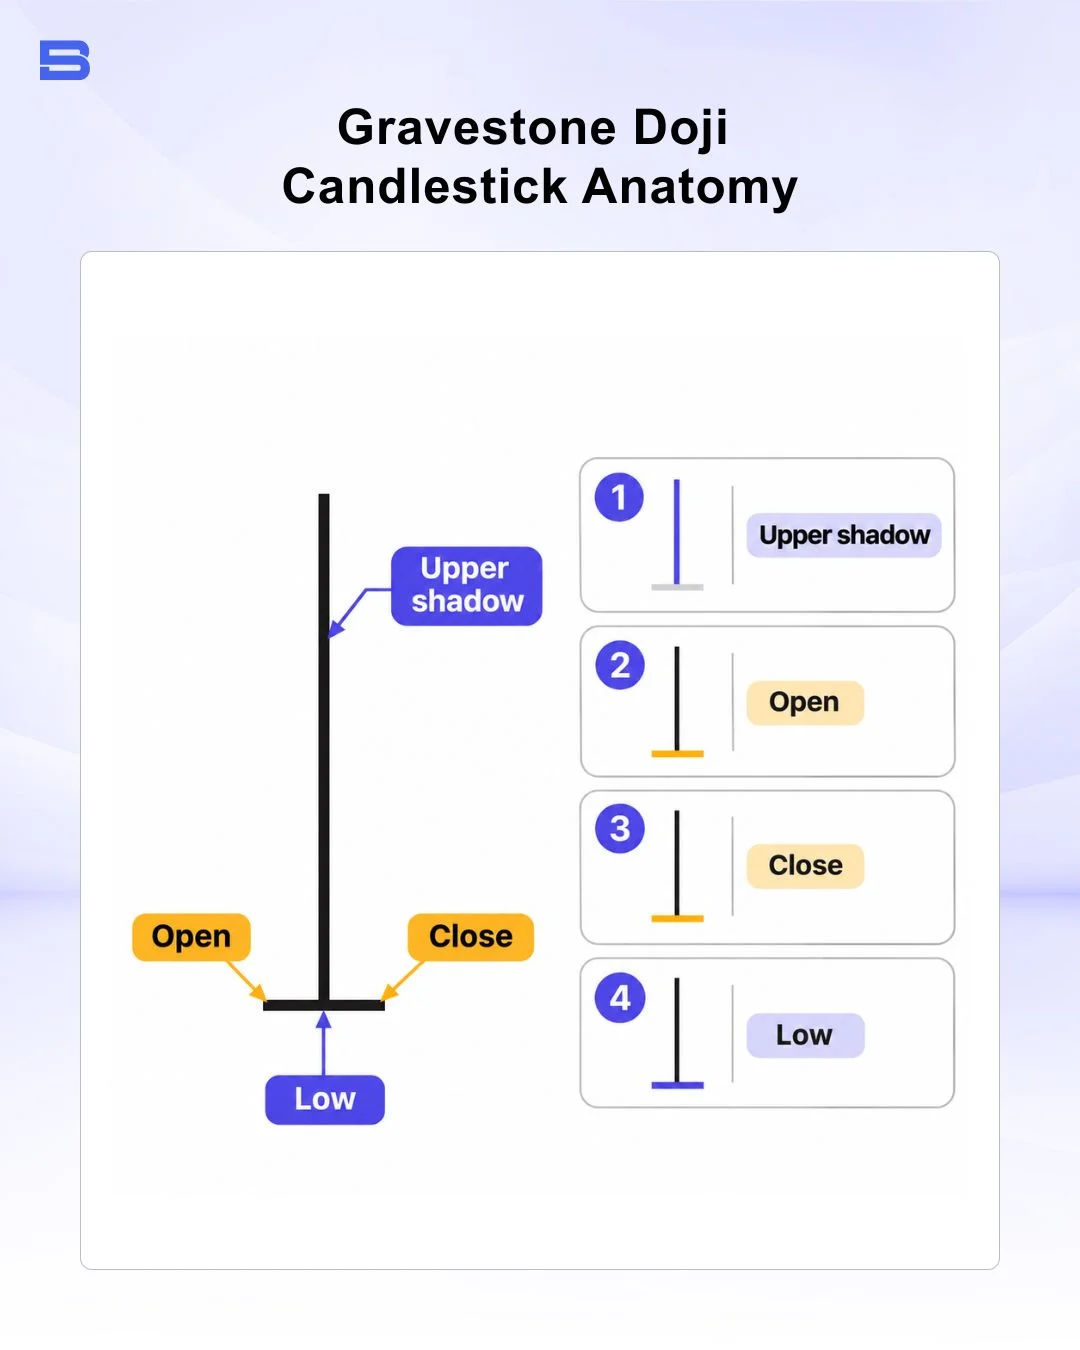
The anatomy of the candle consists of three distinct components:
- Long Upper Shadow: This upper wick must be at least two to three times the length of the candle base, proving that substantial buying occurred before being repelled.
- Virtually Flat Real Body: The opening and closing prices are nearly or entirely identical, appearing as a thin horizontal line at the bottom of the candlestick.
- Absent or Negligible Lower Shadow: The open and close sit directly at the low of the session, signaling that sellers held prices down until the final print.
When you analyze a candlestick chart, this formation visually resembles an inverted "T" or a traditional upright headstone.
Reading Buyer Exhaustion at Key Resistance Levels
A candlestick is simply a visual summary of an order flow struggle. During a gravestone doji, buyers maintain strong upward control early in the session, pushing the market into fresh high ground. However, that upward push likely meets heavy selling or aggressive profit-taking at higher price levels.
By the end of the session, the balance of power shifts completely. Sellers manage to drive the price all the way back down to the session opening print. This dynamic can leave traders who bought near the peak sitting on unrealized losses, which may add downward pressure if they look to exit.
Context determines whether this bearish reversal candlestick carries genuine predictive power or harmless market noise. A gravestone doji forming after an extended multi-week uptrend or directly against major horizontal resistance offers meaningful technical insight. Conversely, when the pattern forms inside choppy, sideways consolidation, it simply reflects indecision rather than a decisive momentum shift.
Key Comparisons: Avoiding Pattern Confusion
Misidentifying candlestick anatomy frequently leads traders to enter poor setups or miscalculate their initial stops. Two patterns in particular are often confused with the gravestone doji.
Gravestone Doji vs. Dragonfly Doji
The gravestone doji and the dragonfly doji represent opposite sides of the same mechanical coin. While both share identical open and close levels, their wick orientation points to opposite directional biases:
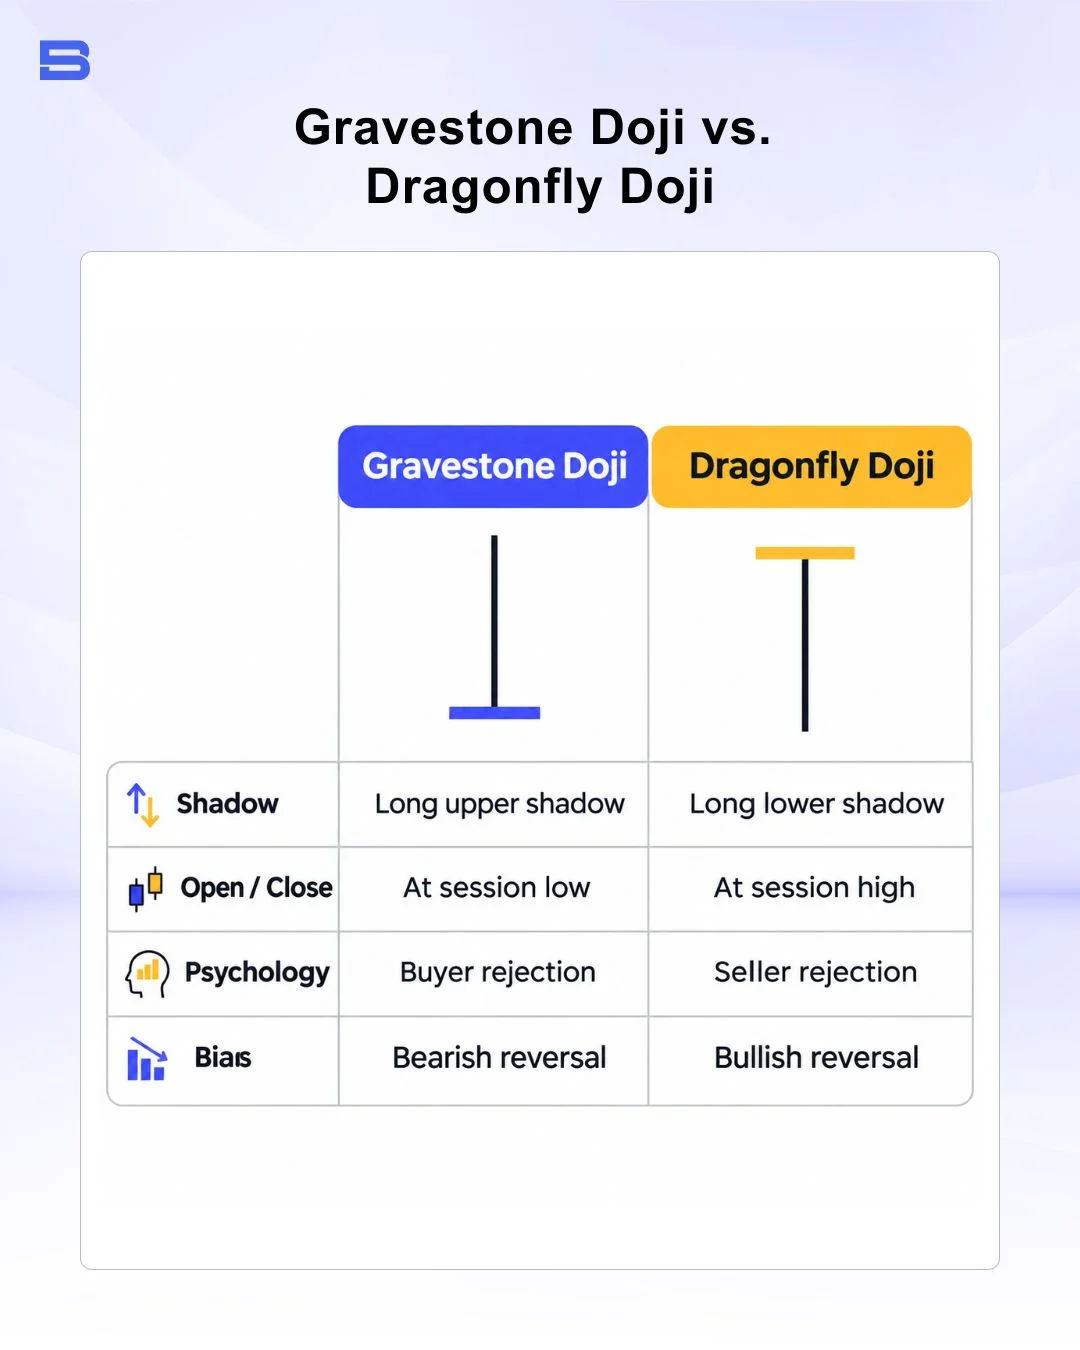
When you contrast this formation with a dragonfly doji candlestick, remember that orientation reflects who won the final closing bell.
Gravestone Doji vs. Shooting Star
Traders often treat a gravestone doji candlestick and a shooting star as interchangeable signals, but their candle structures reveal a slight technical difference.
A shooting star features a small, distinct real body near the bottom of the range, meaning the open and close are close together but clearly separated. A gravestone doji, by contrast, has no meaningful real body because its open, low, and close converge at the same level. While both signal seller intervention at higher prices, the gravestone doji reflects total rejection right back to square one. You can compare this dynamic against a shooting star candlestick to gauge subtle differences in buyer strength.
Gravestone Doji Trading Strategy: Confirmation and Stop-Loss
Trading a gravestone doji requires discipline because opening a short position immediately at the candle close leaves you exposed to false rallies. Professional technical setups rely on multi-candle confirmation to verify that sellers remain in active control.
To execute a gravestone doji trading strategy, look for a subsequent confirmation candle closing decisively below the doji low. This suggests that follow-through selling may be entering the market. For proper risk management, place your initial stop-loss a small buffer above the absolute high of the doji’s upper shadow. If the market pushes above that wick peak, your bearish premise is invalid.
Consider this worked scenario on an equity asset trading against heavy resistance:
- Market Setup: Asset XYZ rallies into major historical resistance at $150.00 and prints a gravestone doji reaching a session high of $154.00, with an open and close at $150.00.
- Entry Execution: You wait for confirmation. The next session closes lower at $148.00, confirming the bearish rotation, where you enter a short trade.
- Stop-Loss Level: You position your protective stop-loss order at $154.50, risking $6.50 per share against pattern invalidation.
- Profit Target: You identify key underlying support at $134.00, representing a potential $14.00 gain per share.
- Risk-to-Reward Outcome: This structure produces a 1:2.15 risk-to-reward ratio on paper. The $134.00 target may not be reached, and a gap or slippage can push the actual loss beyond $6.50 per share.
Before entering, size the position so the planned loss stays within a small, fixed share of your account, and factor in commissions, spreads, and any borrowing or financing costs on the short trade, since these reduce the net gain and add to the loss.
Standard market frameworks remind traders that technical patterns are tools for estimating future price probabilities based on historical market behavior, rather than reliable predictions of certain outcomes, as explained by the CFA Institute Research Foundation in its review of technical analysis.
Limitations and False Signals to Watch For
No single candlestick pattern functions with total reliability. In strong macro bull trends, an isolated gravestone doji is frequently steamrolled as aggressive dip-buyers step back in during subsequent sessions.
Volume serves as an essential filter to help separate valid turnarounds from market traps. A gravestone doji that forms on below-average trading volume often indicates brief illiquidity rather than heavy institutional distribution. Conversely, when the pattern prints alongside a noticeable volume surge, it may point to heavier selling pressure at session highs.
Traders must also account for execution risks such as unexpected market gaps and slippage, which can cause orders to execute at prices significantly different from their pre-planned levels during volatile trading sessions. The US Securities and Exchange Commission (SEC) explains in its investor bulletin on stop orders that the stop price is only a trigger, so the order can fill at a price well away from that level when prices move quickly.
Treating the pattern as one component of a broader trading plan helps protect your capital when reversals fail to materialize.
Key Takeaways for Trading the Gravestone Doji
The gravestone doji candlestick serves as a practical diagnostic tool for identifying when aggressive buyers have run out of steam. By tracking where the market opened, where it tried to go, and where it ultimately settled, you gain an objective view of intraday order flow. Pair the pattern with strict confirmation, volume context, and defined risk controls rather than anticipating market turns on candle shapes alone.
- How to Build an Investment Plan That Actually Works for You?
- What Is the MACD Indicator and How to Use It
- What Is a Wedge Pattern in Trading?
- What Is Ichimoku Cloud Strategy? A Complete Trading System
- Mastering Elliott Wave Theory: Rules and Trading Strategies
- News Trading: Strategies, Execution Risks, and Risk Control
- What Is an Iron Condor Options Strategy?
- Backtesting Explained: What It Is and Why It Really Matters
- Grid Trading: Mechanics, Parameters, and Risk Strategies
- What Is Breakout Trading and How Does It Work?
- Mean Reversion: Technical Strategies and Risk Frameworks
- Momentum Trading: Indicators, Strategies, and Risk Control
- Hammer Candlestick: Structure, Meaning, and Strategy
- Doji Candlestick: Types, Signals, and Trading Strategies
- What Is the Sharpe Ratio and How to Calculate It
- What Is VWAP and How Do Traders Use It?
- Trade the Ascending Triangle: A Step-by-Step Practical Guide
- What Is the Stochastic Oscillator and How to Use It
- How to Trade the Descending Triangle Pattern
- High Frequency Trading: Speed, Algorithms, and Market Impact
- What Is Volume Profile and How to Use It in Trading
- What Is a Morning Star Pattern Candlestick?
- Trade with Parabolic SAR: A Practical Analysis Guide
- Evening Star Pattern: Structure, Rules, and Risk Controls
- Kelly Criterion: Formula, Position Sizing, and Risk
- What Is the NYSE Minimum Trading Price? Rules Explained
Disclaimer: The content on this page is intended for educational and informational purposes only. It does not constitute financial, investment, tax, or legal advice, and should not be interpreted as a recommendation to buy, sell, or hold any financial instrument or asset. Trading and investing involve significant risk, including the possible loss of your entire capital. Products such as forex, CFDs, and cryptocurrencies carry additional risks due to leverage, high volatility, and limited regulatory protection in some jurisdictions. Past performance of any financial instrument does not guarantee future results. Any market views, forecasts, or opinions expressed are those of the author at the time of writing and may not reflect current market conditions. Platform features, fees, and regulatory status are subject to change — always verify information directly with the relevant provider or regulator before making any financial decision. BrokerSpecs may receive compensation from third parties featured on this site. Always conduct your own due diligence and consider seeking advice from a licensed financial professional before investing. Portions of this article were prepared with the assistance of AI tools and reviewed by our editorial team before publication.