



Related Tags
You open your charting platform right after a major economic data release, expecting the usual erratic back-and-forth price swings. Instead, you watch a candle open and march relentlessly in one direction without giving up a single pip of ground.
By the session close, the chart displays a tall, solid rectangle with virtually no upper or lower shadows. In technical analysis, this distinct formation is known as a Marubozu, and it signals that one side of the market held absolute control from the opening bell to the final tick.
What Is a Marubozu Candlestick? Anatomy and Mechanics
A Marubozu is a single-candlestick pattern characterized by a long, full real body with no upper or lower shadows (wicks), signaling that one side of the market controlled price action entirely from open to close.
The word originates from the Japanese term meaning "bald" or "shaven head," reflecting the absence of protruding wicks. On standard candlesticks, wicks represent intraday rejection where opposing market participants pushed prices back toward the center. Formations like the pin bar rely entirely on long shadows to show rejection, while an inside bar reflects short-term consolidation. A Marubozu is the structural opposite:
- Bullish Marubozu: The open price equals the low of the session, and the close price equals the high. Buyers absorbed all available sell orders without letting price dip below the open.
- Bearish Marubozu: The open price equals the high of the session, and the close price equals the low. Sellers hit bids aggressively, absorbing the available buy orders and driving price downward without allowing any bounce.
Because real-world markets carry micro-fluctuations, technical analysts often classify a candle with miniature wicks (less than 5% of the total candle range) as a Marubozu, provided the directional conviction remains clear.
How Market Context Shapes a Marubozu Candlestick Pattern
Beyond individual geometry, a Marubozu candlestick pattern represents a sudden, aggressive liquidity imbalance on the order book. When institutional participants deploy substantial capital, market orders rapidly sweep through passive limit orders, creating an elongated real body.
Context dictates how this price action functions:
- Trend Continuation: When a Marubozu appears in the direction of an established trend, it may support the case for continued momentum. If price has been making higher highs and breaks out of a consolidation zone with a full-bodied candle, it may suggest that larger participants are adding to their positions.
- Trend Reversal: When appearing against a prolonged trend, a Marubozu can signal capitulation (a final wave of panic selling or buying). If an asset has been grinding downward and suddenly forms a large bullish candle engulfing multiple prior sessions, it may suggest that selling pressure is fading and buyers are gaining control.
A full-bodied candle carries no directional value in a vacuum. A Marubozu printed inside a wide horizontal range often traps aggressive retail breakout buyers directly into the opposing boundary. Pairing this candle with broader chart pattern structures helps differentiate real momentum from deceptive volatility spikes.
The Three Types of Marubozu: Open, Close, and Full
While textbook definitions portray a candle with zero wicks, live market execution presents three distinct variations based on where brief hesitation occurred.
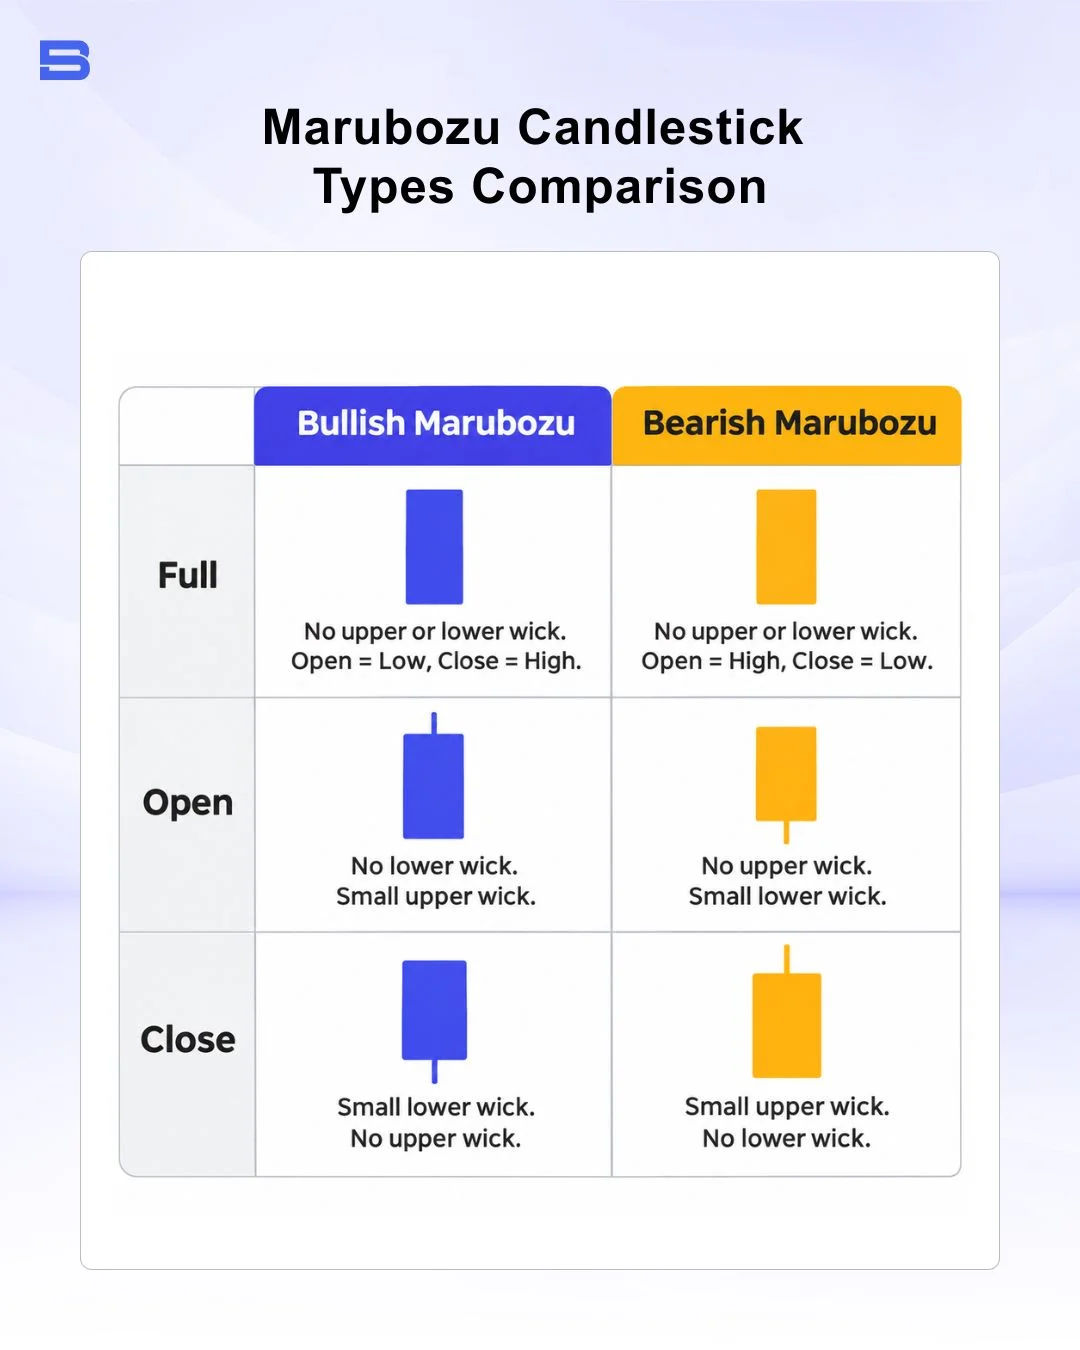
Bullish Marubozu: Buyer Dominance
A bullish Marubozu candlestick reflects aggressive accumulation, appearing across three structural forms:
- Marubozu Full: The candle has no wicks at all. The open is the exact low, and the close is the exact high. Demand was completely unyielding.
- Marubozu Open: A small upper shadow exists, but no lower shadow. Price opened, never traded lower, pushed upward, and experienced mild profit-taking just before the close.
- Marubozu Close: A tiny lower shadow exists, but no upper shadow. Sellers tested lower prices early in the session, but buyers rejected the dip and drove price to close at the absolute high.
Bearish Marubozu: Seller Pressure
A bearish Marubozu reflects sustained distribution (steady selling by larger participants) across the same variations:
- Marubozu Full: No wicks exist. The open is the high, and the close is the low, showing systematic liquidation.
Marubozu Open: A small lower shadow forms. Sellers pushed down from the open, but a slight bid emerged right at the closing bell. - Marubozu Close: A small upper shadow forms. Buyers briefly probed higher after the open before aggressive selling overwhelmed the market, pushing price to close at its bottom.
Sudden momentum shifts often coincide with wider spreads and execution slippage (orders filling at a worse price than expected).
How to Trade a Marubozu Candlestick Without Falling for False Breakouts
Knowing how to trade a Marubozu candlestick requires managing downside risk, because the candle’s sheer length creates a distinct mathematical problem: wide stop-loss placement.
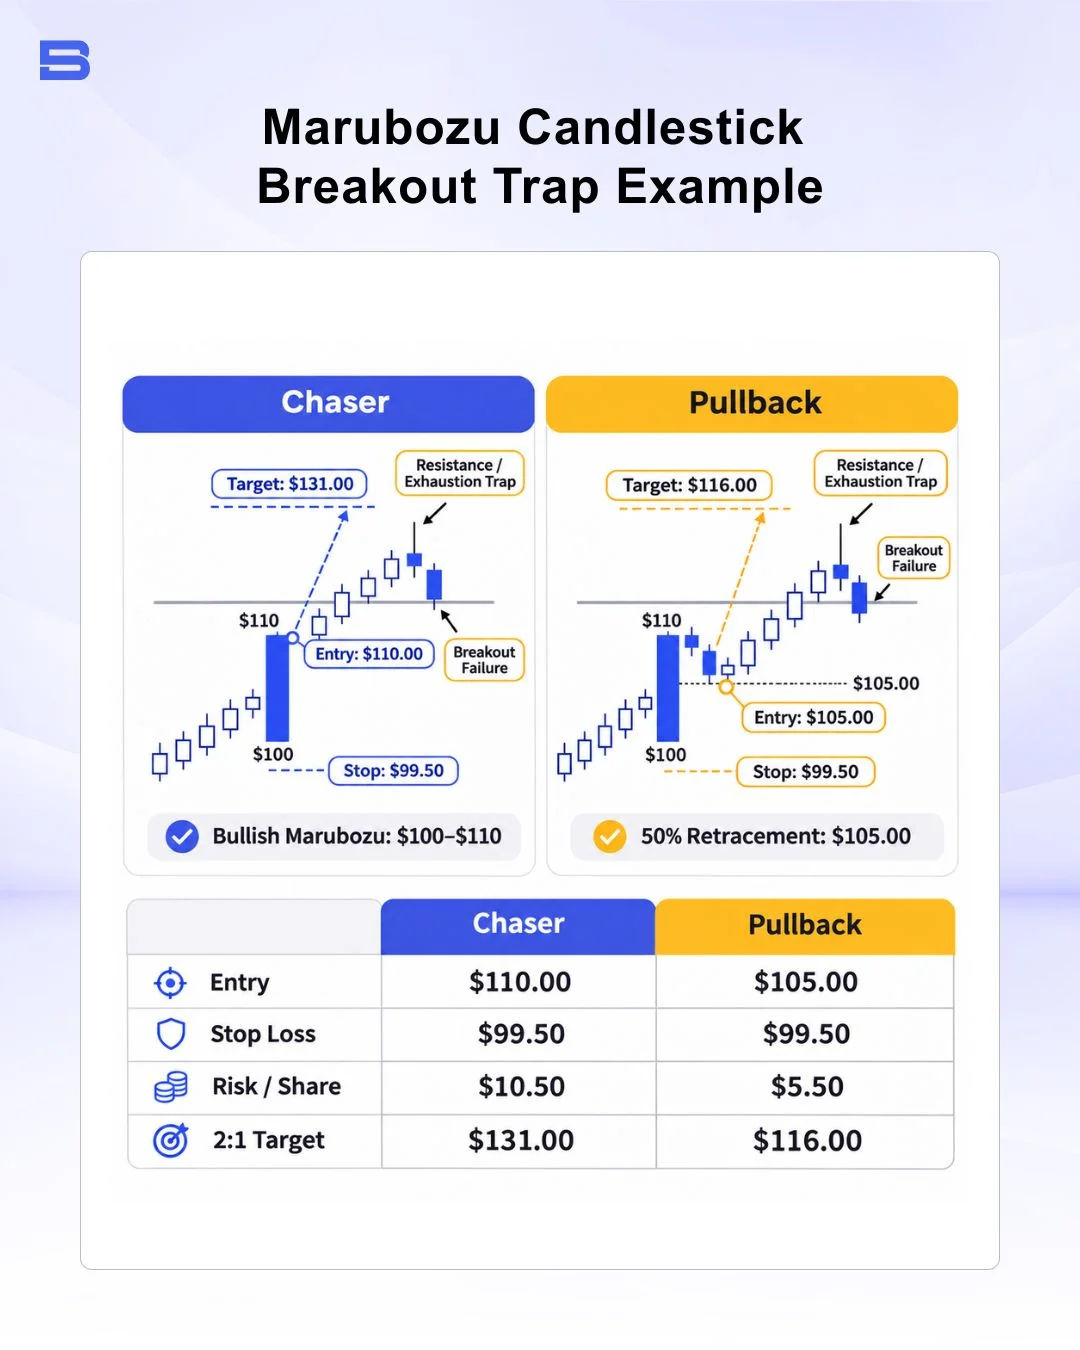
If you buy the instant a 100-pip bullish Marubozu closes, placing a standard technical stop below the candle low means risking slightly more than 100 pips. Achieving a standard 2:1 reward-to-risk ratio then demands a move of more than 200 pips just to justify the entry.
Instead of chasing the close, disciplined price action traders watch for a pullback into the Marubozu body:
- The 50% Retracement Setup: The midpoint of a Marubozu body frequently acts as dynamic support or resistance. When momentum pauses, price may retrace roughly 50% into the candle range, and traders often watch this zone for signs that the move will continue.
- Exhaustion Traps: A large Marubozu that runs directly into higher-timeframe resistance is often an exhaustion move rather than a breakout. When market makers run out of liquidity at key levels, the next session can reverse instantly into a gravestone doji candlestick or dragonfly doji candlestick.
Consider a concrete market scenario:
- Setup: Stock XYZ breaks above a consolidation zone at $100 with a bullish Marubozu closing at $110 (Low: $100, High: $110).
- The Chaser’s Risk: Buying at $110 with a stop at $99.50 risks $10.50 per share. To capture a 2:1 ratio, price must reach $131.00.
- The Disciplined Entry: Place a limit order near the 50% midpoint at $105.00, with a protective stop at $99.50. Risk is now $5.50 per share. A target at $116.00 provides a viable 2:1 return.
- Downside Reality: If price breaks below the $100 opening level, the premise is invalidated, and the position is closed for a measured loss.
Strict, risk-adjusted position sizing is a core principle of risk management, because no candlestick pattern can predict the next session’s outcome with certainty.
The Bottom Line
A Marubozu candlestick shows you exactly what happened during a completed session: one group dominated the order flow and forced price across a wide range without conceding territory. However, a large body reflects past execution rather than a guaranteed future trajectory.
Always anchor your entries around structural pullback levels, size your positions around the wide invalidation points, and never mistake short-term momentum for a directional guarantee.
- How to Build an Investment Plan That Actually Works for You?
- What Is the MACD Indicator and How to Use It
- What Is a Wedge Pattern in Trading?
- What Is Ichimoku Cloud Strategy? A Complete Trading System
- Mastering Elliott Wave Theory: Rules and Trading Strategies
- News Trading: Strategies, Execution Risks, and Risk Control
- What Is an Iron Condor Options Strategy?
- Backtesting Explained: What It Is and Why It Really Matters
- Grid Trading: Mechanics, Parameters, and Risk Strategies
- What Is Breakout Trading and How Does It Work?
- Mean Reversion: Technical Strategies and Risk Frameworks
- Momentum Trading: Indicators, Strategies, and Risk Control
- Hammer Candlestick: Structure, Meaning, and Strategy
- Doji Candlestick: Types, Signals, and Trading Strategies
- What Is the Sharpe Ratio and How to Calculate It
- What Is VWAP and How Do Traders Use It?
- Trade the Ascending Triangle: A Step-by-Step Practical Guide
- What Is the Stochastic Oscillator and How to Use It
- How to Trade the Descending Triangle Pattern
- High Frequency Trading: Speed, Algorithms, and Market Impact
- What Is Volume Profile and How to Use It in Trading
- What Is a Morning Star Pattern Candlestick?
- Trade with Parabolic SAR: A Practical Analysis Guide
- Evening Star Pattern: Structure, Rules, and Risk Controls
- Kelly Criterion: Formula, Position Sizing, and Risk
- What Is the NYSE Minimum Trading Price? Rules Explained
Disclaimer: The content on this page is intended for educational and informational purposes only. It does not constitute financial, investment, tax, or legal advice, and should not be interpreted as a recommendation to buy, sell, or hold any financial instrument or asset. Trading and investing involve significant risk, including the possible loss of your entire capital. Products such as forex, CFDs, and cryptocurrencies carry additional risks due to leverage, high volatility, and limited regulatory protection in some jurisdictions. Past performance of any financial instrument does not guarantee future results. Any market views, forecasts, or opinions expressed are those of the author at the time of writing and may not reflect current market conditions. Platform features, fees, and regulatory status are subject to change — always verify information directly with the relevant provider or regulator before making any financial decision. BrokerSpecs may receive compensation from third parties featured on this site. Always conduct your own due diligence and consider seeking advice from a licensed financial professional before investing. Portions of this article were prepared with the assistance of AI tools and reviewed by our editorial team before publication.