


Related Tags
You are watching a session where aggressive selling pushes an asset down sharply hour after hour, until sudden institutional demand halts the decline and rallies price right back to where it opened. This intraday recovery leaves a distinct visual footprint on the chart and may signal that sellers are losing control of momentum. That distinctive formation is known across technical analysis as the dragonfly doji.
What Is a Dragonfly Doji Candlestick?
A dragonfly doji candlestick is a single-session reversal pattern where the open, high, and close prices are virtually identical at the top of the range.
The defining structural feature of the candle is its long lower shadow, which covers almost the entire session range because the body is absent or nearly absent. Because the open and close occur at the session peak, the candle lacks an upper shadow entirely.
When you look at this structure mechanically, it reveals a wide intraday price range that closed where it opened. Sellers drove price down significantly, but liquidity providers absorbed the volume and forced a complete recovery before the market closed.
What the Dragonfly Doji Candlestick Pattern Tells You About Market Psychology
The dragonfly doji candlestick pattern can reflect a shift in market psychology from persistent selling to renewed buying interest.
In a steady downtrend, sellers expect each breakdown to create follow-through momentum. When a dragonfly doji forms at a key support zone, it may indicate that selling pressure is drying up and that buyers are stepping in to absorb sell orders.
However, technical analysis frameworks published by institutions like the CFA Institute emphasize that single price patterns provide probabilistic tendencies rather than certainty. Unlike a wide-range marubozu candlestick (a candle with a full body and little or no shadow), which shows one-way directional dominance from open to close, the dragonfly doji represents an intraday battle that finished in an equilibrium with an upward bias.
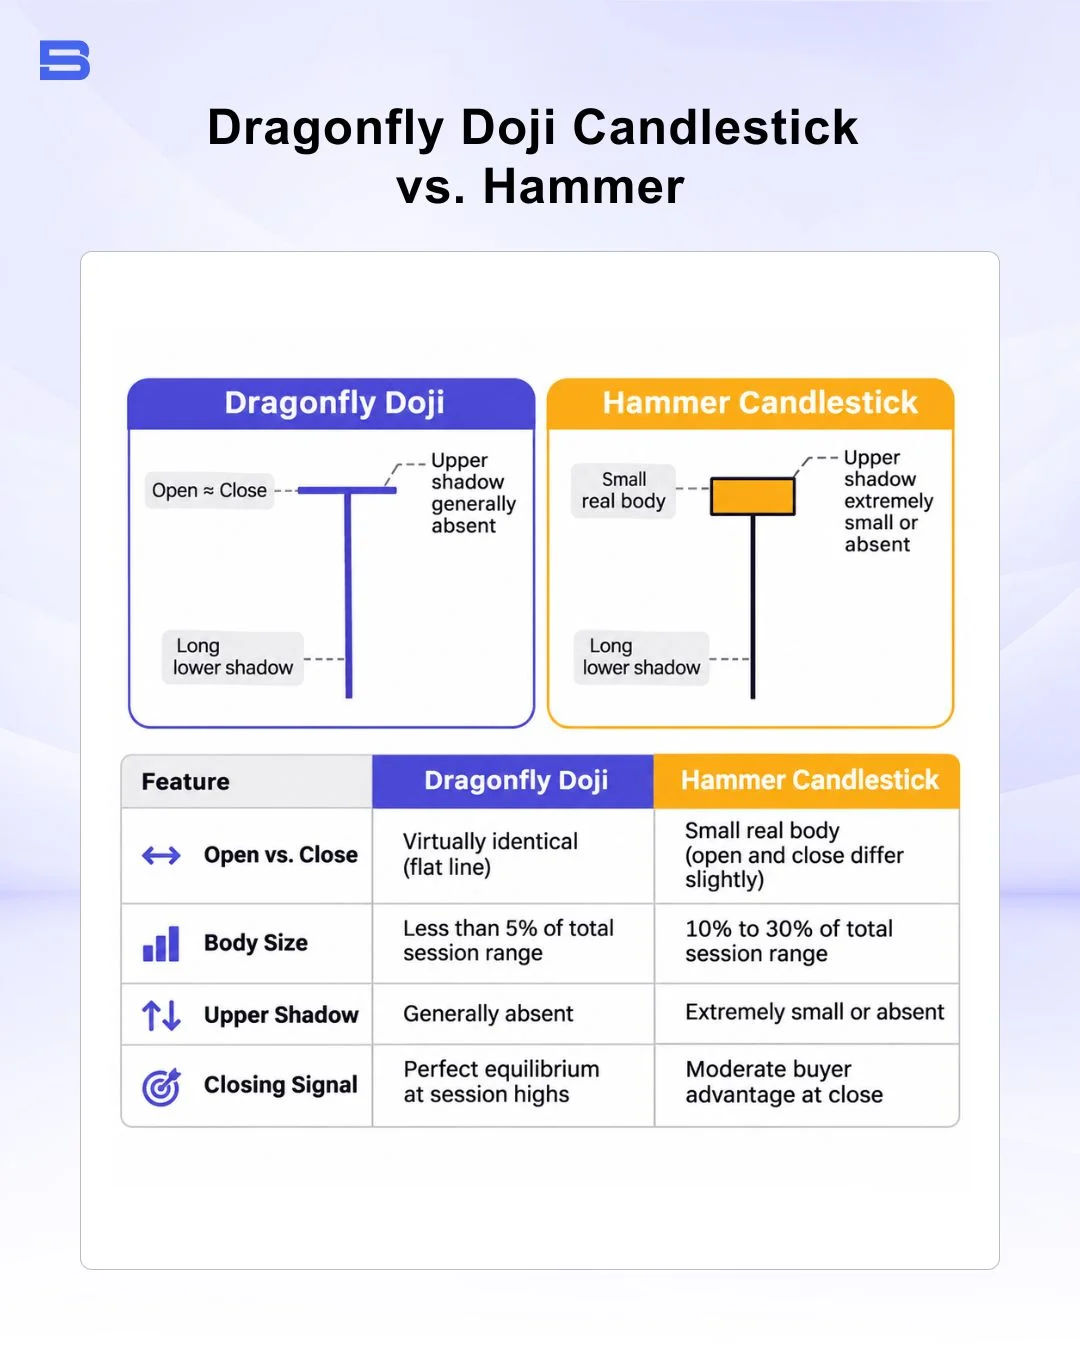
Dragonfly Doji vs. Hammer Candlestick: Structural Differences
Traders frequently confuse the dragonfly doji with the traditional hammer candle because both feature long lower tails following a decline. The primary difference lies in the thickness of the candle body.
Dragonfly Doji vs. Gravestone Doji: Opposite Market Reversals
While the dragonfly doji signals buyer absorption at swing lows, the gravestone doji is its exact structural opposite. A gravestone doji opens and closes at the session low with a long upper shadow, demonstrating that buyers attempted a breakout but were completely overwhelmed by sellers. Where the dragonfly marks potential bullish accumulation, the gravestone warns of exhaustion at resistance.
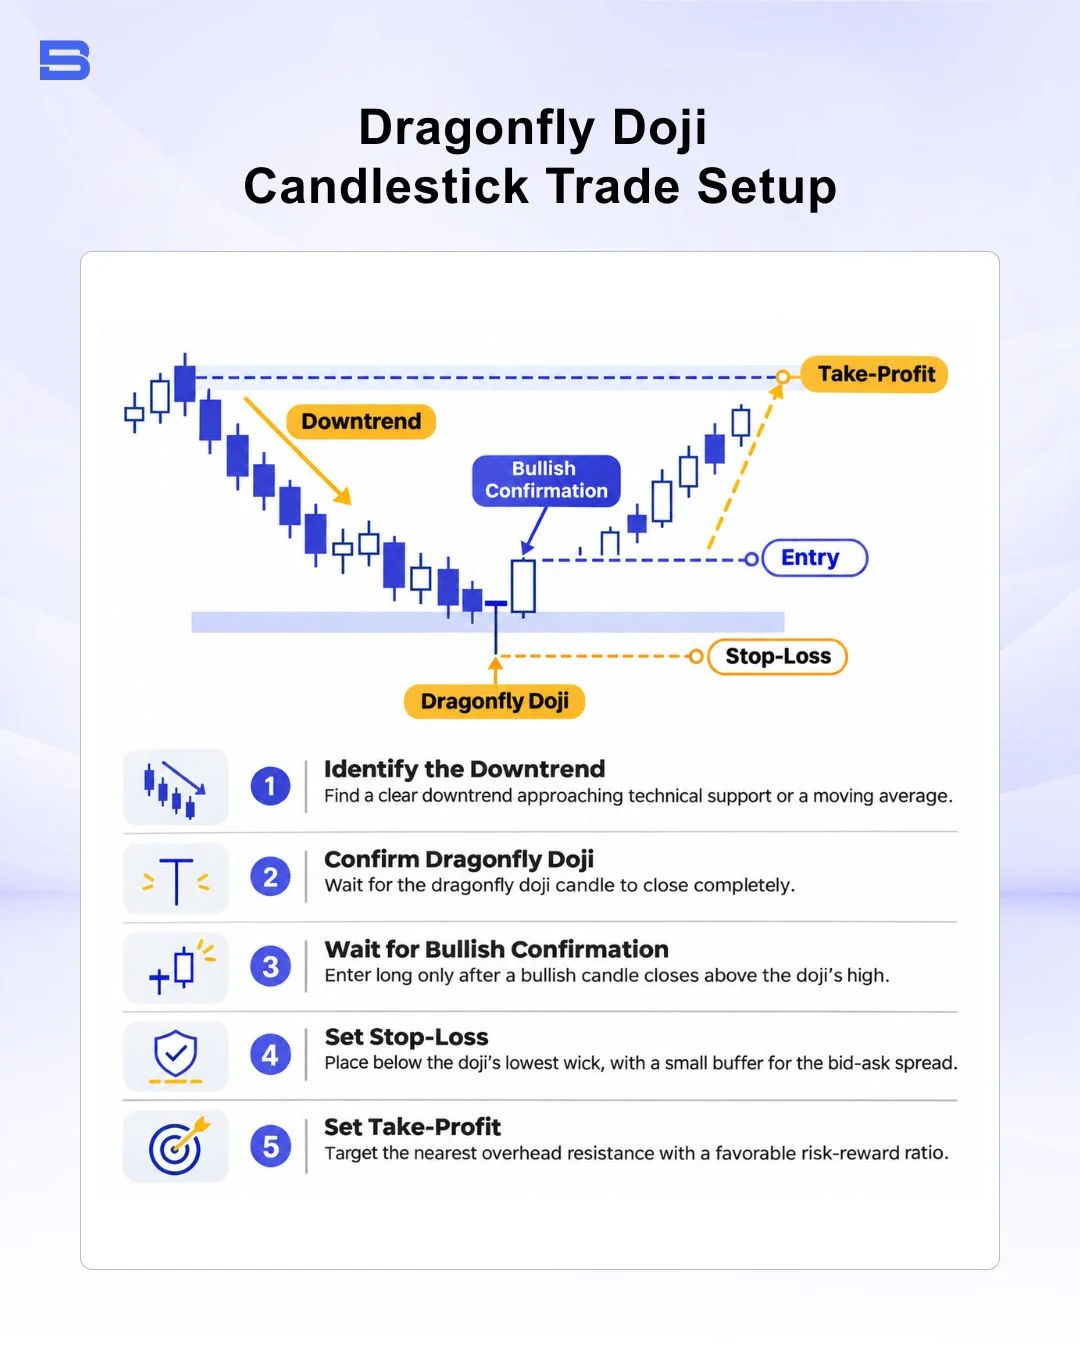
How to Trade the Dragonfly Doji Candlestick: Entry, Stop-Loss, and Risk Management
Trading this pattern effectively requires discipline, proper trade verification, and disciplined order execution.
- Locate a clear structural downtrend where price reaches a known technical support level or moving average.
- Allow the dragonfly doji session to close completely so the candle geometry is confirmed.
- Wait for a bullish confirmation candle to close above the dragonfly doji’s high before opening a long position.
- Calculate your stop-loss placement just below the lowest point of the bottom wick, adding a small buffer to account for your broker’s bid-ask spread.
- Identify a realistic take-profit zone at the nearest overhead resistance level, ensuring a favorable risk-reward ratio.
Consider a practical setup on a currency pair trading at 1.1000. Price sells off intraday to 1.0920 before buyers push the session close back to 1.1000, creating an 80-pip lower tail.
The subsequent candle confirms strength by closing higher at 1.1025. You enter long at 1.1025 with a protective stop placed at 1.0910, risking 115 pips. If overhead resistance sits at 1.1255, your potential gain is 230 pips, establishing an attractive 1:2 risk-reward ratio.
As highlighted in retail trader guidelines from authorities like the Financial Conduct Authority (FCA), uncontrolled position sizing in leveraged markets can rapidly turn manageable drawdowns into severe capital losses.
Limitations, False Breakouts, and Market Traps
A standalone candlestick pattern cannot protect your capital in an aggressive, high-volume markdown.
If broader market conditions are heavily bearish, a dragonfly doji often turns into a false breakout risk where buyers get trapped. Low-liquidity trading hours can also produce distorted doji shapes that lack institutional capital behind them.
To mitigate these traps, never treat a dragonfly doji as an automatic buy trigger. Always look for confluence factors such as higher-timeframe support levels, oversold momentum divergence, and rising volume on the confirmation candle.
Conclusion
The dragonfly doji offers valuable insight into shifts in supply and demand, showing that buyers stepped in during the session to reject lower prices. Pairing this formation with patience, multi-timeframe confluence, and predefined stop levels creates a balanced, systematic framework for navigating market reversals.
- How to Build an Investment Plan That Actually Works for You?
- What Is the MACD Indicator and How to Use It
- What Is a Wedge Pattern in Trading?
- What Is Ichimoku Cloud Strategy? A Complete Trading System
- Mastering Elliott Wave Theory: Rules and Trading Strategies
- News Trading: Strategies, Execution Risks, and Risk Control
- What Is an Iron Condor Options Strategy?
- Backtesting Explained: What It Is and Why It Really Matters
- Grid Trading: Mechanics, Parameters, and Risk Strategies
- What Is Breakout Trading and How Does It Work?
- Mean Reversion: Technical Strategies and Risk Frameworks
- Momentum Trading: Indicators, Strategies, and Risk Control
- Hammer Candlestick: Structure, Meaning, and Strategy
- Doji Candlestick: Types, Signals, and Trading Strategies
- What Is the Sharpe Ratio and How to Calculate It
- What Is VWAP and How Do Traders Use It?
- Trade the Ascending Triangle: A Step-by-Step Practical Guide
- What Is the Stochastic Oscillator and How to Use It
- How to Trade the Descending Triangle Pattern
- High Frequency Trading: Speed, Algorithms, and Market Impact
- What Is Volume Profile and How to Use It in Trading
- What Is a Morning Star Pattern Candlestick?
- Trade with Parabolic SAR: A Practical Analysis Guide
- Evening Star Pattern: Structure, Rules, and Risk Controls
- Kelly Criterion: Formula, Position Sizing, and Risk
- What Is the NYSE Minimum Trading Price? Rules Explained
Disclaimer: The content on this page is intended for educational and informational purposes only. It does not constitute financial, investment, tax, or legal advice, and should not be interpreted as a recommendation to buy, sell, or hold any financial instrument or asset. Trading and investing involve significant risk, including the possible loss of your entire capital. Products such as forex, CFDs, and cryptocurrencies carry additional risks due to leverage, high volatility, and limited regulatory protection in some jurisdictions. Past performance of any financial instrument does not guarantee future results. Any market views, forecasts, or opinions expressed are those of the author at the time of writing and may not reflect current market conditions. Platform features, fees, and regulatory status are subject to change — always verify information directly with the relevant provider or regulator before making any financial decision. BrokerSpecs may receive compensation from third parties featured on this site. Always conduct your own due diligence and consider seeking advice from a licensed financial professional before investing. Portions of this article were prepared with the assistance of AI tools and reviewed by our editorial team before publication.