


Related Tags
You watch an asset test a multi-week resistance level on your screen. The standard technical setup looks pristine: momentum oscillators indicate upside expansion, and a breakout candle closes decisively above the boundary. You buy the breakout, only to watch the market abruptly stall, roll over, and trigger your stop-loss within three minutes.
That sudden reversal was not bad luck. Behind that candlestick, hundreds of aggressive buy contracts ran into a large wall of passive sell limit orders that absorbed every unit of incoming liquidity. While derived chart indicators signaled a continuation, the underlying transaction data showed the exact moment buying pressure died. This is the realm of order flow trading: stepping past delayed chart patterns to observe the raw, mechanical exchange of contracts as they execute in real time.
What Is Order Flow in Trading and How Does It Work?
Order flow trading is the analysis of actual transaction volume and resting liquidity to evaluate immediate supply and demand imbalances.
Centralized exchanges, such as futures and stock exchanges, run a continuous double auction that matches buyers and sellers through one shared order book. Spot forex and most CFDs trade over the counter, so the volume and depth figures a broker displays reflect only its own price feed, not the full market.
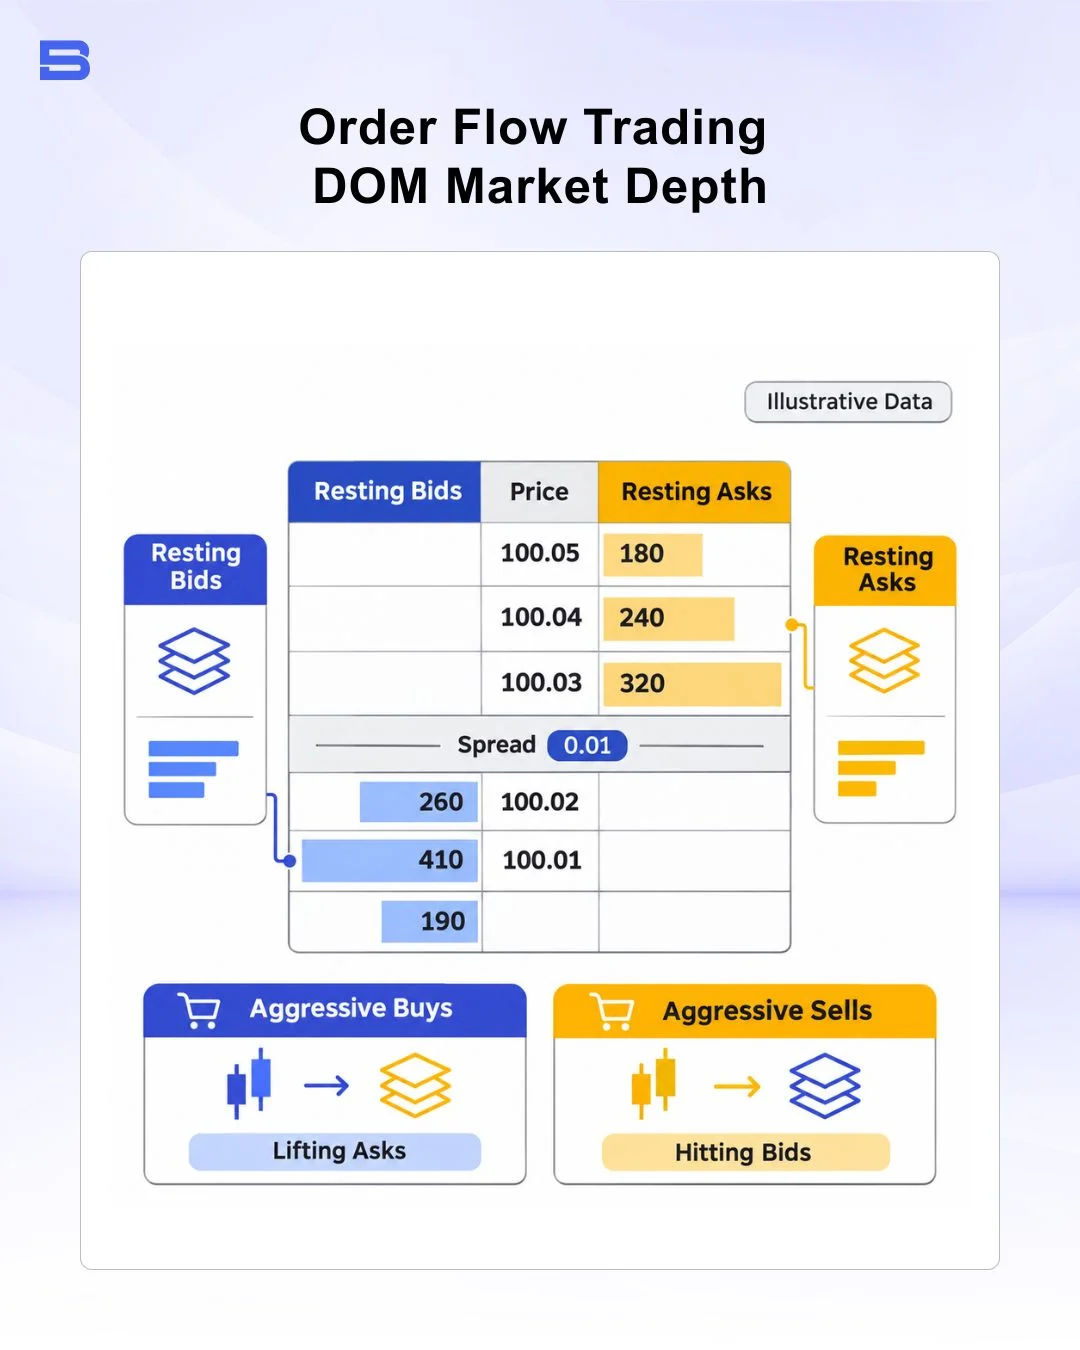
Passive traders submit limit orders to an exchange’s order book. These orders populate the market depth as bids (willing buyers below market) and asks (willing sellers above market), establishing the bid-ask spread. Crucially, passive limit orders do not move market prices on their own. They provide the liquidity that allows transactions to happen.
Price changes require aggressive market participants. When an institution or retail trader submits a market order, that order executes immediately against the best available passive limit order on the book. If aggressive buyers purchase more contracts than existing sellers offer at the current ask price, that ask price is cleared. The market must then lift to the next available price tier to find more passive sellers.
Order Flow vs. Technical Analysis: Cause vs. Effect
Traditional technical indicators—such as moving averages, Relative Strength Index (RSI), or Moving Average Convergence Divergence (MACD)—are mathematical transformations of past price history. They illustrate what price has already done over preceding intervals.
Order flow, by contrast, tracks the direct causal force behind price movements. Price movement is the secondary effect. The primary cause is the volume of aggressive market orders consuming passive liquidity at specific levels. While technical analysis helps chart multi-week context, order flow allows you to verify whether real buying or selling pressure actually materializes at those designated technical levels.
Core Order Flow Trading Tools: DOM, Tape, and Cumulative Delta
Order flow trading requires specialized tools capable of unpacking exchange data feeds. Retail traders utilizing standard charting software typically see volume as a single vertical bar beneath price. Order flow traders rely on three primary instruments to unpack that transaction data.
Depth of Market (DOM) Mechanics and Algorithmic Spoofing
The Depth of Market (DOM), often called the price ladder or Level 2 depth, displays resting limit orders queued across price tiers above and below current market value.
While the DOM reveals where passive liquidity resides, it carries distinct execution hazards. Algorithms deployed in statistical arbitrage and high-frequency market-making frequently flash large limit orders with no intention of letting them fill.
This practice, known as spoofing or phantom liquidity, involves posting large resting bids to give an illusion of support, only to cancel them milliseconds before incoming market orders arrive. Relying solely on resting DOM depth without verifying execution on the tape exposes traders to severe false signals.
Interpreting Cumulative Volume Delta (CVD) and Divergence
To isolate true execution from passive intent, traders turn to the Time & Sales window (the tape) and Cumulative Volume Delta (CVD). Every filled contract is stamped as either an aggressive buy (buyer lifted the ask) or an aggressive sell (seller hit the bid).
Delta measures the net difference between aggressive buying volume and aggressive selling volume across a specific timeframe:
Delta = Aggressive Buy Volume - Aggressive Sell Volume
CVD plots a continuous running total of this delta across the trading session. CVD divergences provide significant contextual clues. If an index pushes to a new session high while CVD slopes downward, aggressive buyers may be stepping back. The upward push may then be running on thin liquidity rather than aggressive demand, which can warn of a possible exhaustion reversal.
Identifying Order Flow Absorption and Exhaustion Patterns
The interaction between aggressive volume and passive liquidity creates two primary reversal patterns: exhaustion and absorption.
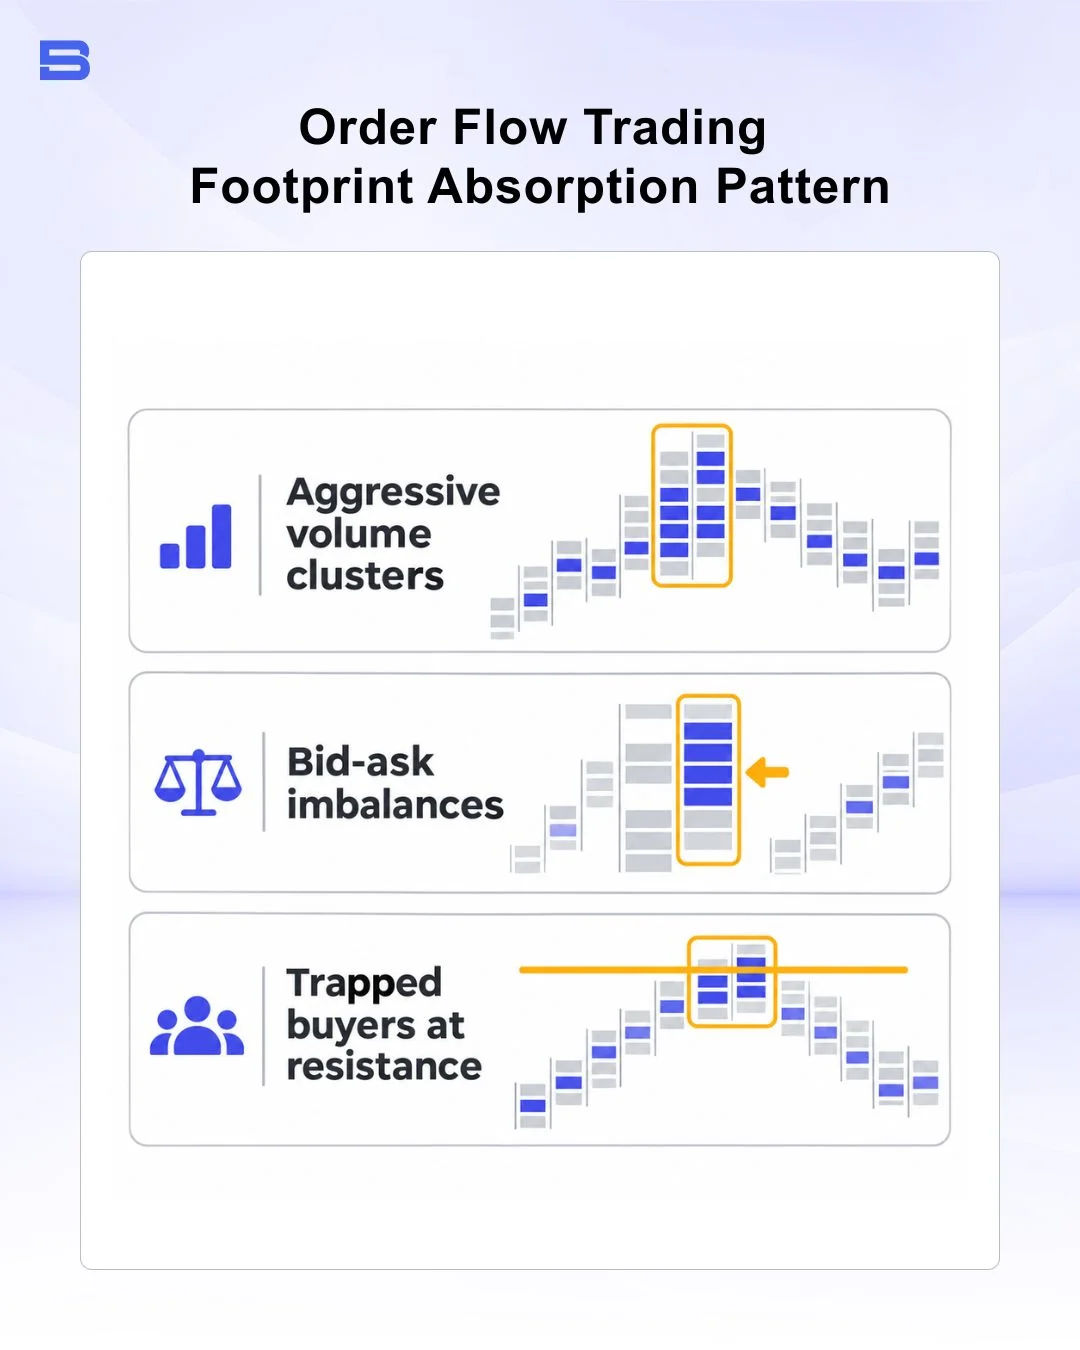
Exhaustion occurs when market participants simply lose interest in chasing prices higher or lower. On a footprint chart (which splits individual candles into bid-side and ask-side executed volume clusters), exhaustion shows up as tiny volume numbers at swing extremes. When buyers refuse to lift the ask at new highs, even light selling pressure may be enough to drop price back down.
Absorption is a far more aggressive dynamic. It occurs when a dominant institutional participant places large passive limit orders to defend a specific level, soaking up incoming market orders without yielding a single tick.
Worked Scenario: Institutional Absorption at Resistance
Consider a trader tracking an equity index futures contract at a key resistance level of 5,500.00:
- The Influx: Price hits 5,500.00. Over 30 seconds, retail breakout algorithms fire, driving 250 aggressive market buy contracts into the market.
- The Defense: On the footprint chart, 250 contracts print on the ask column at 5,500.00. However, the price does not tick up to 5,500.25. A passive institutional seller has parked sufficient limit orders to absorb all 250 contracts.
- The Trapped Volume: Aggressive buyers realize the price cannot advance. As momentum stalls, sellers submit market sell orders. The price rapidly drops 15 ticks to 5,496.25.
- Execution Reality: If you had bought that breakout at 5,500.00, your trade is immediately submerged. Attempting to exit with a market stop-loss order in this fast-moving environment often results in adverse slippage, exiting you at 5,495.50 instead of your intended stop price.
Entering based on order flow requires strict position sizing. Because order flow tools operate at the tick level, high market volatility can whip through stops rapidly, so keep position sizes small enough that slippage, exchange fees, and wider spreads do not turn a normal stop-out into an outsized loss. Index futures and CFDs are traded on margin, so leverage magnifies both gains and losses, and slippage on a fast move can push a loss beyond the amount you planned to risk.
How Institutional Participants Drive Trading Order Flow Mechanics
Large asset managers, hedge funds, and market makers operate under significant execution constraints. Unlike retail traders who trade 1 to 10 contracts at a time, an institution moving 5,000 contracts cannot simply click "buy at market." Doing so would tear through the order book, creating significant slippage and self-inflicted execution losses.
According to global turnover analyses published by institutions such as the Bank for International Settlements (BIS), institutional order execution relies heavily on algorithmic liquidity slicing. Institutions deploy execution algorithms, such as time-weighted average price (TWAP) and volume-weighted average price (VWAP) algorithms, to split large parent orders into hundreds of smaller child orders, often placed as iceberg orders.
An iceberg order displays a passive bid for only 10 contracts on the public DOM, but programmatically reloads with another 10 contracts each time the displayed tranche fills, silently absorbing thousands of opposing market orders.
Dark Pool Trading vs. Displayed Order Flow: The Hidden Liquidity
A major structural blind spot in order flow trading is off-exchange execution. In equity markets, a substantial portion of institutional volume executes through alternative trading systems known as dark pools.
Regulatory disclosures governed by the US Securities and Exchange Commission (SEC) require dark pools to report transactions to trade reporting facilities, but these off-exchange venues do not display pre-trade resting quotes to the public DOM.
Because dark pool orders match privately without pre-trade transparency, retail order flow tools only record the prints after execution has taken place. This data lag means that the order books of lit exchanges (public venues that display their quotes) provide only a partial picture of total institutional liquidity.
Integrating Price Action Trading with Footprint Confluence
Attempting to trade every micro-imbalance on a footprint chart leads directly to overtrading and capital erosion. Every minute of the trading day features hundreds of minor bid-ask imbalances.
To build a reliable workflow, you must blend higher-timeframe price action trading with order flow execution triggers:
- Macro Context First: Establish high-probability market structure, daily value areas (the price ranges where most of the previous day’s volume traded), and multi-day support or resistance zones on your standard candlestick charts.
- Micro Confirmation Second: When price tests your designated zone, look at the footprint chart and DOM for confirmation. Are aggressive traders being absorbed, or is the level clearing out with high delta?
- Execution & Risk Management: Enter only after confirming that aggressive pressure has failed. Anchor your stop-loss just beyond the absorbed volume cluster, where the structural thesis is invalidated.
Conclusion
Understanding order flow trading allows traders to look beyond price movements and examine the buying and selling pressure driving market activity. By analyzing tools such as volume delta, footprint charts, Cumulative Volume Delta (CVD), and the order book, traders can identify potential shifts in market sentiment, liquidity imbalances, and areas of strong buying or selling interest.
However, order flow signals should not be treated as guaranteed predictions. Combining real-time order flow data with price action, market structure, and disciplined risk management can help traders make more informed decisions and improve their overall trading strategy.
- How to Build an Investment Plan That Actually Works for You?
- What Is the MACD Indicator and How to Use It
- What Is a Wedge Pattern in Trading?
- What Is Ichimoku Cloud Strategy? A Complete Trading System
- Mastering Elliott Wave Theory: Rules and Trading Strategies
- News Trading: Strategies, Execution Risks, and Risk Control
- What Is an Iron Condor Options Strategy?
- Backtesting Explained: What It Is and Why It Really Matters
- Grid Trading: Mechanics, Parameters, and Risk Strategies
- What Is Breakout Trading and How Does It Work?
- Mean Reversion: Technical Strategies and Risk Frameworks
- Momentum Trading: Indicators, Strategies, and Risk Control
- Hammer Candlestick: Structure, Meaning, and Strategy
- Doji Candlestick: Types, Signals, and Trading Strategies
- What Is the Sharpe Ratio and How to Calculate It
- What Is VWAP and How Do Traders Use It?
- Trade the Ascending Triangle: A Step-by-Step Practical Guide
- What Is the Stochastic Oscillator and How to Use It
- How to Trade the Descending Triangle Pattern
- High Frequency Trading: Speed, Algorithms, and Market Impact
- What Is Volume Profile and How to Use It in Trading
- What Is a Morning Star Pattern Candlestick?
- Trade with Parabolic SAR: A Practical Analysis Guide
- Evening Star Pattern: Structure, Rules, and Risk Controls
- Kelly Criterion: Formula, Position Sizing, and Risk
- What Is the NYSE Minimum Trading Price? Rules Explained
Disclaimer: The content on this page is intended for educational and informational purposes only. It does not constitute financial, investment, tax, or legal advice, and should not be interpreted as a recommendation to buy, sell, or hold any financial instrument or asset. Trading and investing involve significant risk, including the possible loss of your entire capital. Products such as forex, CFDs, and cryptocurrencies carry additional risks due to leverage, high volatility, and limited regulatory protection in some jurisdictions. Past performance of any financial instrument does not guarantee future results. Any market views, forecasts, or opinions expressed are those of the author at the time of writing and may not reflect current market conditions. Platform features, fees, and regulatory status are subject to change — always verify information directly with the relevant provider or regulator before making any financial decision. BrokerSpecs may receive compensation from third parties featured on this site. Always conduct your own due diligence and consider seeking advice from a licensed financial professional before investing. Portions of this article were prepared with the assistance of AI tools and reviewed by our editorial team before publication.