


Related Tags
Staring at a fast-moving price chart filled with rapid candlestick spikes and sudden reversals can make it difficult to determine where the market is actually heading. Noise from short-term volatility frequently masks the underlying direction, causing traders to enter positions based on temporary fluctuations rather than the broader structure. To cut through this market noise, retail traders and institutional market participants rely on technical indicators designed to smooth out price data over time.
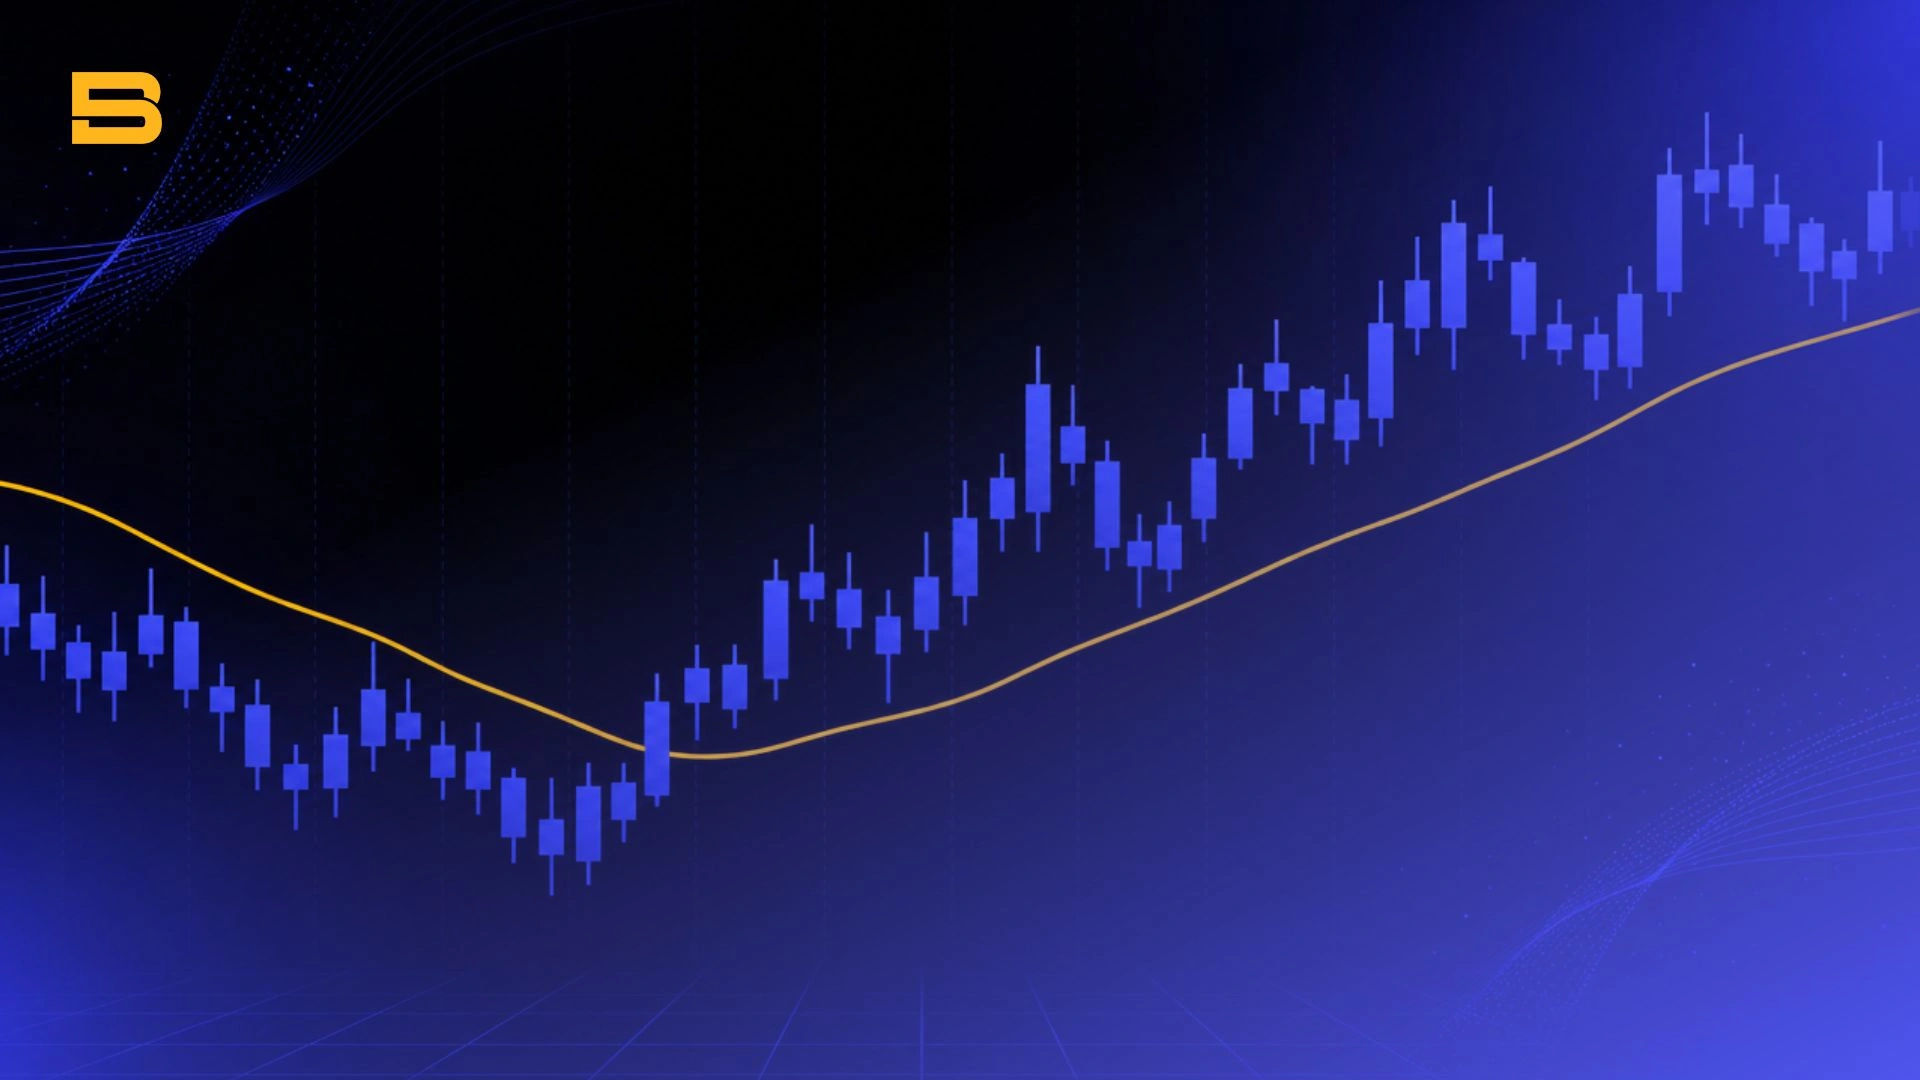
Among these tools, the Simple Moving Average (SMA) remains one of the most fundamental calculations in technical analysis. By averaging historical prices over a chosen duration, the SMA creates a single, continuous line that reveals the core trend of an asset.
What Is a Simple Moving Average (SMA)?
An SMA is an unweighted technical indicator that calculates the average closing price of an asset over a specified number of time periods to smooth out short-term market noise.
Unlike specialized indicators that favor recent price action, the SMA assigns equal importance to every data point within its designated period. Whether analyzing daily, hourly, or 5-minute charts, each closing price contributes identically to the final line. The indicator is described as "moving" because it recalculates dynamically with each completed bar: as a new price bar closes, its price is added to the calculation, and the oldest price point in the sequence drops off.
Because the indicator relies entirely on historical closing data, it functions strictly as a lagging indicator. It does not predict future price movements or forecast upcoming market turns; rather, it confirms existing trend direction and highlights structural support or resistance levels. Broad economic context, such as baseline global macro shifts monitored by institutions like the International Monetary Fund (IMF), frequently dictates whether a long-term SMA trend remains intact or begins to flatten out.
How to Calculate Simple Moving Average (SMA Formula)
Calculating a Simple Moving Average involves basic arithmetic. To find the SMA value for any given period, sum the closing prices of the asset over the specified timeframe and divide that sum by the total number of periods.
The mathematical formula is expressed as:
SMA = (P_1 + P_2 + P_3 + … + P_n) / n
Where P represents the closing price for each period, and n represents the total number of periods in the calculation.
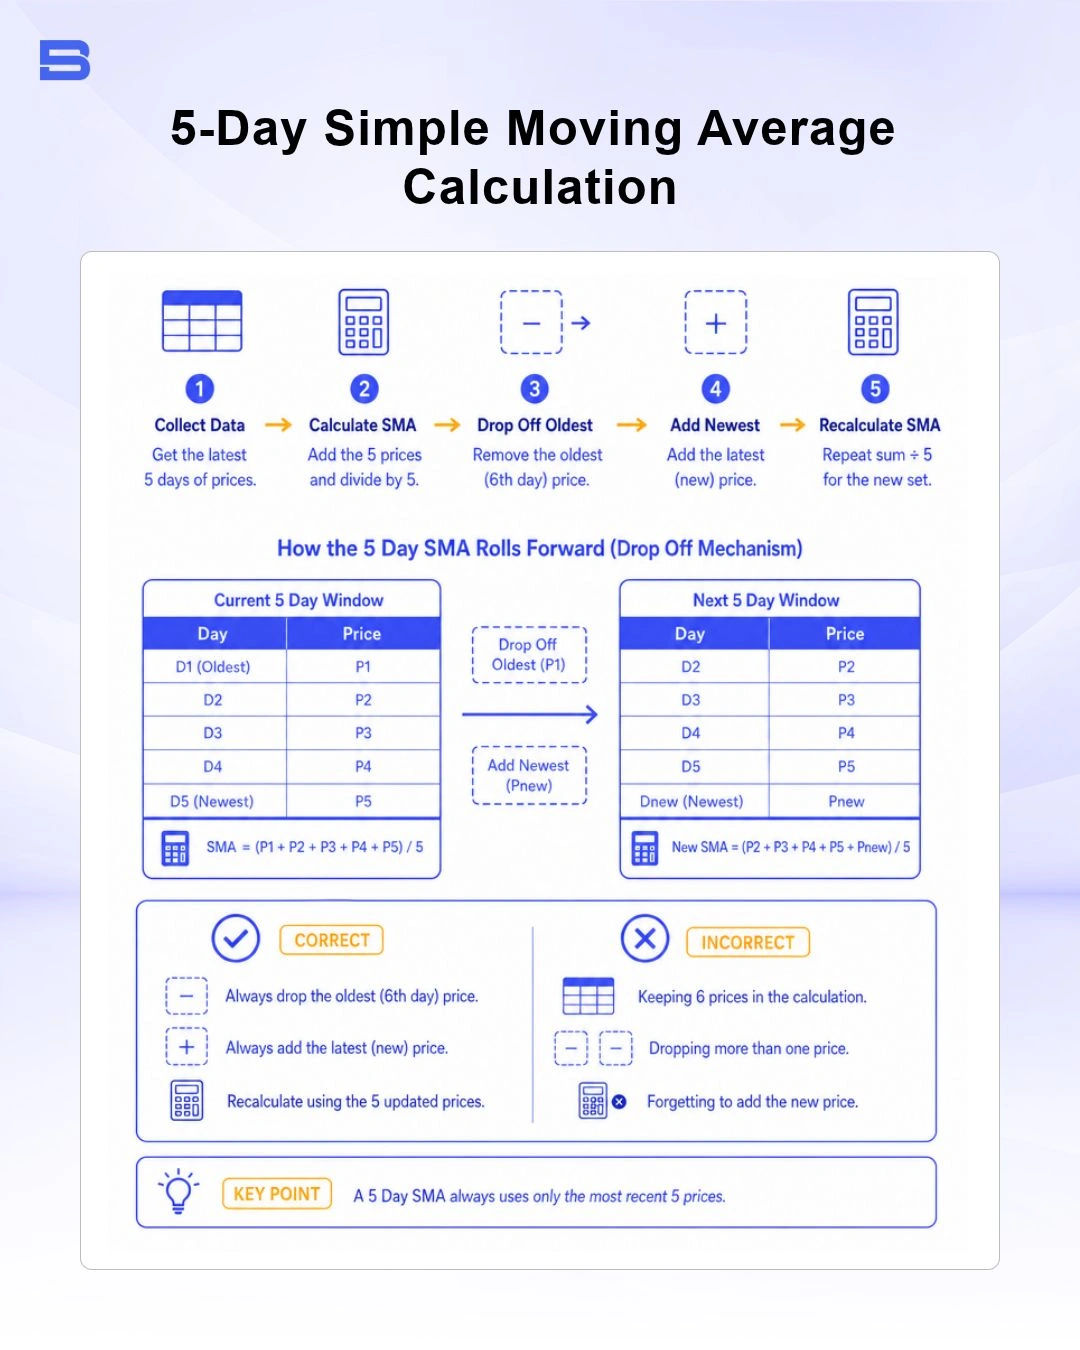
Step-by-Step Calculation Example
To understand how old price data drops off as new data arrives, consider a stock evaluated over six consecutive daily closes:
- Day 1: $100
- Day 2: $102
- Day 3: $101
- Day 4: $105
- Day 5: $107
- Day 6: $110
To calculate the 5-day SMA on Day 5, sum the closing prices of Days 1 through 5 and divide by 5:
SMA_Day 5 = (100 + 102 + 101 + 105 + 107) / 5 = 515 / 5 = 103.00
When Day 6 closes at $110, the 5-day SMA recalculates. Day 1 ($100) drops off the calculation entirely, and Day 6 ($110) takes its place:
SMA_Day 6 = (102 + 101 + 105 + 107 + 110) / 5 = (525) / 5 = 105.00
The SMA line rises from $103.00 to $105.00, reflecting the higher closing price replacing the older, lower price point.
How Traders Use Simple Moving Average (SMA) in Technical Analysis
Traders incorporate SMAs into their strategies primarily to identify market trends and mark dynamic levels where price action might react. When price trades consistently above a moving average, the market is generally considered to be in an uptrend; conversely, prices holding below an SMA point to an established downtrend.
Key SMA Periods: 20, 50, and 200 Days
Different SMA lookback periods serve distinct analytical functions across various trading styles:
- 20-Period SMA (Short-Term): Popular among short-term traders and swing traders to track immediate momentum and short-term trend strength.
- 50-Period SMA (Medium-Term): Serves as an indicator of medium-term market direction. Pullbacks to a rising 50 SMA often act as dynamic support in healthy trends.
- 200-Period SMA (Long-Term Benchmark): Watched closely by institutional investors, global asset managers, and standards bodies like the CFA Institute to determine macro market health. Assets trading above their 200-day SMA are widely categorized in bull territory, while those below are regarded as being in bear territory.
SMA Crossover Strategies: Golden Cross and Death Cross
Crossover strategies involve plotting two moving averages with different time lengths—typically a shorter-term average alongside a longer-term benchmark.
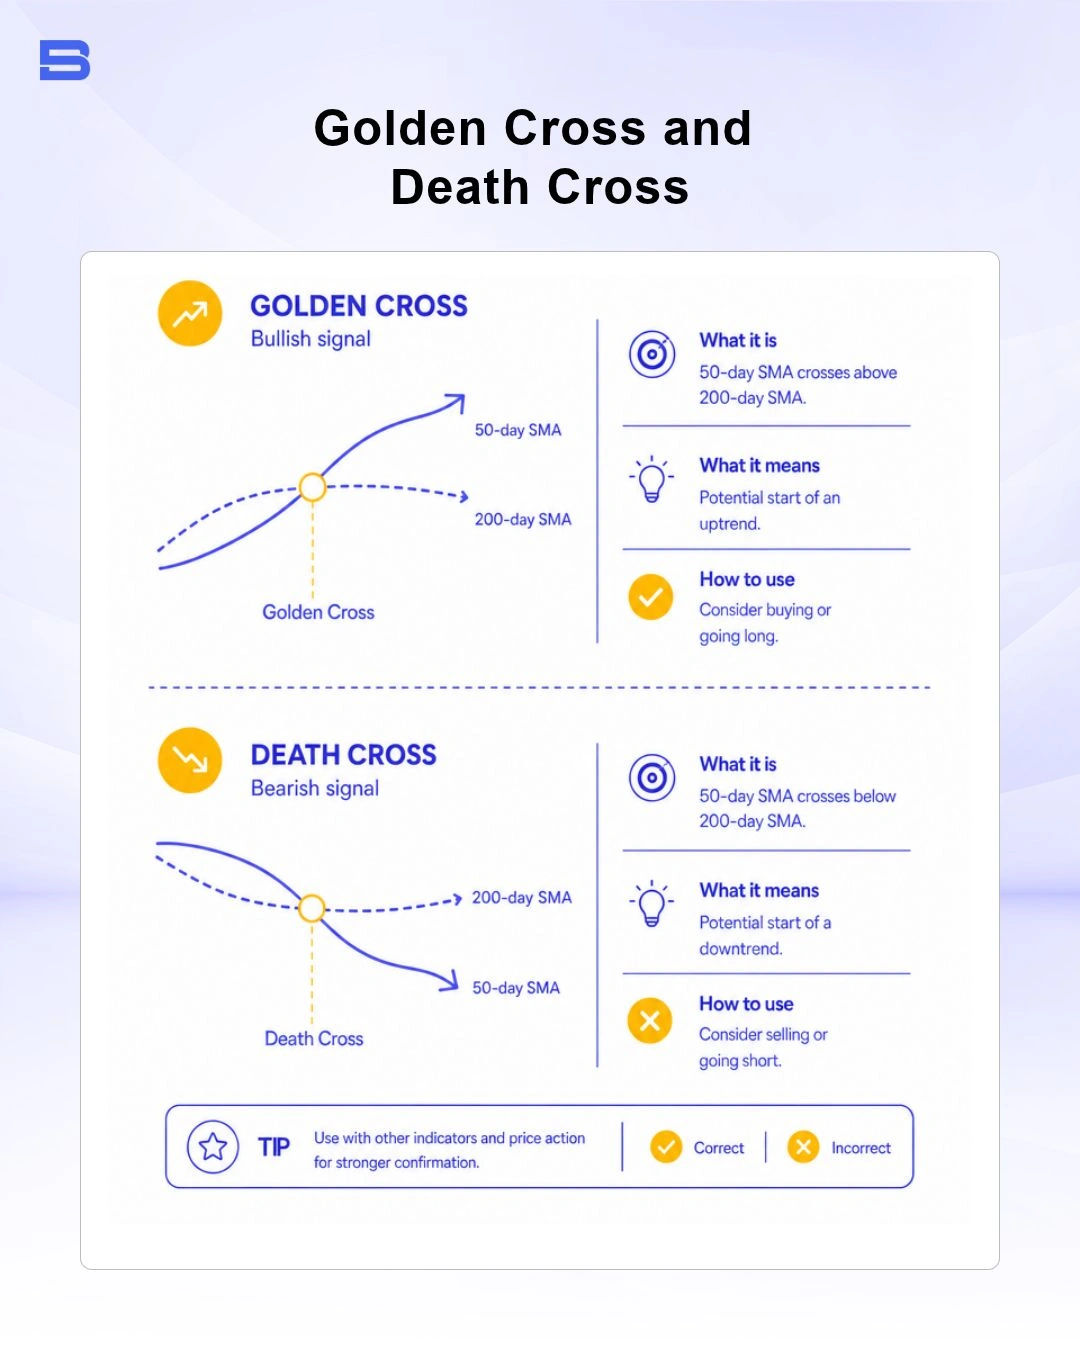
- Golden Cross: Occurs when a shorter-term moving average (such as the 50-day SMA) crosses above a longer-term moving average (such as the 200-day SMA). Technical analysts interpret this event as a potential shift toward a long-term bullish market.
- Death Cross: Occurs when the 50-day SMA crosses below the 200-day SMA. This signal warns of developing bearish momentum and potential extended declines.
Because moving averages rely strictly on historical price data, crossovers occur well after a price turn has already begun. Treating crossovers as absolute timing signals can lead to late entries or exiting positions near market bottoms.
What Is the Difference Between SMA and Exponential Moving Average (EMA)?
The fundamental difference between an SMA and an Exponential Moving Average (EMA) lies in how price weight is distributed across the lookback period (the total number of bars included in the calculation). While the SMA treats every historical bar equally, the EMA applies a multiplier that places greater mathematical weight on the most recent price points.
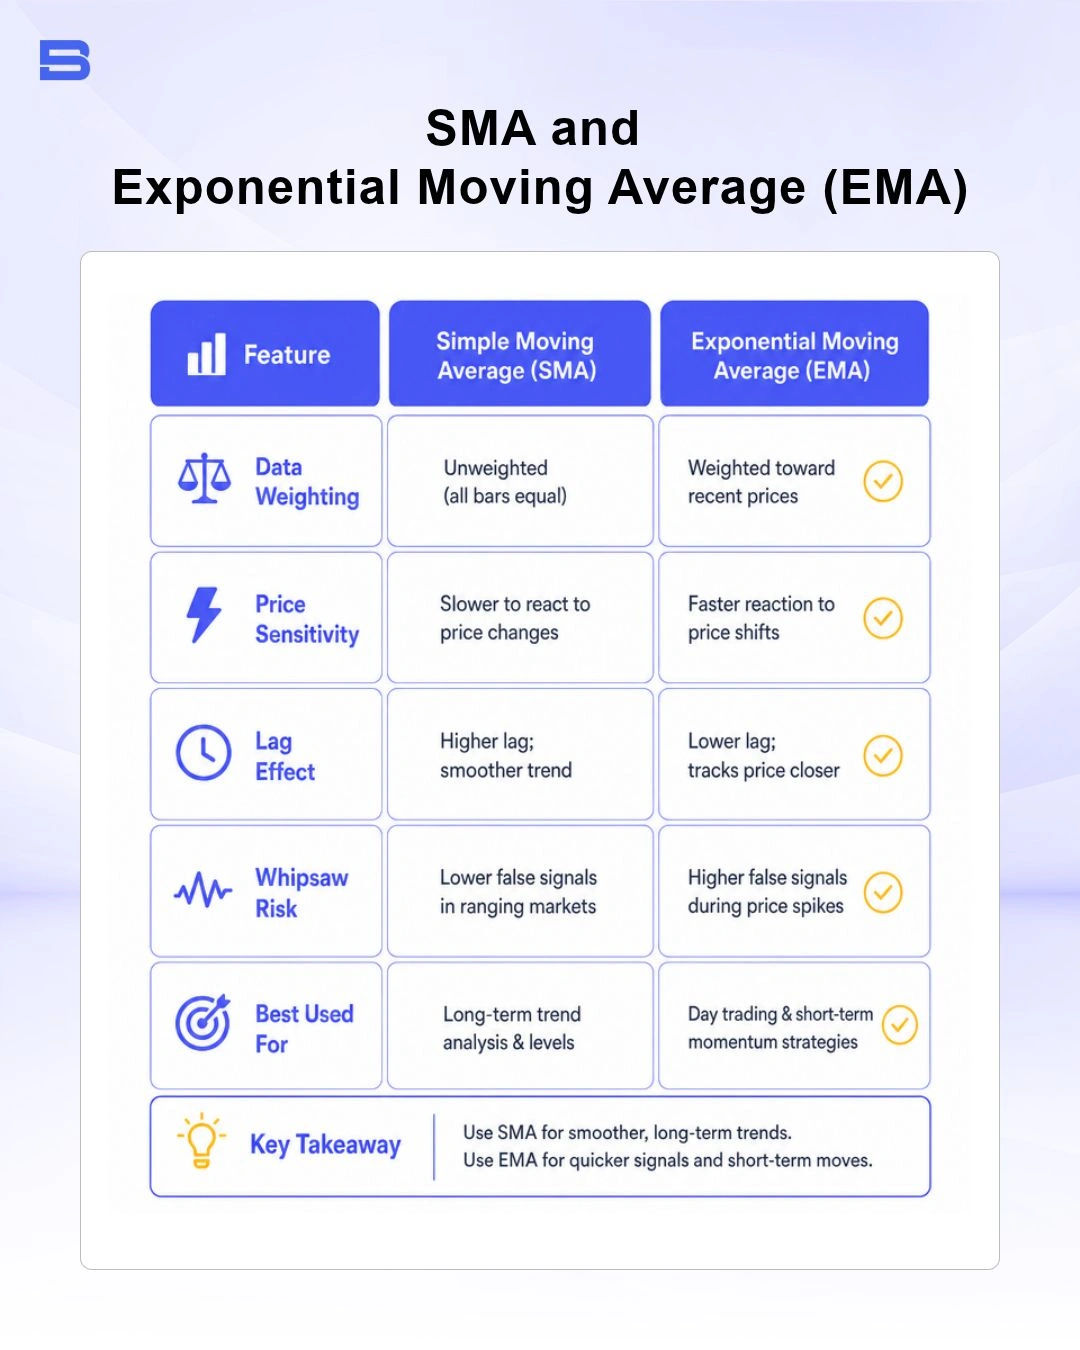
Because of its exponential weighting, an EMA turns faster when a sharp price movement occurs. However, this increased speed comes with a trade-off: the EMA generates more frequent whipsaws when price oscillates rapidly without establishing a clear direction.
SMA vs EMA: Which Is Better for Your Trading Strategy?
Neither indicator is inherently superior; the choice between SMA and EMA depends on your trading timeframe and analytical goals.
If you focus on higher timeframes, swing trading, or institutional trend filtering, the Simple Moving Average offers a stable reference point that isn't overly distorted by short-term noise. Conversely, if you execute fast-paced intraday trades where early signals matter more than filtering out minor spikes, the Exponential Moving Average may better suit your execution needs.
Many traders choose not to rely on moving averages in isolation. Instead, they evaluate structural price levels alongside complementary technical tools like Fibonacci retracement or broader framework guides covering the best trading indicators.
Limitations of Simple Moving Average: Lag and Whipsaws
While the SMA is a reliable tool for filtering noise, relying mechanically on SMA signals presents distinct market risks:
- The SMA Lag Effect: Because the SMA takes time to incorporate new price inputs, the indicator line lags behind rapid market reversals. In fast-moving markets, waiting for price to cross an SMA line can mean entering a trade after a significant portion of the move has already occurred.
- Whipsaws in Sideways Regimes: The SMA performs best in strongly trending markets. When price moves sideways within a tight range, the SMA line flattens through the middle of the price action, causing price to cross back and forth repeatedly. Following every crossover in a ranging market can trigger successive losing trades (whipsaws) and lead to substantial capital drawdown (a decline in account value from its most recent peak).
To mitigate false breakout signals, experienced traders combine moving averages with momentum indicators like the Relative Strength Index (RSI) or volatility envelopes like Bollinger Bands to verify trend strength before executing orders.
Conclusion
The SMA remains a core building block of technical analysis due to its straightforward math and effectiveness in smoothing complex price action. Whether used to gauge long-term trends on a 200-day line or identify medium-term support on a 50-day average, the SMA provides clear structural clarity.
However, because moving averages inherently lag price action and struggle in sideways markets, they are most effective when integrated into a well-rounded strategy alongside momentum confirmation and disciplined risk controls.
- How to Build an Investment Plan That Actually Works for You?
- What Is the MACD Indicator and How to Use It
- What Is a Wedge Pattern in Trading?
- What Is Ichimoku Cloud Strategy? A Complete Trading System
- Mastering Elliott Wave Theory: Rules and Trading Strategies
- News Trading: Strategies, Execution Risks, and Risk Control
- What Is an Iron Condor Options Strategy?
- Backtesting Explained: What It Is and Why It Really Matters
- Grid Trading: Mechanics, Parameters, and Risk Strategies
- What Is Breakout Trading and How Does It Work?
- Mean Reversion: Technical Strategies and Risk Frameworks
- Momentum Trading: Indicators, Strategies, and Risk Control
- Hammer Candlestick: Structure, Meaning, and Strategy
- Doji Candlestick: Types, Signals, and Trading Strategies
- What Is the Sharpe Ratio and How to Calculate It
- What Is VWAP and How Do Traders Use It?
- Trade the Ascending Triangle: A Step-by-Step Practical Guide
- What Is the Stochastic Oscillator and How to Use It
- How to Trade the Descending Triangle Pattern
- High Frequency Trading: Speed, Algorithms, and Market Impact
- What Is Volume Profile and How to Use It in Trading
- What Is a Morning Star Pattern Candlestick?
- Trade with Parabolic SAR: A Practical Analysis Guide
- Evening Star Pattern: Structure, Rules, and Risk Controls
- Kelly Criterion: Formula, Position Sizing, and Risk
- What Is the NYSE Minimum Trading Price? Rules Explained
Disclaimer: The content on this page is intended for educational and informational purposes only. It does not constitute financial, investment, tax, or legal advice, and should not be interpreted as a recommendation to buy, sell, or hold any financial instrument or asset. Trading and investing involve significant risk, including the possible loss of your entire capital. Products such as forex, CFDs, and cryptocurrencies carry additional risks due to leverage, high volatility, and limited regulatory protection in some jurisdictions. Past performance of any financial instrument does not guarantee future results. Any market views, forecasts, or opinions expressed are those of the author at the time of writing and may not reflect current market conditions. Platform features, fees, and regulatory status are subject to change — always verify information directly with the relevant provider or regulator before making any financial decision. BrokerSpecs may receive compensation from third parties featured on this site. Always conduct your own due diligence and consider seeking advice from a licensed financial professional before investing. Portions of this article were prepared with the assistance of AI tools and reviewed by our editorial team before publication.