


Related Tags
You are watching a breakout unfold on a 15-minute chart, holding your mouse button as price pushes through resistance. You wait for confirmation, but by the time a standard trend line reflects the move, the best risk-to-reward ratio has disappeared. On the other hand, entering too early without confirmation exposes your balance to fakeouts: moves that look like breakouts but quickly reverse.
This lag-versus-sensitivity trade-off is a common challenge in technical analysis, especially for newer traders. To reduce lag without making the indicator overly sensitive to market noise, traders adopted the Exponential Moving Average (EMA), a weighting method rooted in exponential smoothing techniques from statistics.
What Is a Moving Average in Trading and How Does the EMA Work?
A moving average is a fundamental technical indicator designed to smooth out price action by filtering out short-term market noise. By averaging historical price points over a specified period, it creates a clean, dynamic trend line that helps traders identify overall market direction and potential momentum shifts.
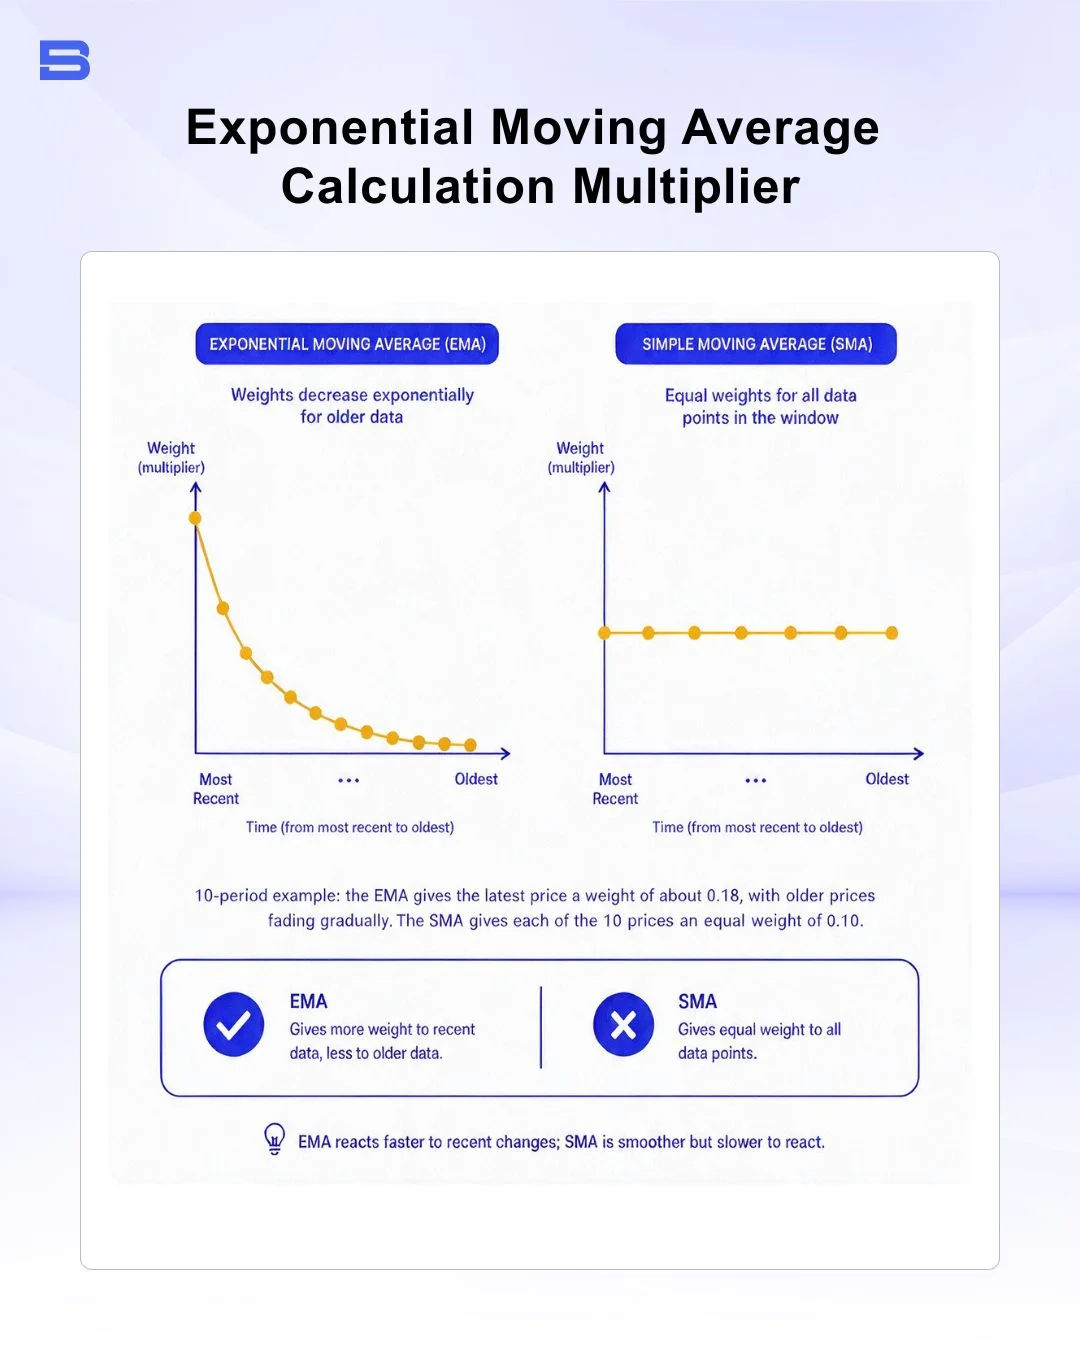
The Exponential Moving Average (EMA) improves upon standard moving averages by placing greater mathematical weight on more recent price data. This makes the EMA more responsive to recent price movements than a simple moving average, which gives equal weight to observations within the calculation period. CFA Institute’s Research Foundation identifies exponentially weighted averages as a variation of moving averages used in technical analysis.
How to Calculate the Exponential Moving Average (Step-by-Step Multiplier)
Calculating an EMA involves a three-step mathematical process:
- Calculate the Simple Moving Average (SMA): Determine the average closing price over the specified period N to establish the initial baseline value.
- Calculate the Weighting Multiplier (K): Apply the smoothing formula based on the selected period count N:
K = 2 / (N + 1) - Calculate the Current EMA: Combine the latest closing price with the previous period's EMA using the multiplier:
EMA_today = (Price_today x K) + (EMA_yesterday x (1 - K))
For a 10-day EMA, the multiplier formula yields K = 2 / (10 + 1) = 0.1818 (or 18.18%). This means today's closing price accounts for 18.18% of the EMA value, while all prior historical data accounts for the remaining 81.82%. If price suddenly surges today, the 10-day EMA turns upward significantly faster than an equal-weighted 10-day average.
Exponential Moving Average (EMA) vs. Simple Moving Average (SMA): What Is the Difference?
The difference between the EMA and the simple moving average lies entirely in their underlying weighting structure. An SMA applies equal weight to every data point in the lookback window, meaning a price shock from 20 periods ago drops off the calculation abruptly. That can make the SMA line jump even when current prices stay flat. Conversely, the EMA’s exponential weighting curve ensures that past data smoothly fades in influence over time without creating artificial indicator jumps.
SMA vs EMA: Which Is Better for Your Trading Style?
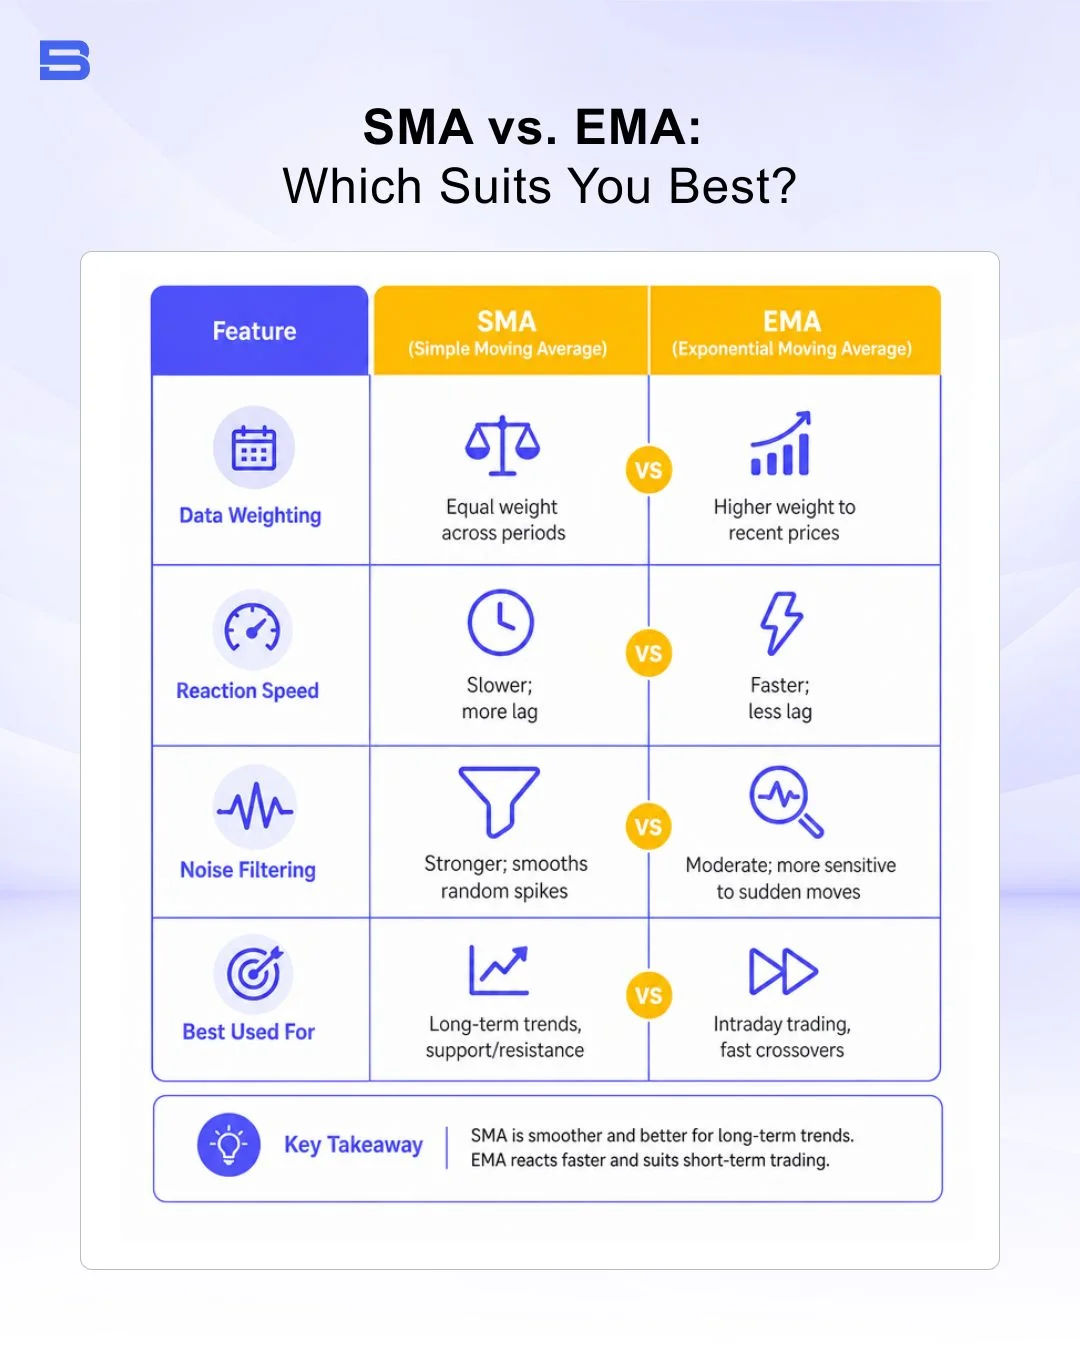
Scalpers and day traders frequently favor the EMA because its rapid reaction speed delivers earlier entry signals during strong impulse moves (sharp, one-directional bursts in price). Conversely, long-term investors often prefer the SMA for weekly or monthly portfolio analysis because its slower reaction speed reduces the likelihood of being shaken out of a long position by short-term market fluctuations.
Best EMA Settings for Day Trading and Swing Trading
The right Exponential Moving Average length depends on how long you plan to hold a trade and what you want the indicator to show you. Most traders group EMA settings into two buckets: shorter periods that track recent momentum and longer periods that reveal the bigger trend.
- 9 & 21 EMA (Short-Term Momentum): Popular with many day traders who analyze 1-minute to 15-minute charts. The 9 EMA follows the latest price moves closely, while the 21 EMA shows the direction of the short-term trend.
- 50 EMA (Medium-Term Trend): Is commonly watched by swing traders on 1-hour and 4-hour timeframes as a reference point for gauging pullbacks within a trend.
- 200 EMA (Macro Trend Boundary): Widely watched on daily and weekly charts as a rough dividing line between longer-term bullish and bearish conditions.
Dynamic Support and Resistance in Action
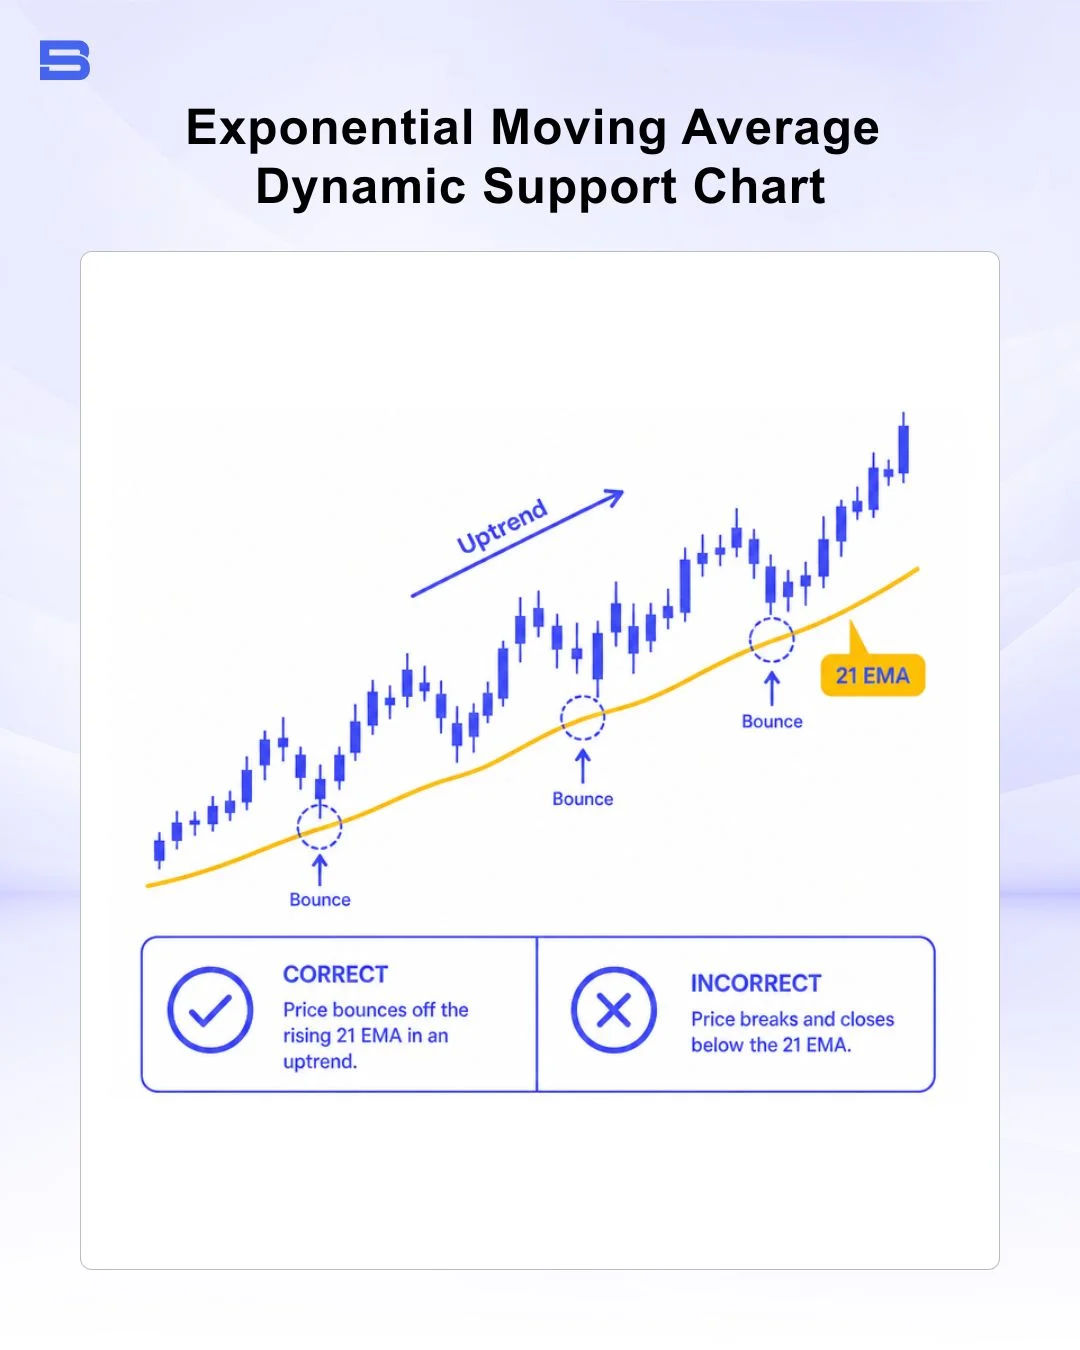
In strong, established trends, EMAs do not remain static like traditional horizontal price levels. Instead, they act as dynamic support and resistance zones that move alongside price action.
For instance, during a strong uptrend, price often pulls back toward a rising 21 EMA, where some traders watch for buyers to step back in. Traders monitor these dynamic touches for candlestick reversal patterns to enter trending setups with defined stop-loss placement just below the moving average line.
How to Trade Using EMA Crossover Strategies
EMA crossovers may offer rule-based signals by tracking changes in short-term versus long-term momentum, though no crossover signal is reliable on its own.
When a shorter-period EMA crosses above a longer-period EMA, it suggests recent prices are rising faster than the longer-term average, which some traders treat as a potential bullish entry signal. Conversely, when a short-term EMA crosses below a long-term EMA, it reflects accelerating downside momentum.
Real-World Case Study: 9/21 EMA Crossover on Bitcoin
For a practical example, look at a 15-minute BTC/USD chart from TradingView (raw price data, September 23, 2026): the 9 EMA crossed above the 21 EMA, a pattern many traders read as a potential shift toward bullish short-term momentum.
How to read the crossover:
- Before the crossover: The 9 EMA was below the 21 EMA, indicating weaker short-term momentum.
- Crossover: The 9 EMA moved above the 21 EMA, showing that recent price momentum had strengthened relative to the longer 21-period average.
- After the crossover: The 9 EMA remained above the 21 EMA as price moved higher, providing a visual indication of strengthening short-term momentum.
- Interpretation: The crossover showed a shift in short-term momentum rather than guaranteeing that prices would continue rising.
The example demonstrates how traders can use the relationship between a faster and slower EMA to observe changes in short-term market momentum. It should be interpreted alongside price action and other indicators rather than as a standalone signal.
Combining EMA with Momentum Indicators (RSI & MACD)
Relying strictly on moving average crossovers can expose your portfolio to false signals when markets suddenly lose momentum. Filtering crossover triggers with oscillator tools like the Relative Strength Index (RSI) indicator or Moving Average Convergence Divergence (MACD) indicator may help filter out some false signals, although it cannot eliminate them.
A standard execution framework operates as follows:
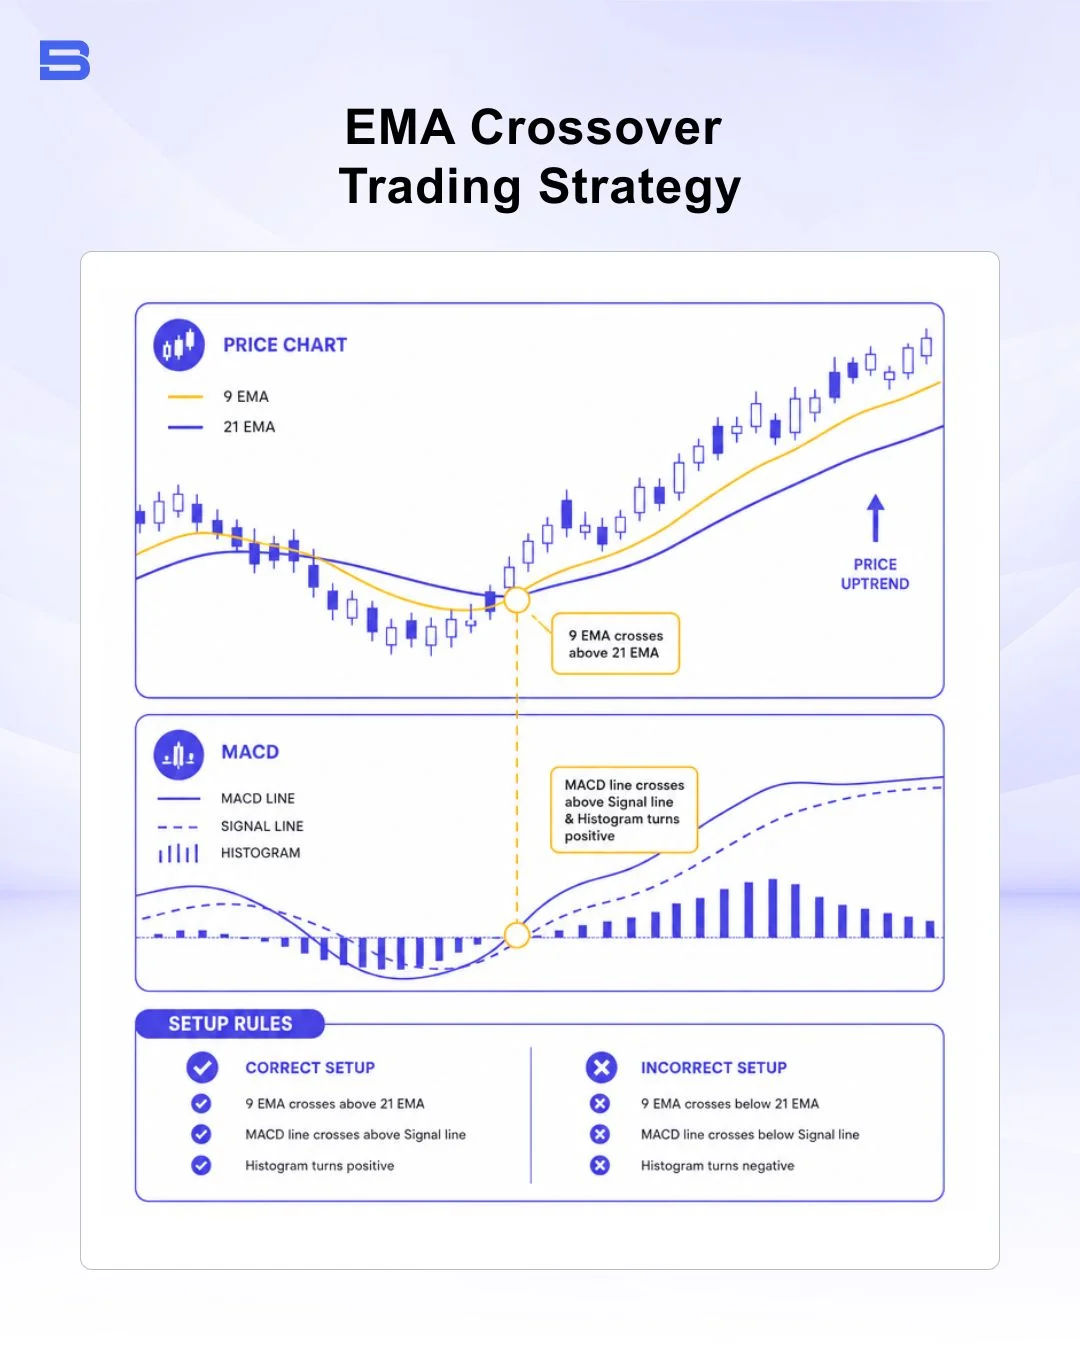
- Trend Signal: Wait for the 9 EMA to cross above the 21 EMA on your execution timeframe.
- Momentum Filter: Check the MACD histogram to ensure upside expansion, while verifying that the RSI is holding above 50 without being severely overbought (e.g., above 70).
- Risk Management: Enter market orders on candle close and place a protective stop-loss slightly below the recent swing low (the last low point before price turned higher) or below the 21 EMA line.
- Exit Plan: Define your exit before you enter. For example, you can set a take-profit at a fixed reward-to-risk ratio (such as 2:1) or close the trade if the 9 EMA crosses back below the 21 EMA. Test the full framework on a demo account before risking real capital.
When operating leveraged instruments like Forex or contracts for difference (CFDs), risk management must remain disciplined. Leverage amplifies returns when your bias is correct, but it accelerates losses when price breaks market structure; utilizing 20:1 leverage means a 2% adverse market move against your position wipes out 40% of allocated margin. Always limit total risk on any single trade setup to a manageable percentage of your total capital.
Limitations of the EMA: Whipsaws and False Signals
Despite its reduced lag compared to simple averages, the Exponential Moving Average remains a lagging indicator based on historical price data. It cannot forecast unexpected fundamental news releases or sudden macroeconomic market shifts.
A key weakness of the EMA shows up during consolidation phases, when price trades within a tight, horizontal range. In low-volatility, sideways markets, short-term EMAs repeatedly flatten and cross back and forth across price action. This creates "whipsaws"—a sequence of false buy and sell crossover signals that can erode account equity through repeated small stop-outs and accumulated trading fees.
To guard against whipsaw losses, avoid using standalone EMA crossover strategies when technical tools like Bollinger Bands indicate severe volatility contraction or horizontal market ranging.
Key Takeaways: How to Use the Exponential Moving Average
An Exponential Moving Average (EMA) is a technical analysis indicator that gives greater weight to recent price data, making it more responsive to price changes than a Simple Moving Average (SMA). Traders use EMAs to identify trends, assess momentum, and monitor potential changes in market direction.
By choosing an appropriate EMA period and combining it with other technical indicators, traders can use it as part of a broader market-analysis and risk-management approach.
- How to Build an Investment Plan That Actually Works for You?
- What Is the MACD Indicator and How to Use It
- What Is a Wedge Pattern in Trading?
- What Is Ichimoku Cloud Strategy? A Complete Trading System
- Mastering Elliott Wave Theory: Rules and Trading Strategies
- News Trading: Strategies, Execution Risks, and Risk Control
- What Is an Iron Condor Options Strategy?
- Backtesting Explained: What It Is and Why It Really Matters
- Grid Trading: Mechanics, Parameters, and Risk Strategies
- What Is Breakout Trading and How Does It Work?
- Mean Reversion: Technical Strategies and Risk Frameworks
- Momentum Trading: Indicators, Strategies, and Risk Control
- Hammer Candlestick: Structure, Meaning, and Strategy
- Doji Candlestick: Types, Signals, and Trading Strategies
- What Is the Sharpe Ratio and How to Calculate It
- What Is VWAP and How Do Traders Use It?
- Trade the Ascending Triangle: A Step-by-Step Practical Guide
- What Is the Stochastic Oscillator and How to Use It
- How to Trade the Descending Triangle Pattern
- High Frequency Trading: Speed, Algorithms, and Market Impact
- What Is Volume Profile and How to Use It in Trading
- What Is a Morning Star Pattern Candlestick?
- Trade with Parabolic SAR: A Practical Analysis Guide
- Evening Star Pattern: Structure, Rules, and Risk Controls
- Kelly Criterion: Formula, Position Sizing, and Risk
- What Is the NYSE Minimum Trading Price? Rules Explained
Disclaimer: The content on this page is intended for educational and informational purposes only. It does not constitute financial, investment, tax, or legal advice, and should not be interpreted as a recommendation to buy, sell, or hold any financial instrument or asset. Trading and investing involve significant risk, including the possible loss of your entire capital. Products such as forex, CFDs, and cryptocurrencies carry additional risks due to leverage, high volatility, and limited regulatory protection in some jurisdictions. Past performance of any financial instrument does not guarantee future results. Any market views, forecasts, or opinions expressed are those of the author at the time of writing and may not reflect current market conditions. Platform features, fees, and regulatory status are subject to change — always verify information directly with the relevant provider or regulator before making any financial decision. BrokerSpecs may receive compensation from third parties featured on this site. Always conduct your own due diligence and consider seeking advice from a licensed financial professional before investing. Portions of this article were prepared with the assistance of AI tools and reviewed by our editorial team before publication.