



Related Tags
You open a four-hour chart and watch price bounce sharply off a recent low, only to stall and slide right back down a few candles later. When that bounce-and-drop rhythm repeats between two downward-sloping lines, you are looking at a descending channel pattern. Mistaking one of those controlled rallies for a true trend reversal can trap your capital early, while understanding the channel’s boundaries lets you plan entries around clear invalidation points.
What Is a Descending Channel Pattern and How Does It Form?
A descending channel pattern is a bearish technical chart formation bounded by two parallel, downward-sloping trendlines connecting lower highs and lower lows. Within this structure, sellers consistently step in near the upper resistance line while short-term profit-taking creates temporary bounces off the lower support line.
This balanced tug-of-war forms a recognizable chart pattern across forex, equities, commodities, and index markets. Unlike a vertical sell-off driven by panic liquidation, a descending channel reflects orderly distribution where supply outweighs demand at progressively lower price levels.
Traders often refer to the upper rail as the main trendline because it defines the prevailing downward slope. The lower rail acts as a parallel return line, projecting where selling momentum temporarily exhausts itself before the next leg down begins.
According to technical analysis principles outlined by the CFA Institute, price channels help traders visualize trend direction alongside support and resistance zones. However, a channel remains valid only as long as price respects both parallel boundaries without closing decisively outside them.
Is a Descending Channel Bullish or Bearish?
A descending channel is structurally bearish while price remains inside its boundaries, though it can also resolve with a bullish breakout to the upside. Because each swing high and swing low prints below the previous one, trend-following traders treat the active channel as a downward price trajectory until proven otherwise.
Context on a higher timeframe determines how you interpret that downward drift. When a descending channel forms inside a broader, multi-month downtrend, it usually acts as a continuation structure that leads to lower prices.
Conversely, when a tight descending channel develops after a strong upward rally, it often functions as a bull-flag pullback. In that scenario, downward momentum gradually fades as sellers run out of supply, setting the stage for buyers to push price back above upper resistance.
Descending Channel vs. Falling Wedge: Key Structural Differences
Traders frequently confuse a descending channel with a falling wedge pattern because both slope downward and feature lower highs and lower lows. The critical distinction lies in whether the boundary lines stay parallel, as in a descending channel, or converge toward an apex, as in a falling wedge.
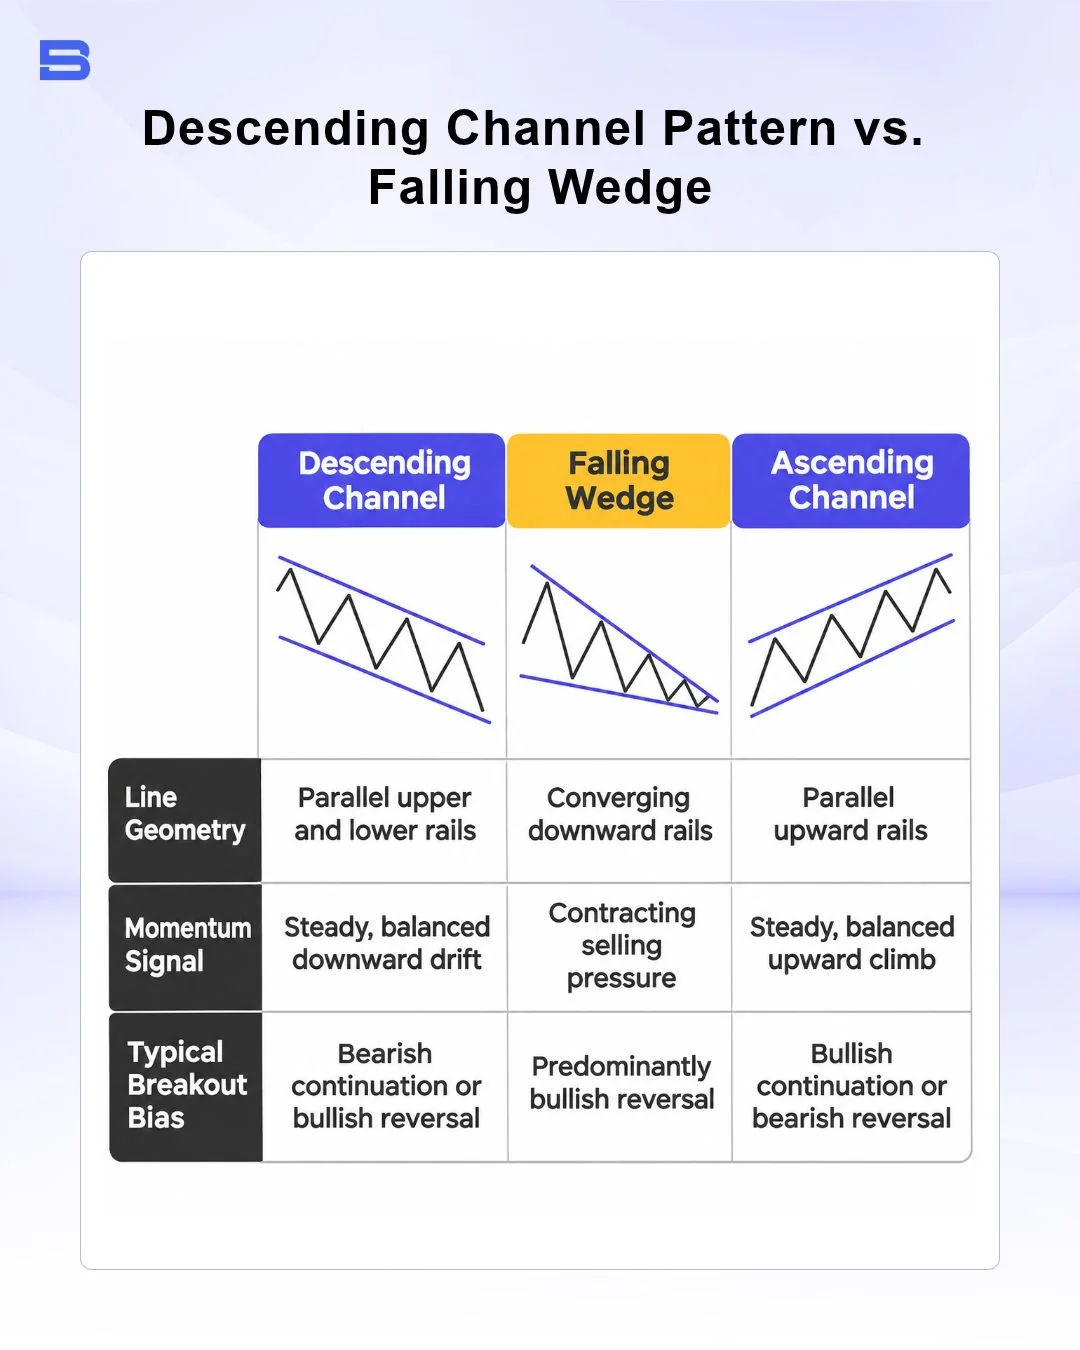
Recognizing parallel rails can help you avoid buying too early in a market that may still have room to fall.
How to Identify and Draw a Descending Channel Pattern
Drawing an accurate descending channel requires anchoring your lines to objective swing points rather than forcing boundaries to fit a desired trade bias. Follow these steps to map the structure cleanly on your chart:
- Locate at least two distinct lower highs: Identify an initial swing high followed by a secondary, lower swing high that confirms downward momentum.
- Anchor the upper resistance trendline: Connect those two lower highs using a straight trendline, ensuring the line rests across candle wicks without slicing through multiple candle bodies.
- Project the parallel lower support line: Duplicate the upper trendline and drag it down to touch the lowest swing low between or after your two anchored highs.
- Verify at least four total touchpoints: Confirm that price has reacted to the upper resistance at least twice and the lower support at least twice before risking capital.
If you have to tilt the lower line at a noticeably flatter angle to catch the lows, you are likely looking at a wedge rather than a true parallel channel.
How to Trade a Descending Channel Pattern: Two Core Approaches
Intermediate traders generally approach a descending channel in one of two ways: swinging between the internal rails or waiting for a confirmed breakout. Trading inside the channel works best when the distance between support and resistance is wide enough to offer a favorable risk-to-reward ratio after accounting for spreads.
In a range-swing setup, you look for bearish rejection candles near the upper resistance line to enter short positions, placing a protective stop-loss just above the upper rail. Taking partial or full profits near the lower support line protects your gains before buyers step back in.
Breakout trading takes the opposite approach by waiting for the channel structure to fail. Instead of guessing the exact bottom, you wait for a full candle close above the upper resistance line, ideally backed by expanding volume or a breakaway gap on equity charts.
Consider a worked breakout scenario on EUR/USD trading inside a 4-hour descending channel with a 100-pip vertical height between rails. Suppose price breaks and closes above upper resistance at 1.0850, and you enter a long position of 1 mini lot (10,000 units), where each pip equals $1.
You place your stop-loss 40 pips lower at 1.0810, just beneath the last internal swing low, capping your maximum risk at $40. Projecting the 100-pip channel height upward from the breakout point sets your take-profit target at 1.0950, creating a $100 potential gain and a 1:2.5 risk-to-reward ratio.
Using leverage on forex or CFD accounts amplifies your gains when a breakout follows through, but it magnifies your losses just as rapidly if price snaps back inside the channel. A 40-pip adverse move on a 10,000-unit position costs $40, whereas trading 1 standard lot (100,000 units) on the same account turns that identical 40-pip stop into a $400 loss.
Trading Breakouts and Breakdowns from the Channel
An upside breakout occurs when buyers absorb remaining sell orders and close price above the upper trendline, signaling a potential trend shift. Waiting for a retest of the broken upper rail as new support can filter out weak moves, though strong momentum breakouts sometimes leave without looking back.
A downside breakdown happens when price closes decisively below the lower support line, indicating accelerating bearish panic. Traders who short breakdowns face higher slippage risk during fast sell-offs, making strict stop-loss discipline essential.
Common Traps, False Breakouts, and Channel Invalidation
Even textbook descending channels fail when liquidity hunts push price briefly past a boundary before reversing. A bull trap occurs when price pokes above the upper resistance line on weak volume, triggers breakout buy orders, and then closes back inside the channel.
Conversely, a bear trap forms when price dips briefly below lower support, shakes out weak long positions, and snaps violently upward toward the upper rail. Requiring a full candle close beyond the trendline on your chosen timeframe helps reduce exposure to intraday wick fakeouts.
Many traders treat a descending channel as invalidated once price prints two consecutive closes outside either rail without reclaiming the boundary, or when the swing structure shifts to higher highs and higher lows. The International Organization of Securities Commissions (IOSCO) has flagged the risks that leveraged over-the-counter products, such as rolling-spot forex contracts and CFDs, pose to retail investors. Those risks can feel sharper around volatile breakout levels, where stop orders often cluster.
The Bottom Line
A descending channel pattern gives you a structured framework for reading controlled downward price action without guessing where a trend might turn. By verifying parallel boundaries, respecting higher-timeframe context, and sizing every position around a clear stop-loss level, you can trade both internal swings and confirmed breakouts with defined risk.
- How to Build an Investment Plan That Actually Works for You?
- What Is the MACD Indicator and How to Use It
- What Is a Wedge Pattern in Trading?
- What Is Ichimoku Cloud Strategy? A Complete Trading System
- Mastering Elliott Wave Theory: Rules and Trading Strategies
- News Trading: Strategies, Execution Risks, and Risk Control
- What Is an Iron Condor Options Strategy?
- Backtesting Explained: What It Is and Why It Really Matters
- Grid Trading: Mechanics, Parameters, and Risk Strategies
- What Is Breakout Trading and How Does It Work?
- Mean Reversion: Technical Strategies and Risk Frameworks
- Momentum Trading: Indicators, Strategies, and Risk Control
- Hammer Candlestick: Structure, Meaning, and Strategy
- Doji Candlestick: Types, Signals, and Trading Strategies
- What Is the Sharpe Ratio and How to Calculate It
- What Is VWAP and How Do Traders Use It?
- Trade the Ascending Triangle: A Step-by-Step Practical Guide
- What Is the Stochastic Oscillator and How to Use It
- How to Trade the Descending Triangle Pattern
- High Frequency Trading: Speed, Algorithms, and Market Impact
- What Is Volume Profile and How to Use It in Trading
- What Is a Morning Star Pattern Candlestick?
- Trade with Parabolic SAR: A Practical Analysis Guide
- Evening Star Pattern: Structure, Rules, and Risk Controls
- Kelly Criterion: Formula, Position Sizing, and Risk
- What Is the NYSE Minimum Trading Price? Rules Explained
Disclaimer: The content on this page is intended for educational and informational purposes only. It does not constitute financial, investment, tax, or legal advice, and should not be interpreted as a recommendation to buy, sell, or hold any financial instrument or asset. Trading and investing involve significant risk, including the possible loss of your entire capital. Products such as forex, CFDs, and cryptocurrencies carry additional risks due to leverage, high volatility, and limited regulatory protection in some jurisdictions. Past performance of any financial instrument does not guarantee future results. Any market views, forecasts, or opinions expressed are those of the author at the time of writing and may not reflect current market conditions. Platform features, fees, and regulatory status are subject to change — always verify information directly with the relevant provider or regulator before making any financial decision. BrokerSpecs may receive compensation from third parties featured on this site. Always conduct your own due diligence and consider seeking advice from a licensed financial professional before investing. Portions of this article were prepared with the assistance of AI tools and reviewed by our editorial team before publication.