



Related Tags
You watch a stock test the $100 ceiling three times over two weeks, waiting for a clean breakout. On Tuesday morning, price pushes to $101.20 on a sudden green candle, so you enter a long position expecting momentum to carry it higher. By the closing bell, price has dropped back to $96.50, leaving you sitting on an immediate loss while sellers take control.
What Is a Bull Trap? Bull Trap Meaning and Mechanics
A bull trap is a false breakout where an asset’s price briefly moves above a key resistance level, luring buyers into long positions before sharply reversing downward. Understanding the meaning helps you recognize when an apparent uptrend lacks genuine institutional backing.
In market mechanics, a false breakout occurs when buying pressure pushes price just past a well-watched resistance level. Momentum traders enter long positions, and short sellers place buy-stop orders just above that level to exit losing trades. Once those buy orders are filled, new demand dries up, allowing larger sellers to step in and drive price back below the breakout line.
Consider a practical example using a $5,000 trading account. Suppose you buy 50 shares of a stock at $101.00 after it breaks above $100.00 resistance, committing your entire $5,000 balance plus $50 in margin. If you trade without a stop-loss and the stock falls 8% to $92.92, your position loses $404.00, wiping out over 8% of your account in a single reversal.
By contrast, setting a stop-loss at $98.50 limits your loss to $2.50 per share, or $125.00 total. Even with minor slippage during a fast drop, your loss would stay close to 2.5% of your account rather than spiraling into a severe drawdown. However, if price gaps below your stop, the order may fill at a worse price and the loss can be larger.
Regulatory bodies such as the International Organization of Securities Commissions (IOSCO) warn that leverage increases exposure to market volatility and can magnify losses rapidly, particularly when adequate risk management measures, such as minimum margin requirements and downside protection, are absent.
What Causes a Bull Trap in Financial Markets?
Bull traps rarely happen by accident. They typically stem from structural imbalances between eager retail buyers and larger institutional participants. Knowing what causes a bull trap lets you look past surface-level price spikes and evaluate the underlying order flow.
Institutional liquidity grabs may be a key driver. Large funds often need substantial buy orders to fill large short positions without moving the market against themselves prematurely. By nudging price above a visible resistance level, they trigger retail buy-stops and momentum entries, creating the exact liquidity pool needed to sell into.
Low-volume rallies and news-driven spikes also create fragile breakouts. When an earnings release or macroeconomic headline triggers a sudden surge in thin market hours, price may jump higher in an exhaustion gap (a late price gap that appears as buying pressure runs out) without sustained institutional accumulation.
Research highlighted by the CFA Institute suggests that behavioral biases such as herding and confirmation bias can encourage traders to chase sudden price spikes, follow prevailing market sentiment, and overlook information that contradicts their expectations, including weakening underlying fundamentals.
How to Identify a Bull Trap Before Entering a Trade
Spotting a false breakout before committing capital requires checking whether price action is supported by genuine market participation. Several technical warning signs frequently appear right as a breakout begins to stall.
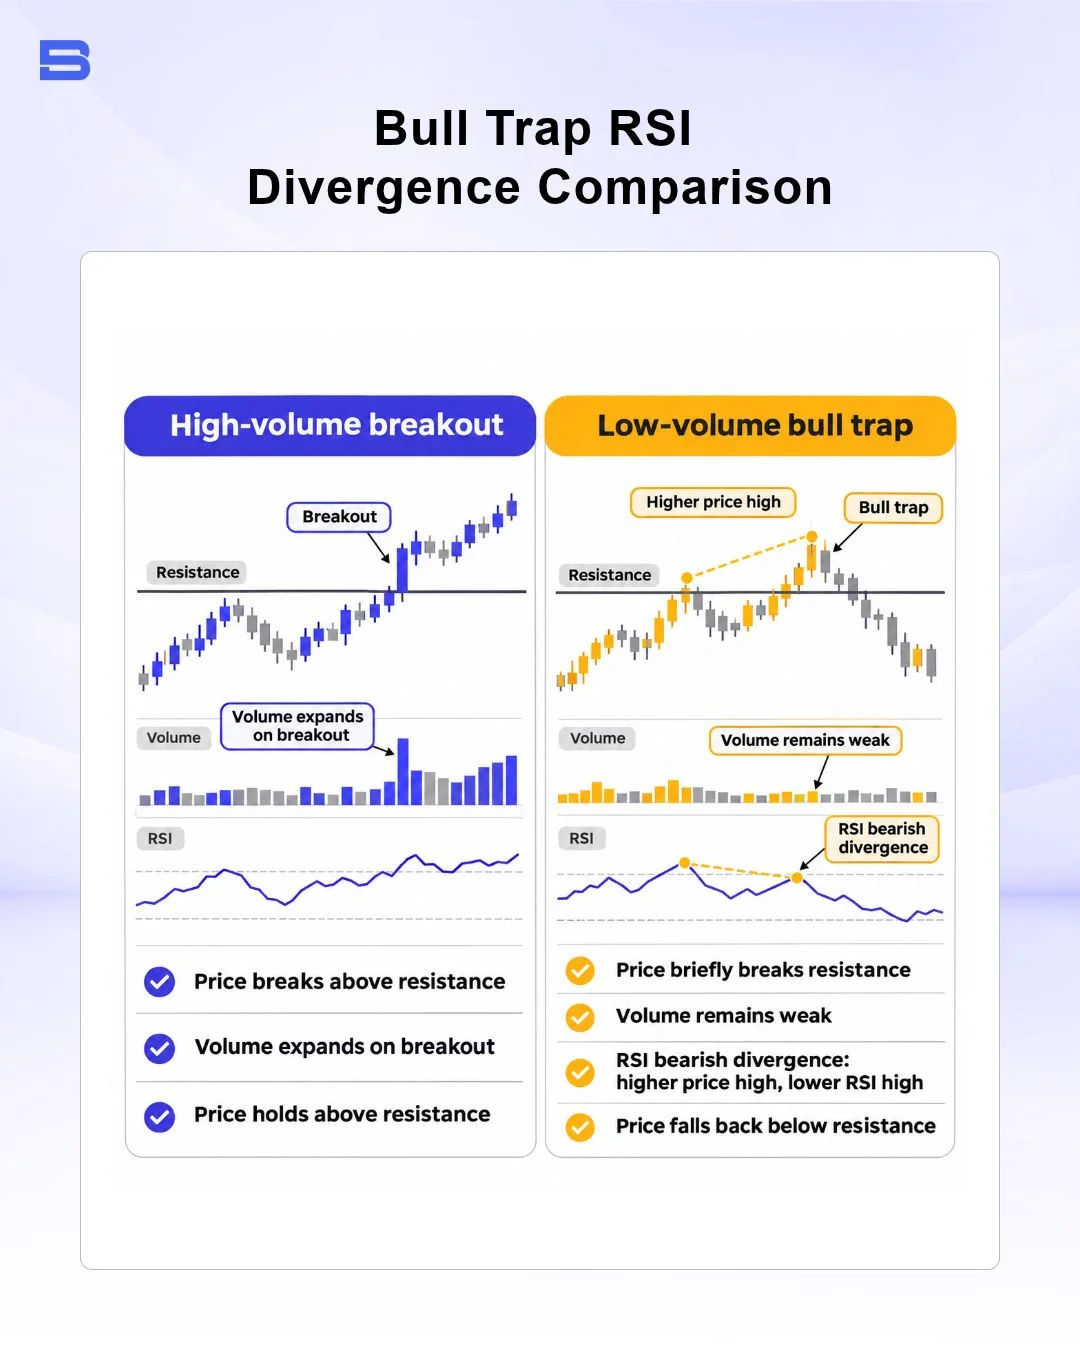
First, examine trading volume during the breakout candle. A valid breakout usually shows a noticeable surge in volume as new buyers enter aggressively, whereas a bull trap often unfolds on average or declining volume. Second, watch how the candle closes. A long upper wick that settles back near or below the resistance line signals immediate rejection.
Chart structure also provides early clues. Price grinding upward into resistance inside a narrowing rising wedge pattern often indicates buyer exhaustion rather than fresh strength, making any upward poke vulnerable to a sharp reversal.
Momentum and RSI Bearish Divergence
Momentum oscillators frequently expose weakness before price reverses. Bearish divergence occurs when the asset price prints a higher high above resistance, while an indicator like the Relative Strength Index (RSI) or Moving Average Convergence Divergence (MACD) forms a lower high.
This mismatch shows that while price ticked slightly higher, the underlying speed and conviction of buyers actually declined. When bearish divergence appears alongside weak breakout volume, a long trade may face a higher risk of a quick reversal.
Bull Trap vs. Bear Trap: Key Differences
While a bull trap catches optimistic buyers off guard at market tops or resistance levels, a bear trap does the exact opposite at market bottoms. Comparing a bull trap vs. a bear trap clarifies how false breakouts operate in both directions.
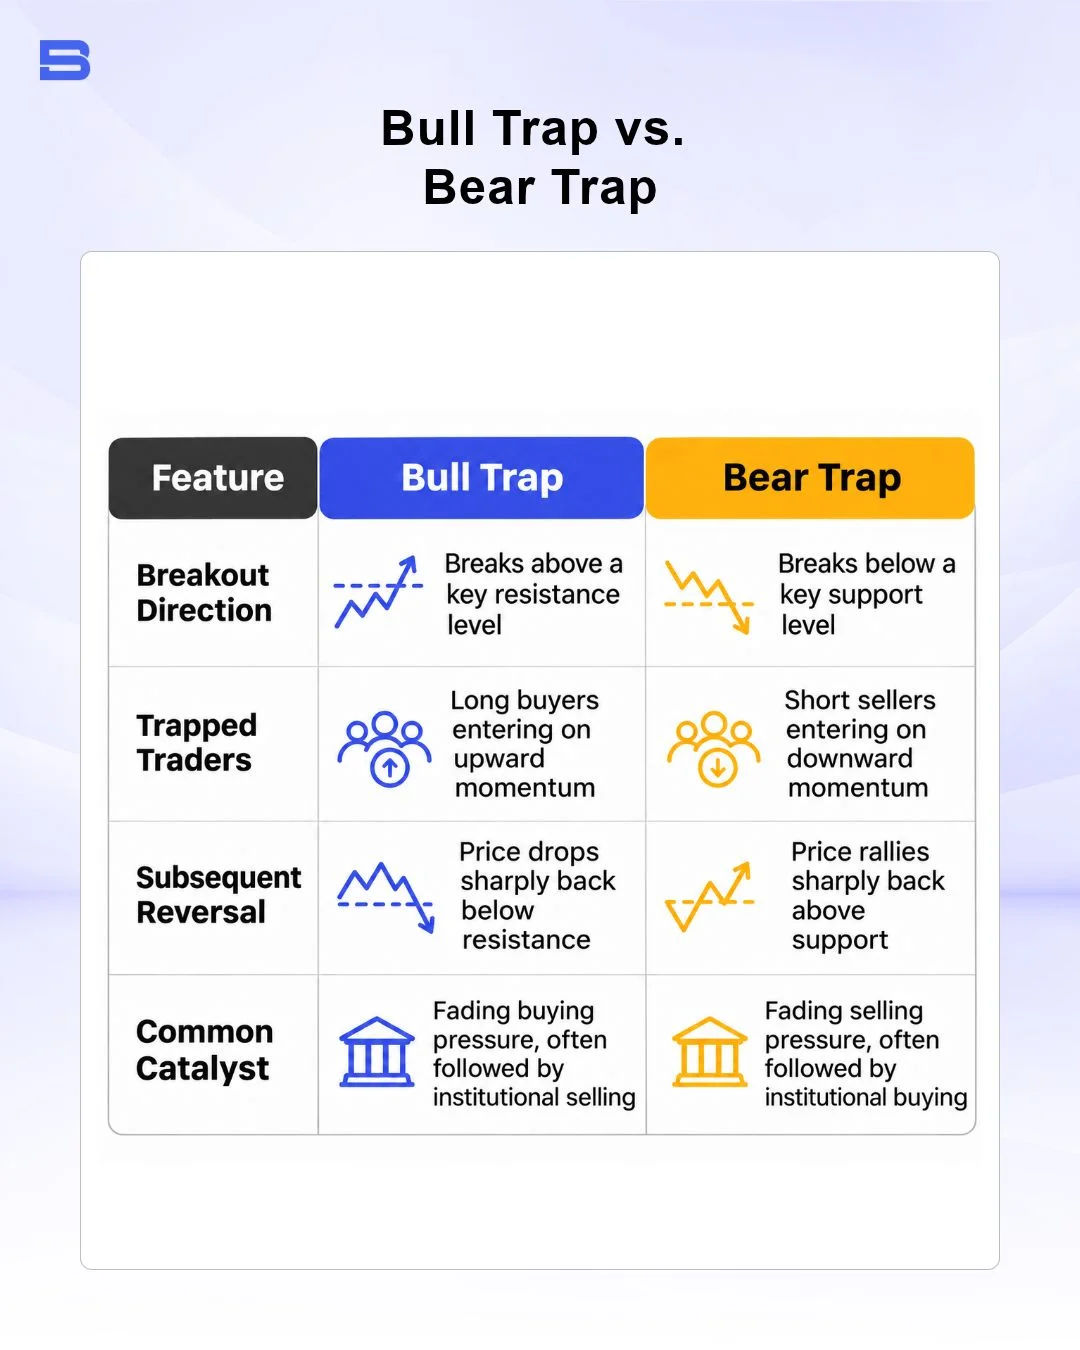
In both scenarios, the trap relies on traders reacting to an unconfirmed breach of a major technical level. The difference lies entirely in whether bulls or bears are forced to liquidate their positions once price snaps back into its prior range.
How to Avoid a Bull Trap and Manage Breakout Risk
No technical filter removes breakout risk entirely, so learning how to avoid a bull trap centers on disciplined confirmation and strict position sizing. Waiting for extra proof before entering can protect your capital from erratic price swings.
Consider applying these practical risk management habits when trading near resistance:
- Wait for a candle close and retest: Rather than buying the initial spike, wait for a full daily or four-hour candle to close cleanly above resistance, followed by a successful retest of that level as new support.
- Confirm with volume: Look for breakout volume that exceeds the 20-day moving average, confirming that broad market participation backs the move.
- Use defined stop-loss orders: Place your stop-loss just below the breakout zone or recent swing low, keeping in mind that during extreme volatility, price gaps can still cause execution slippage beyond your stop price.
- Size positions conservatively: Risk only a small, fixed percentage of your account on any single breakout attempt so one failed setup cannot derail your portfolio.
These habits work together by filtering out weak, low-conviction breakouts and helping keep any false signal you do take to a smaller, more manageable loss. According to investor guidance from the US Securities and Exchange Commission (SEC), volatile markets can trigger sudden price movements and rapid reversals, while fast-moving conditions may cause trade executions at prices that differ significantly from expected levels. Retail traders should therefore establish clear exit rules and understand the limitations of stop orders to help manage downside risk.
Conclusion
Recognizing a bull trap comes down to looking beyond a single price spike above resistance and checking for real volume, momentum alignment, and structural confirmation. Because even well-confirmed breakouts can fail when market conditions shift, pairing patient entry rules with strict position sizing and stop-loss orders can help you manage the risk of false breakouts.
- How to Build an Investment Plan That Actually Works for You?
- What Is the MACD Indicator and How to Use It
- What Is a Wedge Pattern in Trading?
- What Is Ichimoku Cloud Strategy? A Complete Trading System
- Mastering Elliott Wave Theory: Rules and Trading Strategies
- News Trading: Strategies, Execution Risks, and Risk Control
- What Is an Iron Condor Options Strategy?
- Backtesting Explained: What It Is and Why It Really Matters
- Grid Trading: Mechanics, Parameters, and Risk Strategies
- What Is Breakout Trading and How Does It Work?
- Mean Reversion: Technical Strategies and Risk Frameworks
- Momentum Trading: Indicators, Strategies, and Risk Control
- Hammer Candlestick: Structure, Meaning, and Strategy
- Doji Candlestick: Types, Signals, and Trading Strategies
- What Is the Sharpe Ratio and How to Calculate It
- What Is VWAP and How Do Traders Use It?
- Trade the Ascending Triangle: A Step-by-Step Practical Guide
- What Is the Stochastic Oscillator and How to Use It
- How to Trade the Descending Triangle Pattern
- High Frequency Trading: Speed, Algorithms, and Market Impact
- What Is Volume Profile and How to Use It in Trading
- What Is a Morning Star Pattern Candlestick?
- Trade with Parabolic SAR: A Practical Analysis Guide
- Evening Star Pattern: Structure, Rules, and Risk Controls
- Kelly Criterion: Formula, Position Sizing, and Risk
- What Is the NYSE Minimum Trading Price? Rules Explained
Disclaimer: The content on this page is intended for educational and informational purposes only. It does not constitute financial, investment, tax, or legal advice, and should not be interpreted as a recommendation to buy, sell, or hold any financial instrument or asset. Trading and investing involve significant risk, including the possible loss of your entire capital. Products such as forex, CFDs, and cryptocurrencies carry additional risks due to leverage, high volatility, and limited regulatory protection in some jurisdictions. Past performance of any financial instrument does not guarantee future results. Any market views, forecasts, or opinions expressed are those of the author at the time of writing and may not reflect current market conditions. Platform features, fees, and regulatory status are subject to change — always verify information directly with the relevant provider or regulator before making any financial decision. BrokerSpecs may receive compensation from third parties featured on this site. Always conduct your own due diligence and consider seeking advice from a licensed financial professional before investing. Portions of this article were prepared with the assistance of AI tools and reviewed by our editorial team before publication.