



Related Tags
You watch a major currency pair test a horizontal support floor three times over two days, and on the fourth push, a red candle slices cleanly underneath. You open a short position expecting a steep sell-off, only for price to snap back above support within minutes and rally straight through your stop-loss. That sudden reversal is a classic bear trap.
Bear Trap Meaning: How False Breakdowns Trap Short Sellers
A bear trap is a false technical breakdown where an asset’s price briefly drops below a key support level, enticing traders to sell short before rapidly reversing upward. In practical terms, the meaning comes down to a temporary shift in order flow that looks like the start of a new downtrend but lacks sustained selling pressure behind it.
When price dips beneath an obvious floor, two automated reactions happen at once. Retail breakout traders trigger new short orders, while existing long holders get knocked out by stop-loss sell orders clustered just below support.
Institutional buyers and other liquidity providers may take advantage of temporary selling pressure by absorbing large sell orders and accumulating positions at more favorable prices. This allows them to provide liquidity to sellers seeking immediate execution while potentially reducing their own entry costs. Once that available selling volume is absorbed, the downward momentum stalls, leaving late short sellers underwater as price climbs back into its prior range.
Behavioral biases such as herding and confirmation bias can lead traders to follow prevailing selling pressure and seek evidence that supports their bearish expectations, potentially causing them to enter breakdown trades before waiting for price confirmation or follow-through.
However, treating every bounce below support as a guaranteed trap is equally risky, because genuine macro catalysts or earnings shocks can turn an initial dip into a prolonged sell-off.
Bear Trap Trading: How a False Breakdown Unfolds Step by Step
Understanding the sequence behind a bear trap helps you recognize when selling pressure is running out of steam rather than accelerating. While no two charts look identical, false breakdowns generally unfold across four distinct market phases:
- Established uptrend or range: Price trades within a clear upward structure or sideways consolidation, building an obvious horizontal floor or trendline where buyers have repeatedly stepped in.
- Support breach (the fakeout): Price pushes below the support boundary, often accompanied by a spike in red candlestick momentum that convinces bears the floor has finally broken.
- Rapid price reclaim: Instead of attracting follow-through selling, price reverses sharply and closes back above the broken support line, invalidating the bearish breakout thesis.
- Short squeeze acceleration: As price recovers, trapped short sellers rush to buy back their positions to limit losses, adding fuel to the upward bounce.
In strong trend environments, this forced covering can even trigger an upward runaway gap or break price out of a descending channel pattern. Yet a false breakdown does not automatically launch a multi-week bull run, so traders still need objective confirmation before committing capital.
How to Identify a Bear Trap Before You Enter
Knowing how to identify a bear trap comes down to watching how price and volume behave right after support gives way. A genuine breakdown usually brings expanding sell volume and consecutive closes below the floor, whereas a trap shows signs of exhaustion almost immediately.
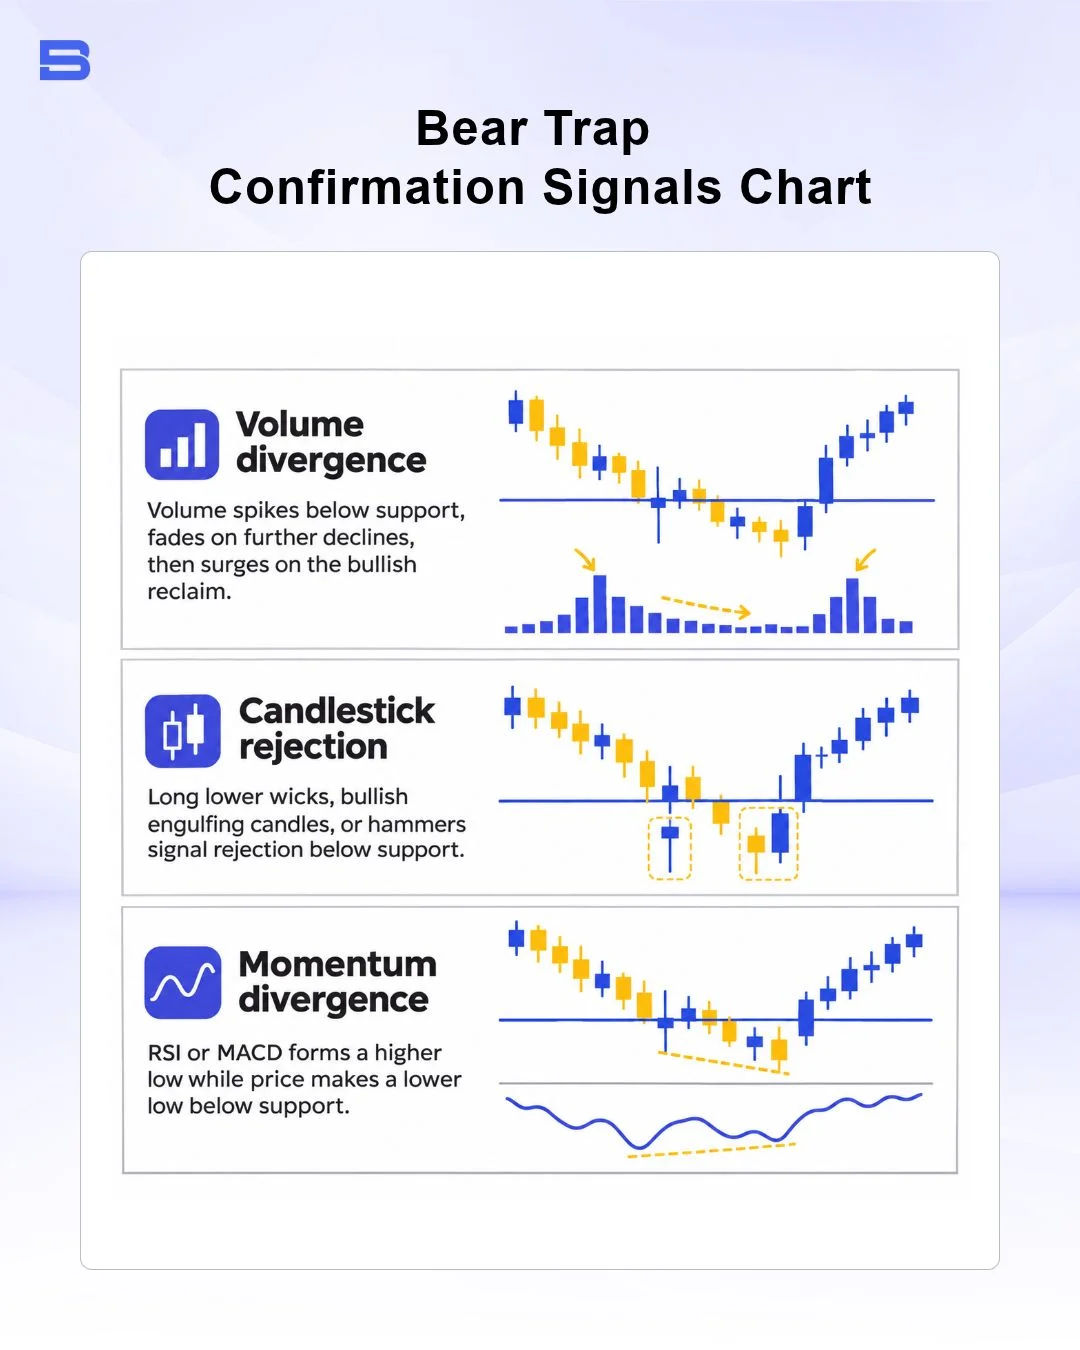
Look for three overlapping technical clues before treating a dip as a failed breakdown:
- Volume divergence: Trading volume (tick volume on spot forex charts, since currencies trade without a central exchange) spikes during the initial poke below support as stop-losses trigger, then dries up on subsequent downward pushes before surging on the green reclaim candle.
- Candlestick rejection: Long lower wicks, bullish engulfing candles, or hammer formations appear right below the breached level, showing buyers rejecting lower prices before the candle closes.
- Momentum oscillator divergence: Indicators like the Relative Strength Index (RSI) or MACD print a higher low even as price prints a slightly lower low beneath support.
Evaluating these signals together can help you avoid guessing at the exact bottom while the market is still falling.
How to Separate a False Breakdown From a Real Trend Change
Separating a false breakdown from a real structural shift requires patience, because intraday price spikes frequently pierce support before the session settles. Waiting for a full candle close back above the broken support level filters out many premature entries.
The trade-off is clear: waiting for confirmation means you enter at a higher price and must place a wider stop-loss below the trap low. Accepting a slightly less favorable entry price is generally the cost of avoiding catching a falling knife during a legitimate trend reversal.
Bear Trap Trading Strategy: Worked Example and Risk Controls
A structured trading strategy relies on predefined entry triggers and strict position sizing rather than reacting emotionally to a sudden green candle. Consider a hypothetical EUR/USD setup where price has held firm support at 1.1000 across multiple sessions.
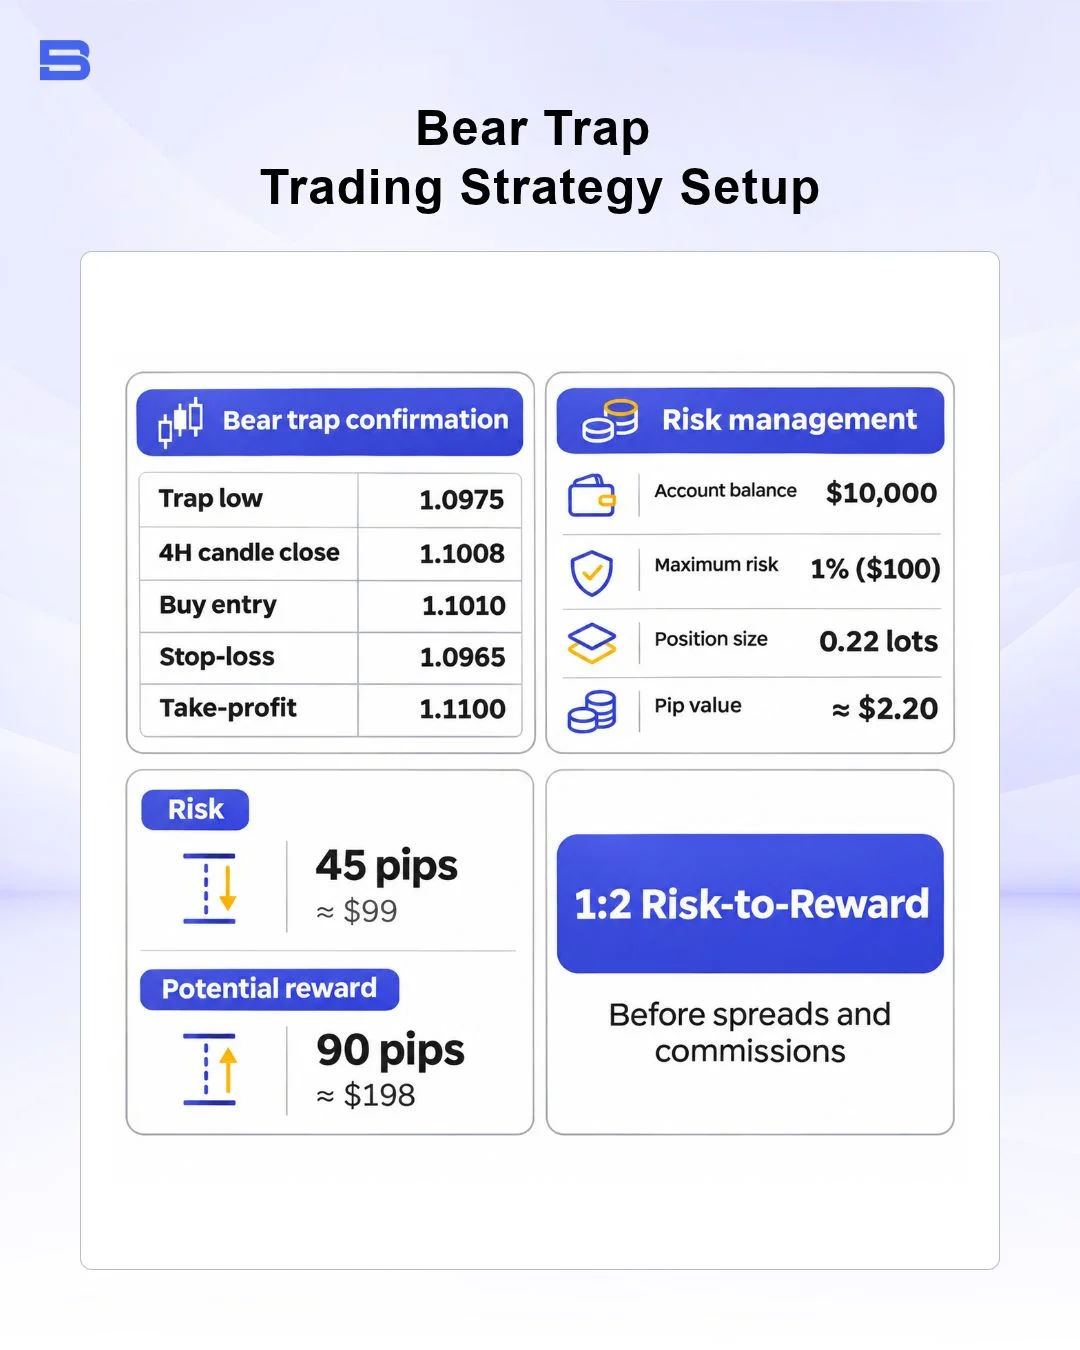
Suppose EUR/USD dips to an intraday low of 1.0975, triggering sell stops, but reverses within the same four-hour candle to close back at 1.1008. To confirm buyers have regained control, you set a buy entry at 1.1010 and place your stop-loss 10 pips below the trap low at 1.0965, creating a 45-pip risk distance.
On a $10,000 trading account with a strict 1% maximum risk rule ($100 risk budget), you size your position at roughly 0.22 standard lots (where each pip equals approximately $2.20). If price rallies 90 pips to the upper range resistance at 1.1100, the trade yields a 2:1 reward-to-risk gain of about $198 before spreads and commissions.
Trading leveraged instruments such as forex and CFDs magnifies your exposure to market movements, increasing both potential gains and losses. If price falls to your stop-loss at 1.0965, your position would incur a projected loss of about $99, assuming the trade is executed at that price without additional slippage or transaction costs.
If a trader skips the stop-loss or uses excessive leverage during volatile news releases, slippage can push actual losses well beyond the planned 1% threshold.
Bear Trap vs. Bull Trap: Spotting Opposite False Breakouts
Comparing a bear trap vs. bull trap highlights how market psychology mirrors itself at opposite ends of a price range. Both setups punish traders who enter aggressively on an unconfirmed breakout, but they trap different sides of the order book:
- Bear trap: Price breaks below support, lures in short sellers, and reverses upward, inflicting losses on bearish positions.
- Bull trap: Price breaks above resistance, attracts breakout buyers, and reverses downward, leaving long traders stuck at the top.
In both scenarios, liquidity sits just beyond obvious chart boundaries where retail traders place stop orders. Reviewing related formations like a bull trap, a falling wedge pattern, or a dead cat bounce helps you map out where false moves commonly cluster within broader chart patterns and incorporate those rules into your investment plan.
Bear Trap Takeaways: Confirm Before You Trade
A bear trap illustrates why price breaking a support line is only half the story. What happens after the breach matters far more. Waiting for a confirmed candle close back above support, verifying volume or momentum shifts, and sizing every position around a hard stop-loss below the trap low may help limit losses whether a breakdown fails or follows through.
- How to Build an Investment Plan That Actually Works for You?
- What Is the MACD Indicator and How to Use It
- What Is a Wedge Pattern in Trading?
- What Is Ichimoku Cloud Strategy? A Complete Trading System
- Mastering Elliott Wave Theory: Rules and Trading Strategies
- News Trading: Strategies, Execution Risks, and Risk Control
- What Is an Iron Condor Options Strategy?
- Backtesting Explained: What It Is and Why It Really Matters
- Grid Trading: Mechanics, Parameters, and Risk Strategies
- What Is Breakout Trading and How Does It Work?
- Mean Reversion: Technical Strategies and Risk Frameworks
- Momentum Trading: Indicators, Strategies, and Risk Control
- Hammer Candlestick: Structure, Meaning, and Strategy
- Doji Candlestick: Types, Signals, and Trading Strategies
- What Is the Sharpe Ratio and How to Calculate It
- What Is VWAP and How Do Traders Use It?
- Trade the Ascending Triangle: A Step-by-Step Practical Guide
- What Is the Stochastic Oscillator and How to Use It
- How to Trade the Descending Triangle Pattern
- High Frequency Trading: Speed, Algorithms, and Market Impact
- What Is Volume Profile and How to Use It in Trading
- What Is a Morning Star Pattern Candlestick?
- Trade with Parabolic SAR: A Practical Analysis Guide
- Evening Star Pattern: Structure, Rules, and Risk Controls
- Kelly Criterion: Formula, Position Sizing, and Risk
- What Is the NYSE Minimum Trading Price? Rules Explained
Disclaimer: The content on this page is intended for educational and informational purposes only. It does not constitute financial, investment, tax, or legal advice, and should not be interpreted as a recommendation to buy, sell, or hold any financial instrument or asset. Trading and investing involve significant risk, including the possible loss of your entire capital. Products such as forex, CFDs, and cryptocurrencies carry additional risks due to leverage, high volatility, and limited regulatory protection in some jurisdictions. Past performance of any financial instrument does not guarantee future results. Any market views, forecasts, or opinions expressed are those of the author at the time of writing and may not reflect current market conditions. Platform features, fees, and regulatory status are subject to change — always verify information directly with the relevant provider or regulator before making any financial decision. BrokerSpecs may receive compensation from third parties featured on this site. Always conduct your own due diligence and consider seeking advice from a licensed financial professional before investing. Portions of this article were prepared with the assistance of AI tools and reviewed by our editorial team before publication.