



Related Tags
Imagine watching a stock trade inside a narrow $2 range for three weeks while buyers and sellers repeatedly test the same ceiling. Overnight, the company reports unexpected earnings growth, and at the opening bell, the share price leaps $4 above resistance without a single trade occurring in between. That space on your chart is a breakaway gap, and it often marks the opening act of a sustained directional trend.
What Is a Breakaway Gap?
A breakaway gap is a sudden price jump on a chart that pushes an asset cleanly past a key support or resistance level, leaving a space with no trading activity. Unlike routine overnight price fluctuations inside a sideways range, this formation may signal that a prolonged battle between buyers and sellers has been resolved in one direction.
These gaps typically appear at the end of established chart patterns such as triangles, rectangles, or head-and-shoulders bases. When a major catalyst emerges while a market is closed or liquidity is limited, investors may reassess asset values and submit orders heavily concentrated on one side of the market.
If opposing orders are insufficient to absorb this demand, the resulting order imbalance can push the next opening price significantly away from the previous session’s closing level, creating a price gap.
Bullish vs. Bearish Breakaway Gaps
A bullish price gap occurs when price leaps above an established resistance ceiling after an accumulation phase, which may signal that strong demand has absorbed much of the available supply at lower levels. Traders look for the gap’s lower boundary to act as a new support floor on subsequent sessions.
Conversely, a bearish breakaway gap forms when price plunges below a multi-week support floor following distribution, driven by urgent selling pressure. In both cases, heavy trading volume during the gap session can help distinguish a move backed by broad market participation from a thin liquidity blip, though high volume alone never guarantees that a new trend will hold.
Breakaway Gap vs. Common, Runaway, and Exhaustion Gaps
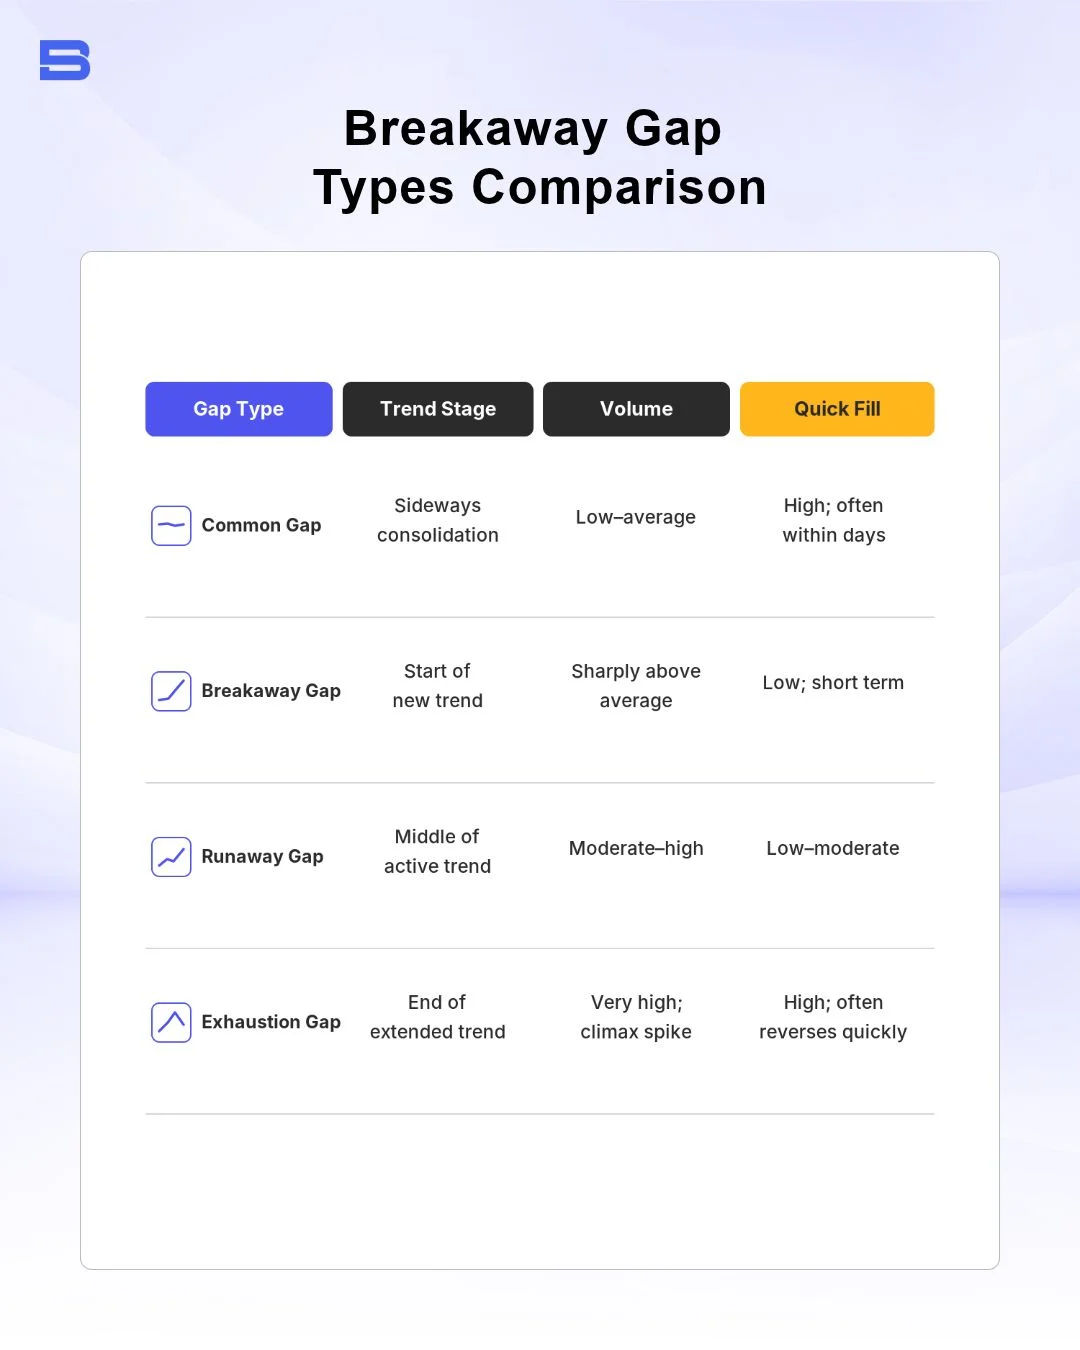
Not every space on a candlestick chart carries the same technical meaning. Comparing a breakaway gap with the other three gap types helps you identify which stage of a trend you are viewing. A common gap appears inside a sideways range and often fills within days, a runaway gap forms in the middle of an active trend, and an exhaustion gap appears near the end of an extended trend and often reverses quickly.
How a Breakaway Gap in Trading Works Across Stocks and Forex/CFDs
Gap behavior depends on how your chosen market handles off-hours order flow. Exchange-traded equities on venues like Bursa Malaysia or US stock exchanges have a regular overnight closure, during which significant earnings releases or regulatory announcements can influence investor sentiment and trading decisions.
Although some stocks trade during extended hours, liquidity is generally lower than during regular sessions. Orders can also be submitted ahead of the next opening auction, where an imbalance between buy and sell interest may influence the opening price.
By contrast, spot forex trades around the clock five days a week, while many index CFDs follow the near-24-hour schedule of their underlying markets with a short daily break. As a result, forex gaps mostly appear at the weekly open after weekend geopolitical or central bank shocks, while index CFDs can also gap when trading resumes after the daily break. During these weekend openings or major rate decisions, liquidity providers widen their bid-ask spreads sharply, which can trigger stop-loss orders at far worse prices than expected.
Breakaway Gap Trading Strategy: Entry, Volume, and Stop-Loss Rules
A structured trading strategy relies on confirming participation before committing capital, rather than chasing the first emotional candle at the market open. Follow three core filters to separate high-conviction breakouts from fragile spikes:
- Volume confirmation: Look for gap-day trading volume at least 1.5 to 2 times higher than the 20-day average volume as a sign of unusually strong market participation. Higher volume can strengthen confirmation of the price move, although it does not independently prove institutional involvement.
- Boundary defense: Watch whether price holds above the upper edge of a bullish gap (or below the lower edge of a bearish gap) through the first hour of trading.
- Risk-first entry: Enter either on a confirmed candle close above the gap-day high or on a controlled pullback that tests the top of the gap without closing inside it.
These filters help keep you out of weak morning spikes, though even textbook volume can fail if broader market sentiment reverses intraday.
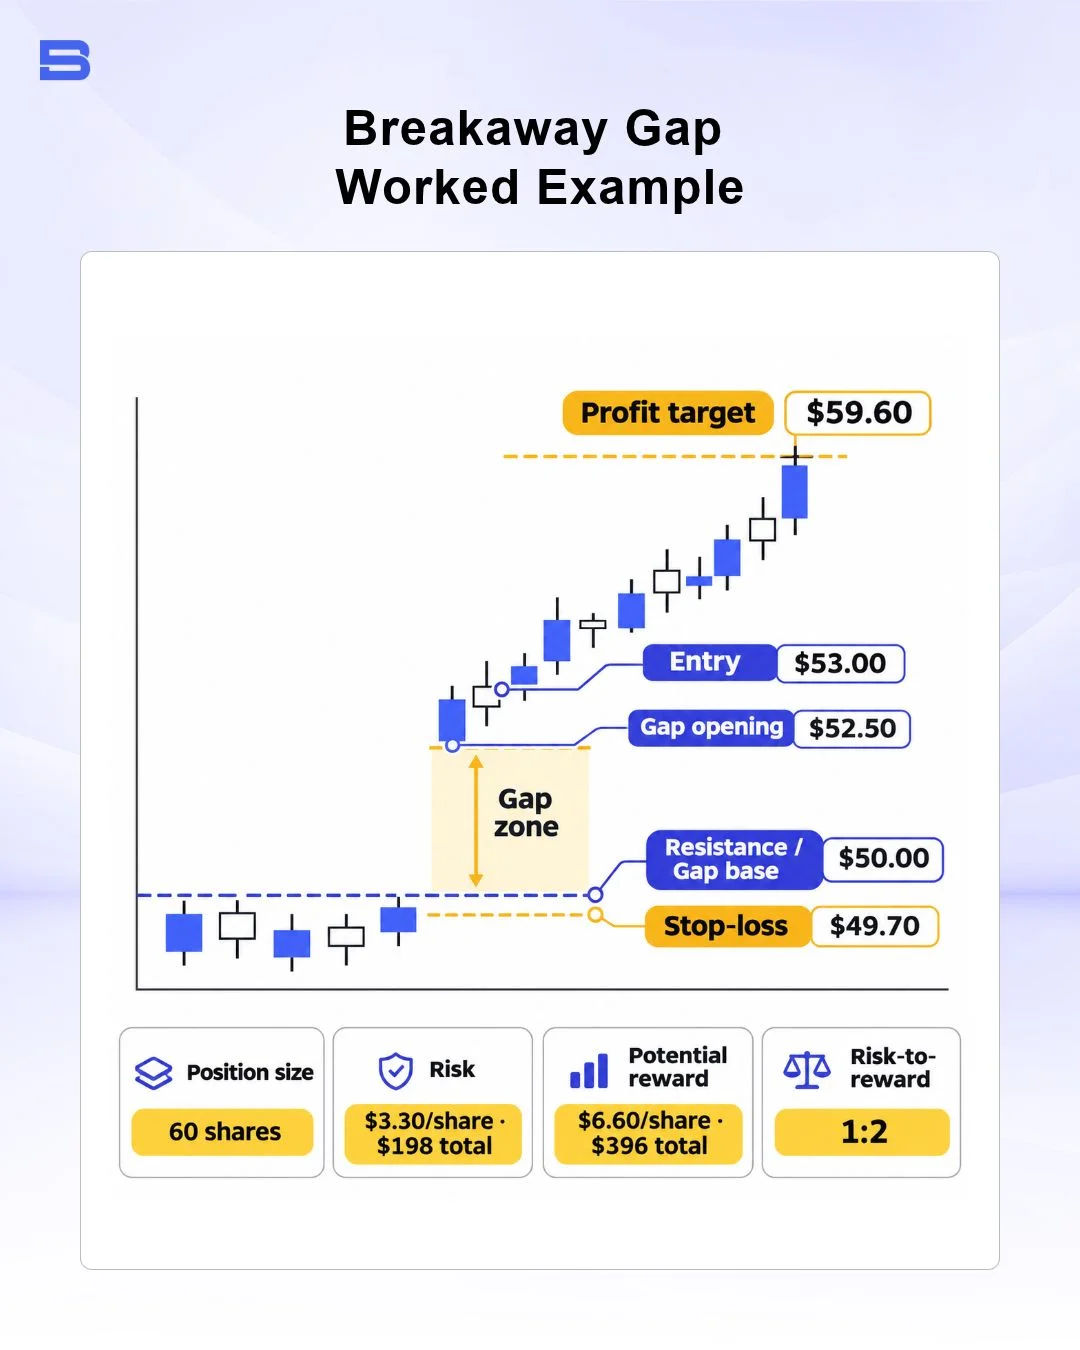
Consider a practical example on a stock that has consolidated below $50.00 resistance for four weeks with an average daily volume of 1 million shares. Following a strong quarterly report, the stock opens at $52.50, leaving a $2.50 breakaway gap, and finishes the first hour at $53.00 on 2.4 million shares traded.
Suppose you hold a $20,000 trading account and cap risk at 1% ($200) per trade within your broader investment plan. You buy 60 shares at $53.00 ($3,180 position value) and place your stop-loss at $49.70, just below the $50.00 gap base, risking $3.30 per share ($198 total loss if triggered).
If momentum continues toward $59.60, your $6.60 per-share gain yields $396 (a 2:1 reward-to-risk ratio). However, if sellers overwhelm buyers and price closes back below $50.00, the gap fails, and you exit with a controlled $198 loss—or slightly more if overnight slippage pushes execution below your $49.70 stop.
Common Mistakes and False Breakaway Gap Traps
Even experienced chart readers misread breakaway gaps when they ignore context or skip position sizing. Watch out for three recurring pitfalls before placing an order:
- Trading low-volume gaps: A price jump on weak volume usually reflects thin liquidity rather than genuine accumulation, increasing the odds of a rapid reversal.
- Confusing early reversals with an island reversal pattern: When price gaps up and then gaps down days later without overlapping, the isolated cluster typically signals exhaustion rather than the start of a sustained trend that suits breakout trading.
- Using oversized leverage on CFD gaps: Leveraged CFDs amplify gains when a gap runs in your favor, but they magnify losses just as quickly when a gap snaps shut—a 2% adverse reversal on a 20:1 leveraged position erodes 40% of your posted margin.
Treating every gap as an automatic entry invites preventable drawdowns whenever market conditions turn choppy.
Conclusion
A breakaway gap can offer an early visual signal that supply and demand have shifted past a key technical barrier. Combining above-average volume confirmation with a predefined stop-loss just beyond the gap zone can help you participate in emerging trends while limiting downside exposure. Keep in mind that a gap that opens beyond your stop can still cause a larger loss than planned.
- How to Build an Investment Plan That Actually Works for You?
- What Is the MACD Indicator and How to Use It
- What Is a Wedge Pattern in Trading?
- What Is Ichimoku Cloud Strategy? A Complete Trading System
- Mastering Elliott Wave Theory: Rules and Trading Strategies
- News Trading: Strategies, Execution Risks, and Risk Control
- What Is an Iron Condor Options Strategy?
- Backtesting Explained: What It Is and Why It Really Matters
- Grid Trading: Mechanics, Parameters, and Risk Strategies
- What Is Breakout Trading and How Does It Work?
- Mean Reversion: Technical Strategies and Risk Frameworks
- Momentum Trading: Indicators, Strategies, and Risk Control
- Hammer Candlestick: Structure, Meaning, and Strategy
- Doji Candlestick: Types, Signals, and Trading Strategies
- What Is the Sharpe Ratio and How to Calculate It
- What Is VWAP and How Do Traders Use It?
- Trade the Ascending Triangle: A Step-by-Step Practical Guide
- What Is the Stochastic Oscillator and How to Use It
- How to Trade the Descending Triangle Pattern
- High Frequency Trading: Speed, Algorithms, and Market Impact
- What Is Volume Profile and How to Use It in Trading
- What Is a Morning Star Pattern Candlestick?
- Trade with Parabolic SAR: A Practical Analysis Guide
- Evening Star Pattern: Structure, Rules, and Risk Controls
- Kelly Criterion: Formula, Position Sizing, and Risk
- What Is the NYSE Minimum Trading Price? Rules Explained
Disclaimer: The content on this page is intended for educational and informational purposes only. It does not constitute financial, investment, tax, or legal advice, and should not be interpreted as a recommendation to buy, sell, or hold any financial instrument or asset. Trading and investing involve significant risk, including the possible loss of your entire capital. Products such as forex, CFDs, and cryptocurrencies carry additional risks due to leverage, high volatility, and limited regulatory protection in some jurisdictions. Past performance of any financial instrument does not guarantee future results. Any market views, forecasts, or opinions expressed are those of the author at the time of writing and may not reflect current market conditions. Platform features, fees, and regulatory status are subject to change — always verify information directly with the relevant provider or regulator before making any financial decision. BrokerSpecs may receive compensation from third parties featured on this site. Always conduct your own due diligence and consider seeking advice from a licensed financial professional before investing. Portions of this article were prepared with the assistance of AI tools and reviewed by our editorial team before publication.