



Related Tags
You are watching a sharp sell-off on EUR/USD when price drops into a major daily demand zone and prints a long red candle. Instead of breaking lower on the next bar, price touches that exact same low again, stalls, and closes higher in green.
When two consecutive candles share an identical or nearly identical floor after a decline, you are looking at a tweezer bottom candlestick pattern. It signals that selling momentum has hit a wall and buyers are defending that specific price level.
What Is the Tweezer Bottom Candlestick Pattern?
The tweezer bottom candlestick pattern is a two-candle bullish reversal formation that appears at the end of a downtrend when two consecutive candles record nearly identical lows. The first candle closes bearish to continue the drop, while the second candle rejects the same floor and closes bullish.
Think of this setup as a real-time tug-of-war at a floor. On the first candle, sellers push price down aggressively and close near the low, confident that the downtrend remains intact.
On the second candle, sellers try to press price below that prior low, but buyers step in with enough limit orders to absorb the supply. Instead of breaking down, price bounces off the exact same price level and closes above the second candle’s open.
In liquid markets like forex or large-cap equities, a tolerance of 1 to 3 pips or ticks between the two lows is normal due to spread fluctuations. Unlike a classic double bottom, which spans dozens of bars with a distinct swing peak in between, a tweezer bottom forms over two adjacent candles.
Like other technical chart formations, this two-candle signal reflects the collective behavior and psychology of market participants rather than guaranteeing a trend reversal. As the CFA Institute explains, technical patterns help traders assess the probability of future price movements, but their interpretation remains subjective and requires broader market context.
How to Spot a Valid Tweezer Bottom Pattern
Not every pair of candles with matching lows signals a high-probability reversal. You need four specific structural elements on your chart before treating a formation as a valid tweezer bottom pattern.
- A clear preceding downtrend: The pattern must appear after a sustained decline or swing pullback, because a reversal signal cannot reverse a trend that does not exist.
- Matching or near-matching lows: Both candles must test the same support floor, whether via their lower wicks or flat candle bottoms.
- Contrasting candle direction: The first candle should be bearish and the second candle bullish, showing an immediate shift from selling pressure to buying defense.
- Meaningful timeframe context: Patterns on 4-hour, daily, or weekly charts tend to carry more weight than those on noisy 1-minute or 5-minute charts.
Many traders confuse this two-candle structure with single-candle rejection signals. A hammer candlestick or a pin bar shows a long lower wick on a single bar, while a dragonfly doji candlestick closes right at its open and high.
In contrast, a tweezer bottom candlestick pattern requires two separate sessions to test and reject the exact same price floor. When the second candle closes as a strong bullish marubozu candlestick with virtually no upper wick, it demonstrates even stronger buyer conviction off that shared low.
How to Trade Tweezer Bottom Setups with Risk Controls
Spotting the two-candle shape is only half the work. Entering blindly without confirmation exposes your capital to a simple pause in a continuing downtrend. A disciplined approach combines level confluence, confirmation triggers, and strict position sizing.
First, check whether the matching lows align with an established support and resistance zone, a major moving average, or a key Fibonacci retracement level. Second, wait for a third candle to break and close above the high of the second candle before entering a long position.
You can also check momentum oscillators like the Relative Strength Index (RSI) for bullish divergence, where price makes equal lows while RSI prints a higher low. Because leveraged products like forex and CFDs magnify both gains and losses, calculating your exact position size before clicking buy is essential.
Consider a practical example on EUR/USD using a $10,000 trading account with a strict 1% maximum risk rule ($100 risk per trade). Suppose EUR/USD drops to a daily support zone at 1.0800, printing a bearish candle with a low of 1.0800 and a high of 1.0840, followed by a bullish candle with a low of 1.0801 and a high of 1.0835.
Once a third candle closes above the second candle’s high of 1.0835, you enter long at 1.0837 and set your stop-loss 10 pips below the shared floor at 1.0790. Your total stop distance is 47 pips (1.0837 minus 1.0790).
To keep your maximum loss capped at $100, you divide $100 by 47 pips, which equals roughly $2.12 per pip, or 0.21 standard lots. If you target a 1:2 risk-reward ratio, your take-profit sits 94 pips higher at 1.0931 for a potential $200 gain, while a drop through support limits your loss to $100 (excluding spread or slippage).
Tweezer Bottom vs. Bullish Engulfing and Other Reversal Signals
Different bullish candlestick patterns measure buyer strength in distinct ways. Understanding how a tweezer bottom compares to nearby formations helps you judge whether buyers are merely defending a floor or actively overwhelming sellers.
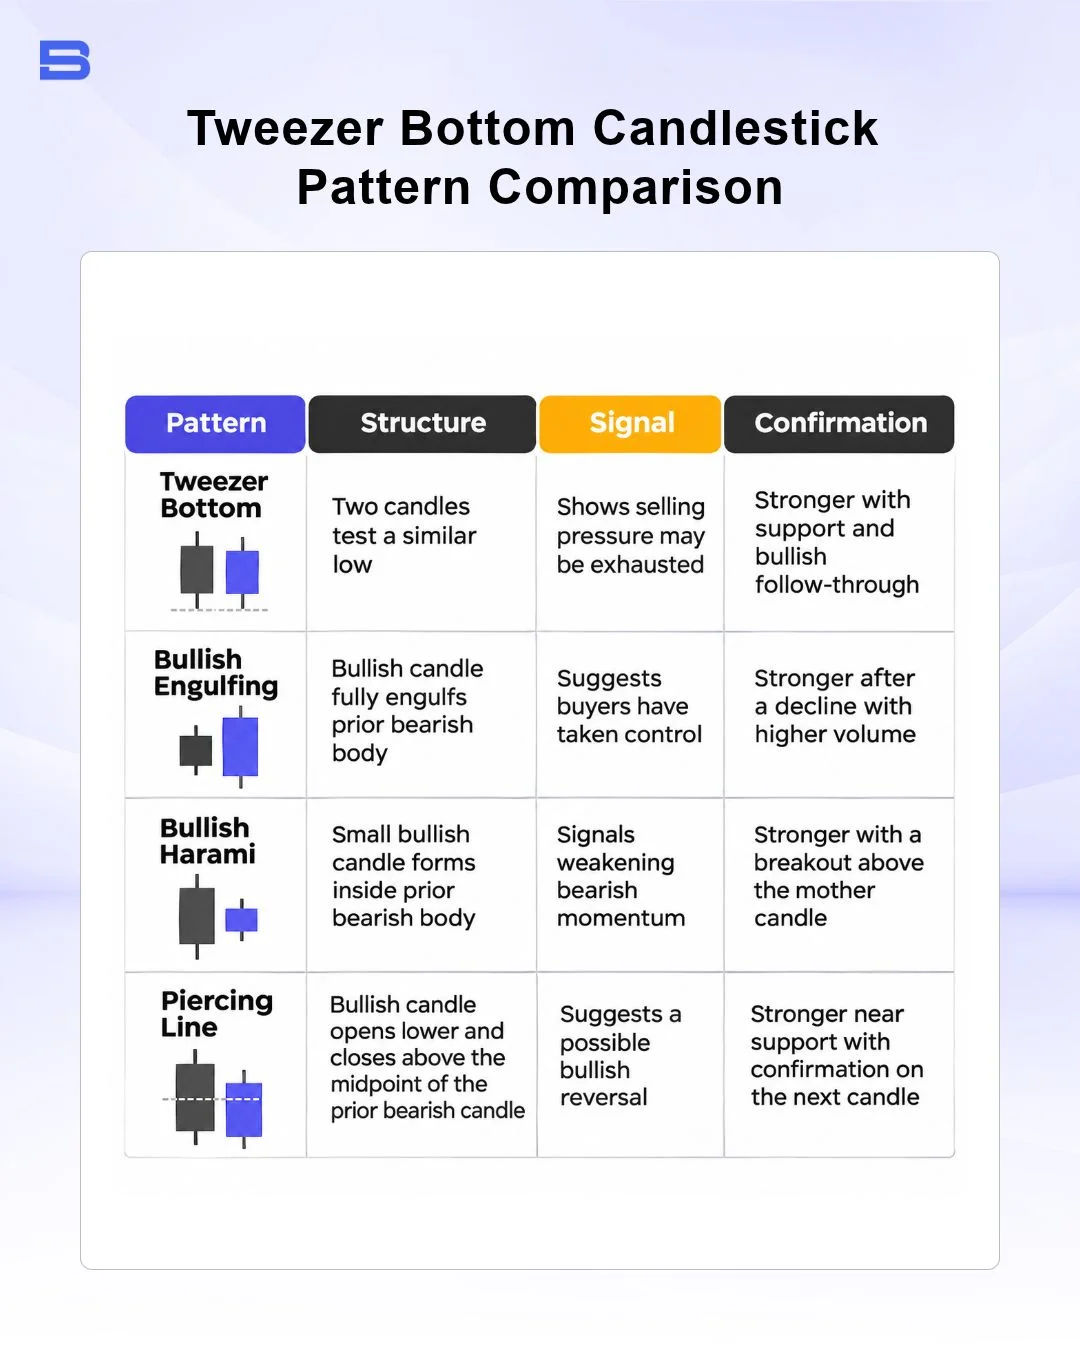
A bullish engulfing pattern requires the second green candle’s body to completely swallow the first red candle’s body, signaling aggressive upward momentum. By comparison, a tweezer bottom focuses on the precision of the shared low rather than the size of the second candle’s body.
Similarly, a bullish harami features a small green candle tucked inside the prior red candle’s body, indicating hesitation rather than an immediate rejection of a floor. A piercing line candlestick pattern gaps lower at the open before closing past the midpoint of the prior red candle, whereas an inverted hammer candlestick or an inside bar relies on upper-wick rejection or volatility contraction to signal a potential turn.
Managing a Failed Tweezer Bottom and False Signals
Every candlestick pattern can fail, especially when strong macroeconomic news or institutional selling overwhelms a technical support level. A tweezer bottom is officially invalidated the moment a subsequent candle closes decisively below the shared low of the two pattern candles.
False signals tend to occur more often during low-liquidity sessions, such as the late Asian session for European currency pairs, or inside choppy, sideways ranges where price repeatedly whipsaws around the same level. If price breaks below 1.0790 in the earlier example, exiting immediately at your stop-loss prevents a small, planned $100 loss from turning into a severe account drawdown.
Conclusion
The tweezer bottom candlestick pattern gives you a clear visual clue that selling pressure is stalling at a defined price floor. When paired with major support levels, third-candle confirmation, and strict position sizing, it helps you structure trades with a predefined exit if the floor breaks.
Like bearish formations such as the bearish harami, dark cloud cover pattern, or gravestone doji candlestick, a tweezer bottom works best as one piece of a broader, risk-managed trading plan.
- How to Build an Investment Plan That Actually Works for You?
- What Is the MACD Indicator and How to Use It
- What Is a Wedge Pattern in Trading?
- What Is Ichimoku Cloud Strategy? A Complete Trading System
- Mastering Elliott Wave Theory: Rules and Trading Strategies
- News Trading: Strategies, Execution Risks, and Risk Control
- What Is an Iron Condor Options Strategy?
- Backtesting Explained: What It Is and Why It Really Matters
- Grid Trading: Mechanics, Parameters, and Risk Strategies
- What Is Breakout Trading and How Does It Work?
- Mean Reversion: Technical Strategies and Risk Frameworks
- Momentum Trading: Indicators, Strategies, and Risk Control
- Hammer Candlestick: Structure, Meaning, and Strategy
- Doji Candlestick: Types, Signals, and Trading Strategies
- What Is the Sharpe Ratio and How to Calculate It
- What Is VWAP and How Do Traders Use It?
- Trade the Ascending Triangle: A Step-by-Step Practical Guide
- What Is the Stochastic Oscillator and How to Use It
- How to Trade the Descending Triangle Pattern
- High Frequency Trading: Speed, Algorithms, and Market Impact
- What Is Volume Profile and How to Use It in Trading
- What Is a Morning Star Pattern Candlestick?
- Trade with Parabolic SAR: A Practical Analysis Guide
- Evening Star Pattern: Structure, Rules, and Risk Controls
- Kelly Criterion: Formula, Position Sizing, and Risk
- What Is the NYSE Minimum Trading Price? Rules Explained
Disclaimer: The content on this page is intended for educational and informational purposes only. It does not constitute financial, investment, tax, or legal advice, and should not be interpreted as a recommendation to buy, sell, or hold any financial instrument or asset. Trading and investing involve significant risk, including the possible loss of your entire capital. Products such as forex, CFDs, and cryptocurrencies carry additional risks due to leverage, high volatility, and limited regulatory protection in some jurisdictions. Past performance of any financial instrument does not guarantee future results. Any market views, forecasts, or opinions expressed are those of the author at the time of writing and may not reflect current market conditions. Platform features, fees, and regulatory status are subject to change — always verify information directly with the relevant provider or regulator before making any financial decision. BrokerSpecs may receive compensation from third parties featured on this site. Always conduct your own due diligence and consider seeking advice from a licensed financial professional before investing. Portions of this article were prepared with the assistance of AI tools and reviewed by our editorial team before publication.