


Related Tags
Watching a strong trend develop on a price chart often triggers a familiar dilemma: enter now and risk buying at the absolute peak, or wait for a pullback and risk watching the market rally without you? Even after securing an entry, deciding where to set a dynamic exit point without getting stopped out by routine price noise presents a constant challenge.
This is where technical analysis tools like the SuperTrend indicator serve a practical purpose. Designed specifically for trend-following strategies, the SuperTrend indicator simplifies market direction and automated trailing stops into a visual overlay plotted directly on your price chart.
What Is the SuperTrend Indicator?
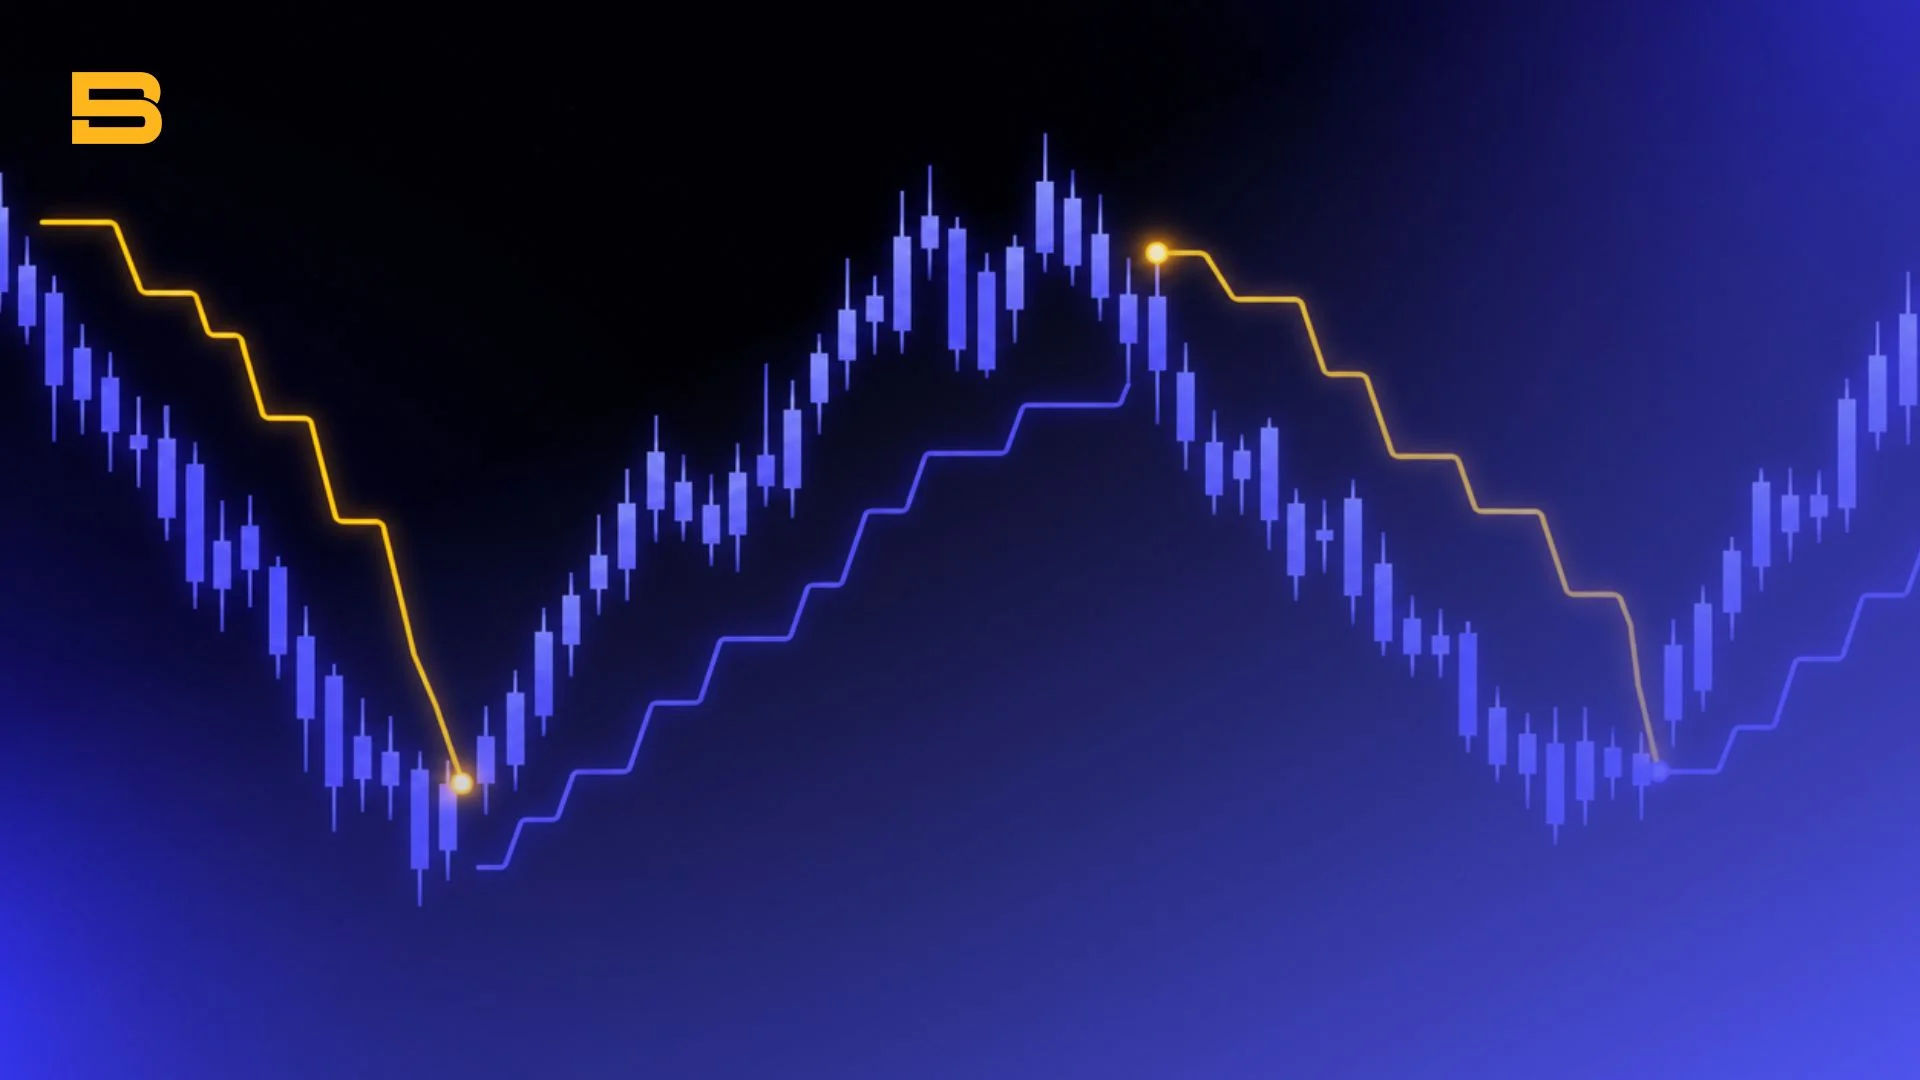
The SuperTrend indicator is a trend-following overlay that plots a continuous, color-coded line directly on price charts to signal direction and dynamic support. When the market trades in a sustained bullish movement, the indicator displays a green line beneath the price candles. Conversely, when prices decline into a bearish trend, the line flips above the price candles and turns red.
Beyond directional bias, the SuperTrend line functions primarily as a dynamic trailing stop-loss level. Because its distance from price is based on volatility, it gives your trades more room when the market is choppy and tightens when conditions are calm, while adjusting upward or downward as the trend progresses.
When price crosses and closes beyond the SuperTrend line, the indicator flips its orientation. A cross from below to above the red line generates a buy signal, while a cross below the green line triggers a sell signal.
How the SuperTrend Indicator Is Calculated
Unlike basic moving averages that rely solely on closing prices, the SuperTrend calculation combines price location with volatility. It uses two primary inputs: the Average True Range (ATR) period and an ATR multiplier. ATR measures how much an asset's price typically moves per candle, including any gaps between sessions.
The indicator first calculates the Median Price for each candle, defined as the average of the High and Low prices:
- Median Price = (High + Low) / 2
Next, it factors in market volatility using the average true range. The ATR measures price range across a set period—typically 10 bars—using a simple moving average or exponential moving average formula. The upper and lower bands are calculated as follows:
- Upper Band = Median Price + (Multiplier x ATR)
- Lower Band = Median Price - (Multiplier x ATR)
When the market is in an uptrend, the SuperTrend line tracks the Lower Band. In a downtrend, it follows the Upper Band.
The ATR multiplier dictates how far away from the median price the line sits. A higher multiplier widens the band, filtering out market noise at the expense of delayed entries. A lower multiplier tightens the line, giving faster signals but exposing you to frequent whipsaws.
Optimal SuperTrend Settings for Different Trading Styles
Choosing the right parameters depends entirely on your target timeframe and execution style. Standard platform defaults—typically a period of 10 and a multiplier of 3—offer a balanced starting point, but refining these inputs aligns the indicator with your risk profile.
SuperTrend settings compared across day trading, standard, and swing trading styles.
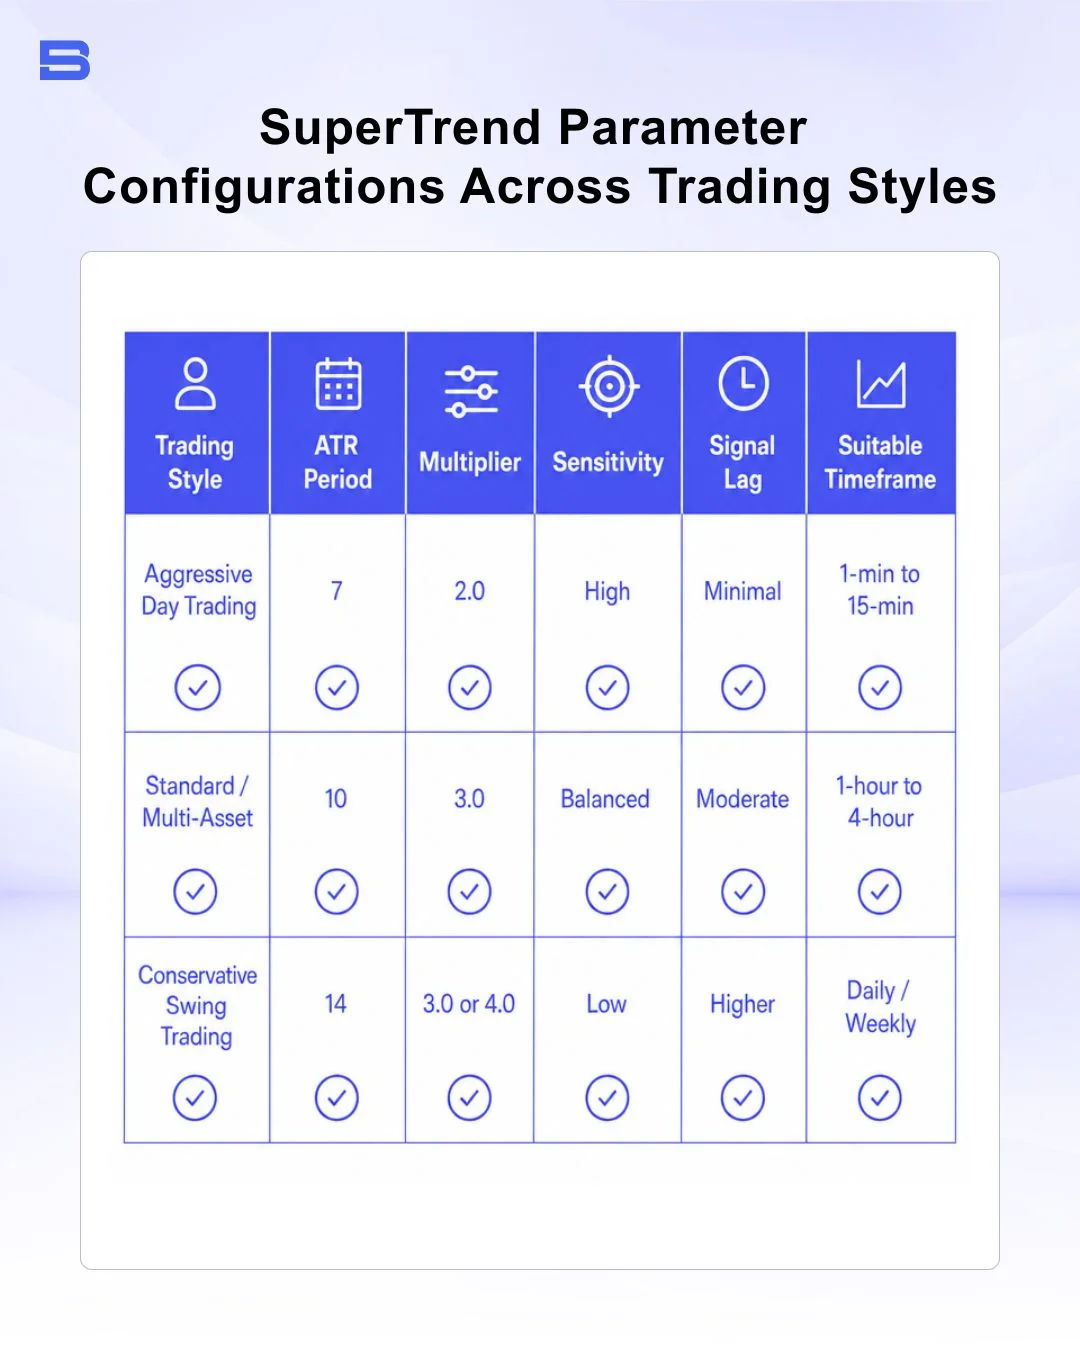
Aggressive day traders operating on shorter timeframes often prefer lower settings, such as (7, 2). This setup reacts quickly to momentum shifts, allowing rapid entries. However, the higher sensitivity increases the likelihood of false signals during brief market pauses.
Conversely, swing trading strategies benefit from conservative settings like (14, 3) or (14, 4). The longer ATR smoothing period tends to cushion the trailing stop against intraday noise, which may help keep you in longer position moves during temporary retracements.
SuperTrend Trading Strategies
The SuperTrend indicator works best as part of a structured execution plan, used alongside disciplined risk control rather than as a standalone signal.
Strategy 1: Pullback Entries in Established Trends
Instead of buying immediately when the indicator flips red-to-green—which often happens after a long bullish candle—wait for a retracement. When a strong uptrend is active, prices frequently pull back toward the green SuperTrend line. Entering near the indicator line improves your risk-to-reward ratio by placing your entry close to your invalidation level, the price at which your trade idea is proven wrong and you would exit.
Strategy 2: Trailing Stop-Loss Management
Executing a solid entry is only half the battle; locking in gains as the market trends is equally critical. You can use the SuperTrend line as an objective, moving stop-loss level.
For example, suppose you enter a long position on the euro/US dollar pair (EUR/USD) at 1.0850, with the SuperTrend line sitting at 1.0810 (a 40-pip initial risk). As EUR/USD advances to 1.0920, the SuperTrend line trails up to 1.0880. By adjusting your broker stop-loss order along with the indicator line, you would lock in roughly 30 pips of profit if the stop is triggered at that level, while staying in the position for potential further upside.
This is a hypothetical example for illustration only. In fast-moving markets or across weekend gaps, stop-loss orders can be filled at a worse price than the level you set (slippage).
Combining SuperTrend with the ADX Indicator for Filtering False Signals
The primary weakness of the SuperTrend indicator occurs during sideways or consolidation phases. Because SuperTrend assumes the market is always trending, a ranging market causes the price to chop back and forth across the line, triggering consecutive losing trades known as whipsaws.
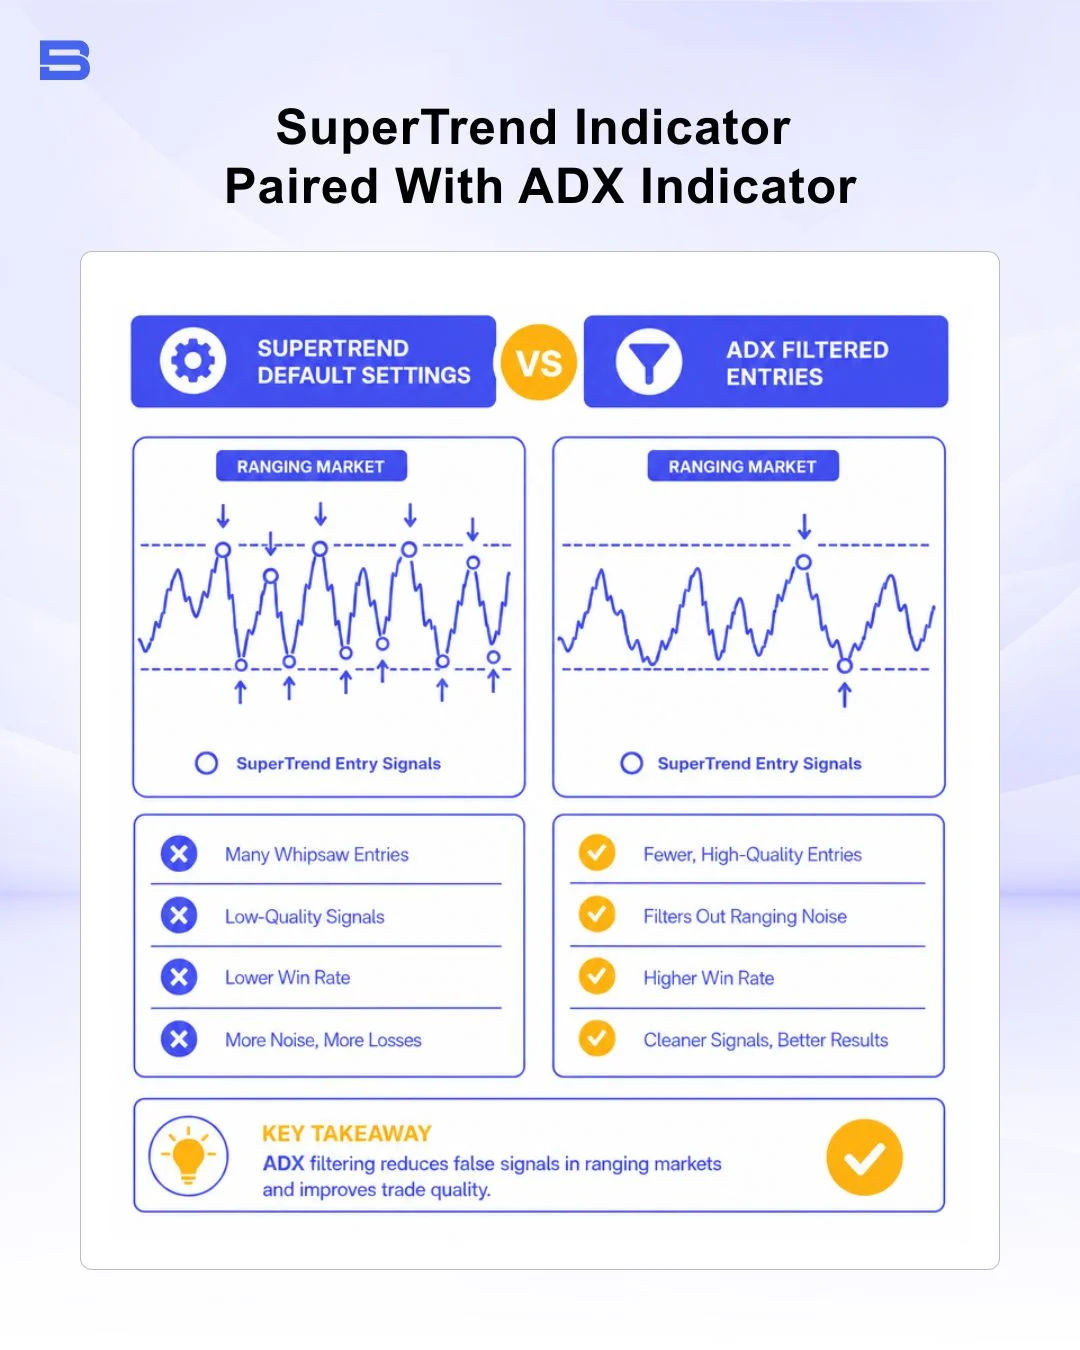
To filter out these false signals, pair SuperTrend with a trend-strength indicator like the Average Directional Index (ADX). Like any technical indicator, SuperTrend has limitations, so it helps to understand where it tends to fail before relying on its signals.
One commonly used combined filter follows two simple rules:
- Trend Strength Confirmation: Only take a SuperTrend buy or sell signal if the ADX reading is above 25. An ADX below 20 indicates a weak, non-trending market where SuperTrend signals should be ignored.
- Volatile Range Rule: If price action contracts into a tight consolidation box and the SuperTrend line flips back and forth more than twice within 10 candles, suspend trading on that asset until a clear breakout occurs.
SuperTrend vs. Parabolic SAR: Key Differences
Traders frequently compare SuperTrend to the Parabolic SAR (Stop and Reverse) indicator, as both function as trend-following overlays designed to set dynamic trailing stops. However, their underlying mechanics create distinct trading behaviors.
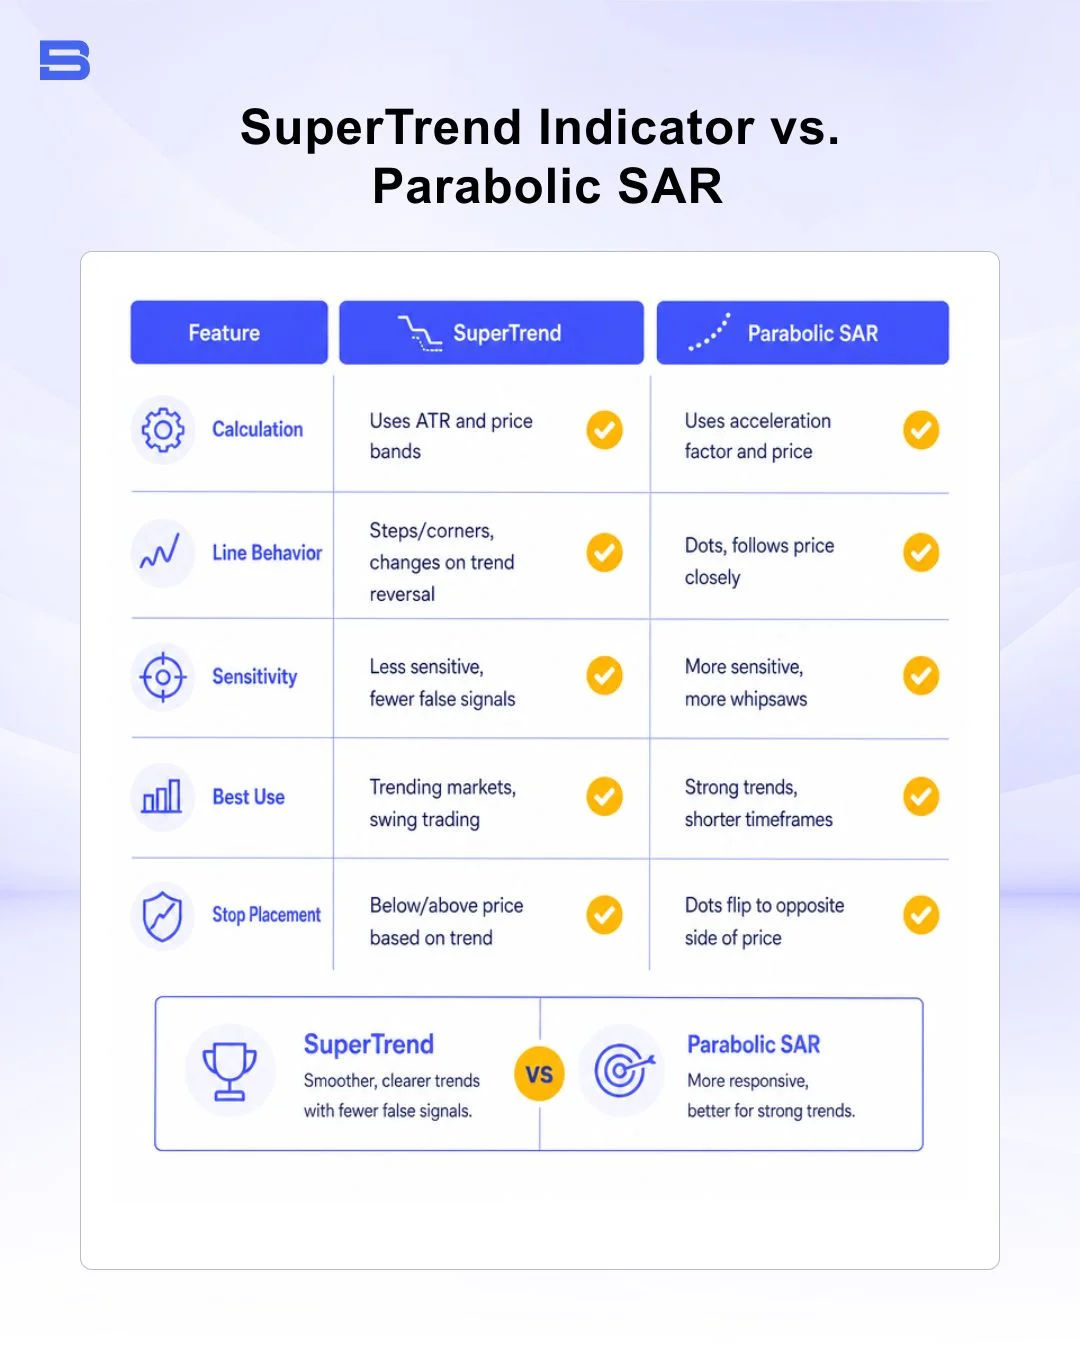
The Parabolic SAR uses an Acceleration Factor that moves the stop dots closer to the price as the trend accelerates, regardless of market volatility. This makes Parabolic SAR highly sensitive during rapid moves, but it can trigger premature exits during healthy market pullbacks.
SuperTrend, by contrast, relies directly on the average true range. Because the SuperTrend line only moves in the direction of the trend, it flattens out when price pauses instead of chasing every tick. Its distance from price is set by the ATR, so the line sits further away when volatility is high and tightens as the market calms.
Where SuperTrend Fits Among Technical Analysis Tools
Within a complete trading toolkit, SuperTrend belongs squarely in the trend-following and risk management category. It does not predict where price will head next; rather, it confirms current direction and provides an objective exit mechanism.
Combining SuperTrend with complementary tools may help you build a more well-rounded analytical framework:
- Direction & Exit: SuperTrend indicator
- Trend Strength Filter: ADX indicator
- Entry Timing & Overbought Levels: Relative Strength Index (RSI) indicator or Candlestick Chart patterns
Relying on a single technical tool in isolation leaves you vulnerable to blind spots. When integrated alongside proper position sizing and volatility filters, SuperTrend becomes a practical anchor for structural trade execution.
Key Takeaways: Using the SuperTrend Indicator Wisely
The SuperTrend indicator is a trend-following tool that uses price and volatility to help you identify the prevailing market direction and potential trend changes. Its straightforward signals can make it useful for spotting possible entry and exit points, but it can also produce false signals when markets move sideways. Combining SuperTrend with other indicators and sound risk-management practices can help you make more informed trading decisions.
- How to Build an Investment Plan That Actually Works for You?
- What Is the MACD Indicator and How to Use It
- What Is a Wedge Pattern in Trading?
- What Is Ichimoku Cloud Strategy? A Complete Trading System
- Mastering Elliott Wave Theory: Rules and Trading Strategies
- News Trading: Strategies, Execution Risks, and Risk Control
- What Is an Iron Condor Options Strategy?
- Backtesting Explained: What It Is and Why It Really Matters
- Grid Trading: Mechanics, Parameters, and Risk Strategies
- What Is Breakout Trading and How Does It Work?
- Mean Reversion: Technical Strategies and Risk Frameworks
- Momentum Trading: Indicators, Strategies, and Risk Control
- Hammer Candlestick: Structure, Meaning, and Strategy
- Doji Candlestick: Types, Signals, and Trading Strategies
- What Is the Sharpe Ratio and How to Calculate It
- What Is VWAP and How Do Traders Use It?
- Trade the Ascending Triangle: A Step-by-Step Practical Guide
- What Is the Stochastic Oscillator and How to Use It
- How to Trade the Descending Triangle Pattern
- High Frequency Trading: Speed, Algorithms, and Market Impact
- What Is Volume Profile and How to Use It in Trading
- What Is a Morning Star Pattern Candlestick?
- Trade with Parabolic SAR: A Practical Analysis Guide
- Evening Star Pattern: Structure, Rules, and Risk Controls
- Kelly Criterion: Formula, Position Sizing, and Risk
- What Is the NYSE Minimum Trading Price? Rules Explained
Disclaimer: The content on this page is intended for educational and informational purposes only. It does not constitute financial, investment, tax, or legal advice, and should not be interpreted as a recommendation to buy, sell, or hold any financial instrument or asset. Trading and investing involve significant risk, including the possible loss of your entire capital. Products such as forex, CFDs, and cryptocurrencies carry additional risks due to leverage, high volatility, and limited regulatory protection in some jurisdictions. Past performance of any financial instrument does not guarantee future results. Any market views, forecasts, or opinions expressed are those of the author at the time of writing and may not reflect current market conditions. Platform features, fees, and regulatory status are subject to change — always verify information directly with the relevant provider or regulator before making any financial decision. BrokerSpecs may receive compensation from third parties featured on this site. Always conduct your own due diligence and consider seeking advice from a licensed financial professional before investing. Portions of this article were prepared with the assistance of AI tools and reviewed by our editorial team before publication.