



Related Tags
The opening bell rings, and the 5-minute candle on your screen surges upward, pausing precisely at an invisible ceiling where institutional volume begins absorbing retail bids. Rather than relying on gut instinct, disciplined market participants map these intraday inflection boundaries before the session even starts. Navigating modern market structure demands reliable reference benchmarks, which is why pivot points trading remains a staple technique across global trading desks.
What Are Pivot Points Trading and How Do Intraday Traders Use Them?
Pivot points trading is the use of objective horizontal price levels calculated from the previous session's high, low, and closing prices to identify potential intraday support and resistance. Because the math relies entirely on completed data from the prior trading day, these levels remain fixed throughout the entire current session. Institutional participants monitor these zones to determine directional bias and evaluate whether an asset is trading at an intraday discount or premium.
When price trades above the central pivot point, floor traders historically treat the market posture as bullish, seeking long entries on shallow pullbacks. Conversely, sustained action beneath the central marker signals a bearish bias where short setups take precedence. Industry best practice emphasizes that robust technical indicators must rely on verifiable price history rather than subjective chart annotations.
Dynamic vs. Static Support and Resistance Levels
Technical boundaries generally fall into two distinct structural categories: static horizontal markers and dynamic lagging curves. Static levels, such as classic floor pivots, stay firmly anchored at the exact price point where the previous session's math plotted them. Dynamic indicators, like exponential moving averages, recalculate continuously with every tick and shift as new bars close.
Fixed horizontal thresholds provide a significant psychological advantage for day traders by establishing firm entry parameters and invalidation markers before live execution begins. Dynamic bands frequently leave room for subjective interpretation during rapid volatility spikes, which can tempt traders to move their protective stops mid-trade. Knowing your boundaries before order submission prevents emotional drift when the order book accelerates.
How to Calculate Pivot Points in Day Trading
Learning how to calculate pivot points in day trading requires only three figures from the preceding session: the high (H), low (L), and close (C). Most modern charting packages compute these markers automatically, but knowing the underlying arithmetic prevents blind reliance on algorithmic tools. The foundation of the system is the central Pivot Point (P), which represents the numerical average of the prior day's range and settlement.
Standard 5-Point Pivot Point Calculation Formula
The standard 5-point pivot points trading calculation formula establishes the central pivot alongside two overhead resistance bands and two underlying support bands:
- Central Pivot Point (P): (High + Low + Close) / 3
- First Resistance (R1): (2 x P) - Low
- First Support (S1): (2 x P) - High
- Second Resistance (R2): P + (High - Low)
- Second Support (S2): P - (High - Low)
These formulas systematically bracket expected intraday volatility. Once P is established, R1 and S1 project the primary boundaries where mean-reversion order flow typically clusters. If aggressive institutional volume forces price past these outer edges, R2 and S2 serve as secondary extension checkpoints.
Comparing Classic, Camarilla, and Fibonacci Pivot Points
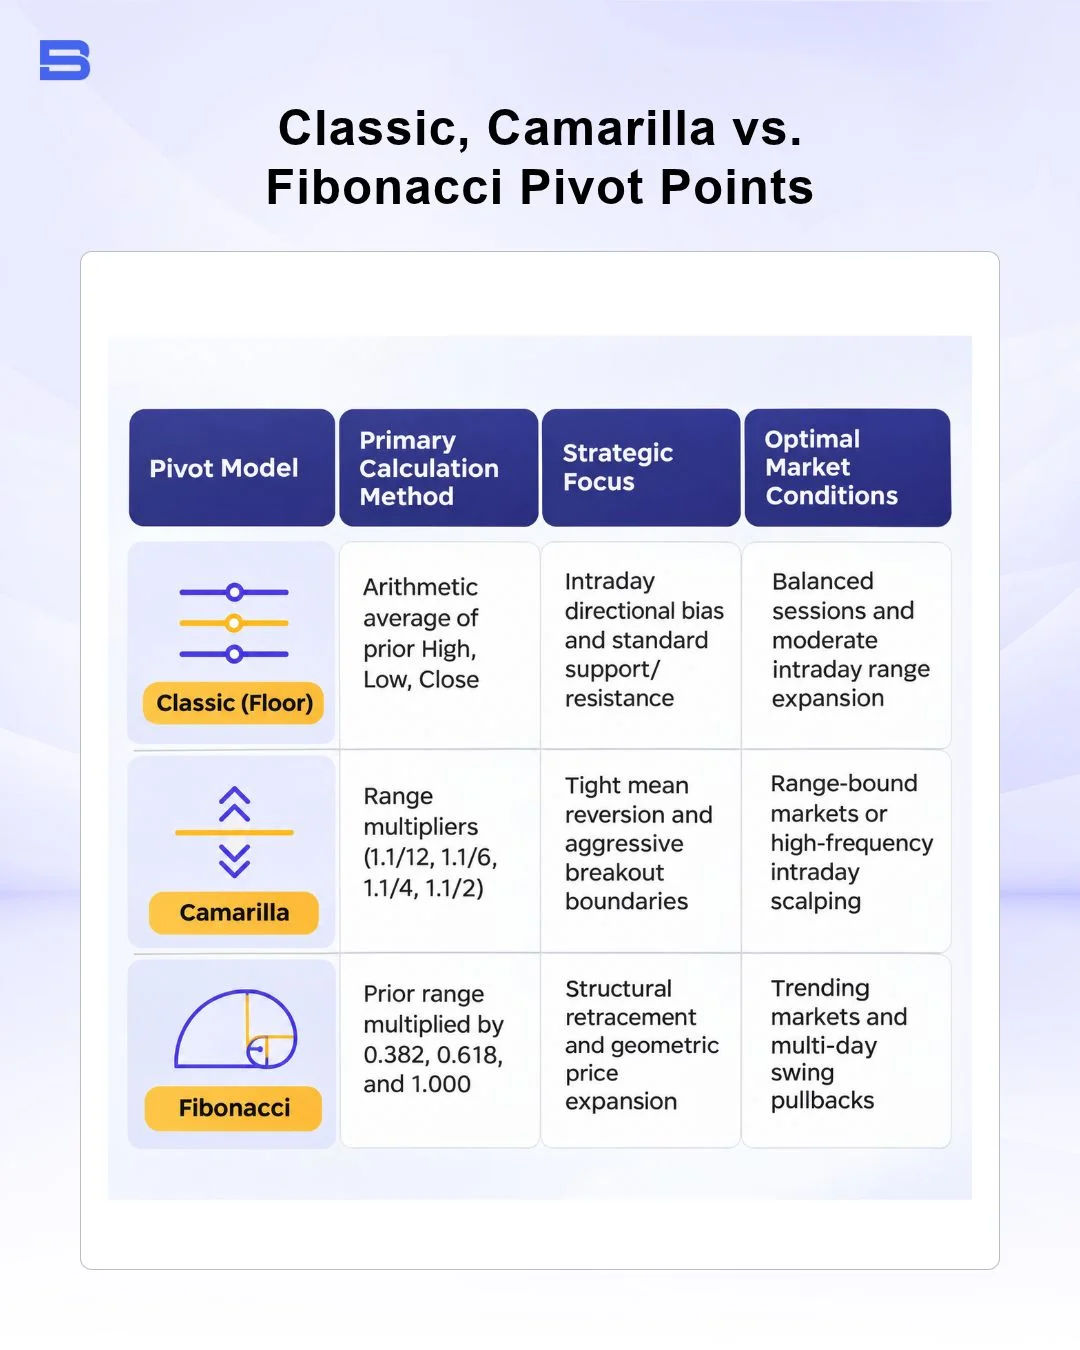
Not every market environment responds equally to standard floor math, leading technicians to adopt specialized variations. Classic pivots remain the benchmark for broad intraday direction across equity indices and liquid forex pairs. Camarilla pivots utilize a tighter multiplier to generate eight distinct levels, concentrating heavily on mean-reversion scalping between L3 and H3 while treating L4 and H4 as pure breakout triggers.
Fibonacci pivots take the central floor value but calculate boundary distances using classic golden ratio proportions (38.2%, 61.8%, and 100%) applied to the prior day's range. These percentage-based bands align well with swing setups where price respects structural harmonic retracements. Choosing the right model depends on whether your strategy targets quiet ranges or momentum expansions.
Core Pivot Point Trading Strategies for Market Reversals and Breakouts
Intraday traders approach floor levels through two primary operational methods: mean-reversion fades and momentum breakouts. In a range-bound market, price frequently tests S1 or R1, absorbs available liquidity, and rotates back toward the central pivot points trading. Fading these outer edges requires waiting for a rejection wick on your execution chart rather than placing blind limit orders into falling knives.
Breakout strategies, by contrast, capitalize on sessions where heavy institutional liquidity overwhelms static bands. When a strong hourly candle closes decisively above R1 on surging volume, the level flips from resistance into support. Traders can look to enter on a retest of R1, targeting R2 or measuring extended impulse legs using a Fibonacci Extension tool to project targets beyond normal daily limits.
Practical Execution: Setting Stop-Loss, Take-Profit, and Confluence
Isolating pivot points trading levels without secondary confirmation creates unnecessary vulnerability. Professional desks demand technical confluence before committing risk, verifying horizontal price zones against volume and momentum.
Monitoring the Volume Weighted Average Price (VWAP) indicator alongside pivot levels confirms whether institutional participants are paying above or below average prices, while the Williams %R (Williams Percent Range), a momentum oscillator that flags overbought and oversold conditions, helps identify momentum exhaustion around S1 or R1 bands.
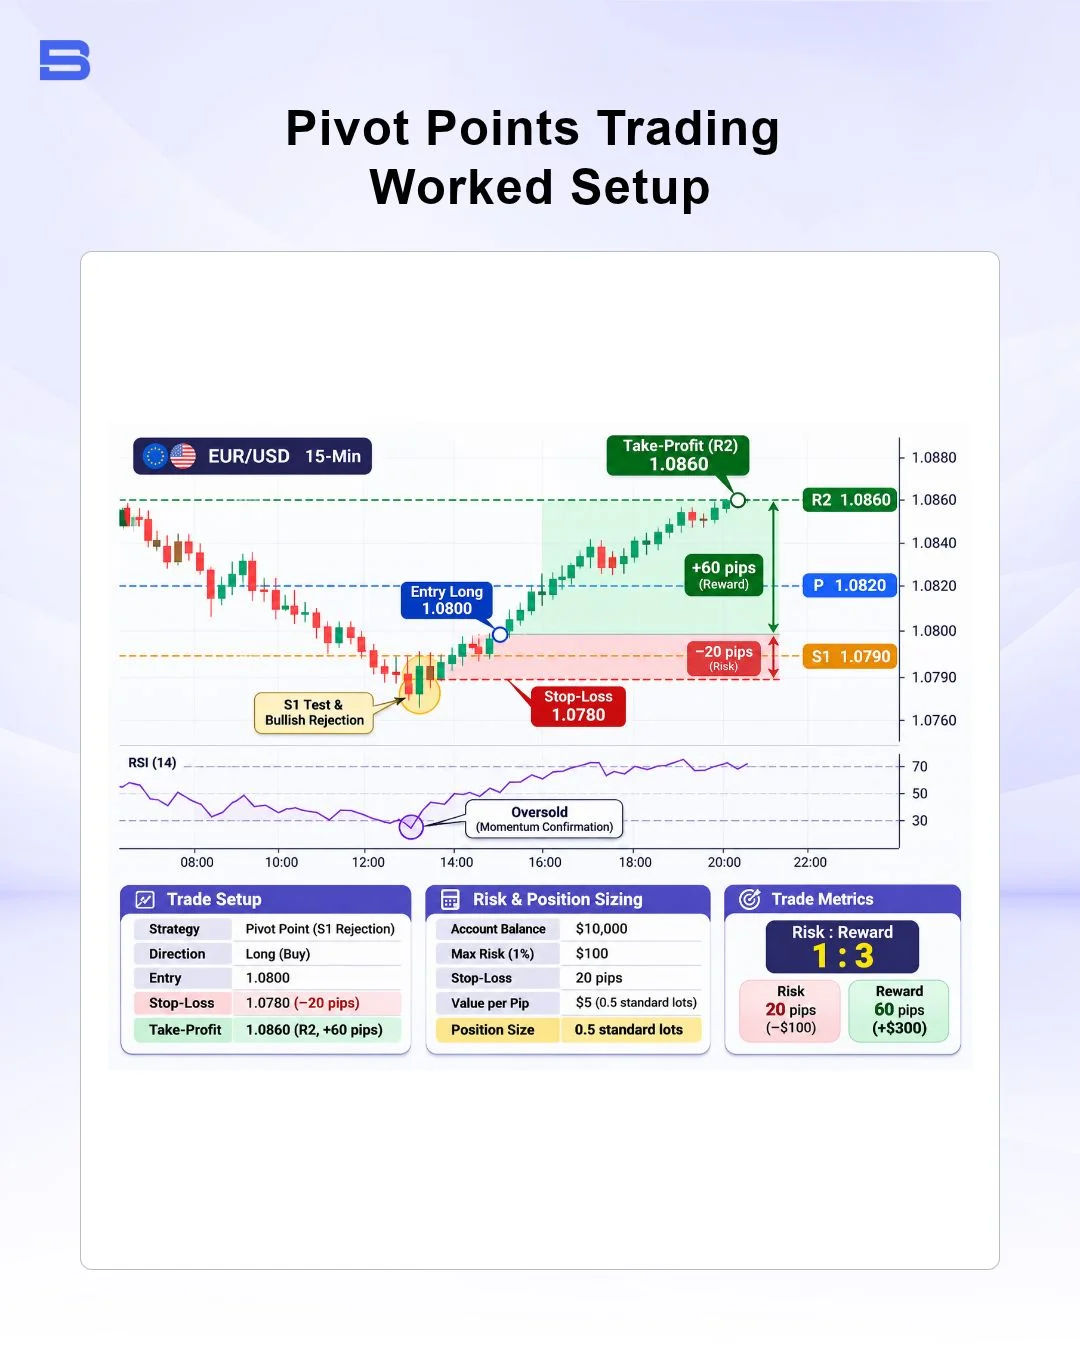
Consider a concrete day trading scenario on EUR/USD with a 10,000 USD account using a strict 1% maximum capital risk rule (100 USD). The daily pivot (P) plots at 1.0820, S1 sits at 1.0790, and R2 sits at 1.0860. The price opens lower, tests S1 at 1.0790, and prints a bullish rejection candle while the momentum oscillator signals oversold conditions.
You enter long at 1.0800 as price reclaims the level. Your invalidation stop-loss is placed at 1.0780 (20 pips below entry, safely behind the session low), and your take-profit target is set at R2 at 1.0860 (a 60-pip target). To limit risk to exactly 100 USD on a 20-pip stop, your position size is capped at 0.5 standard lots (5 USD per pip). These execution parameters create a clear 1:3 risk-to-reward ratio before the order is filled.
Common Pitfalls and False Breakout Risks in Pivot Point Trading
The most dangerous assumption an intraday trader can make is treating pivot points trading levels as impenetrable barriers. During major macroeconomic news releases, static support and resistance lines are routinely violated as institutional algorithms hunt liquidity clusters. A sudden spike above R1 that immediately collapses back below the level forms a classic bull trap, leaving aggressive retail breakout buyers stranded.
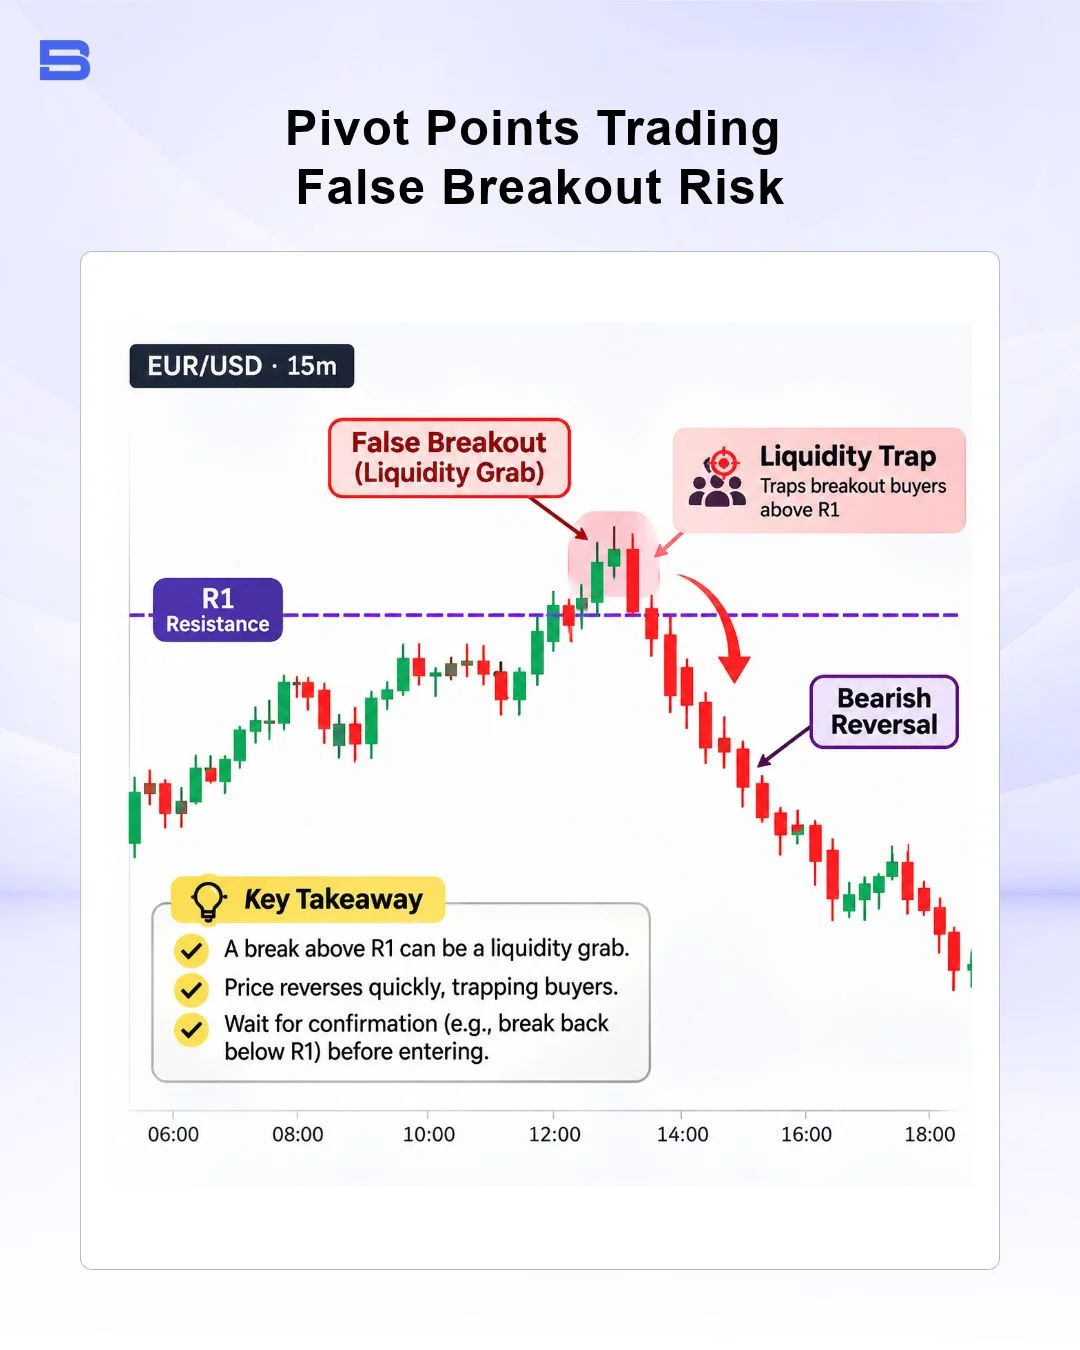
To filter out false breakouts around key markers, pair static floor lines with trend-smoothing indicators like the Hull Moving Average or switch to a Heikin Ashi chart, a candlestick variation that averages price action to smooth out short-term noise, to isolate true structural continuation from intraday noise. Trading derivative contracts with excessive leverage magnifies the danger of failed breakouts, where slippage and rapid market turns can severely erode trading balances.
Regulatory warnings from the Financial Conduct Authority (FCA) highlight that retail derivative traders consistently suffer outsized losses when market volatility breaks expected technical boundaries without adequate protective stops.
The Bottom Line
Pivot points trading provides an objective framework for mapping intraday support, resistance, and market bias. However, long-term consistency relies entirely on pairing these static levels with confirming technical indicators, strict position sizing, and predefined risk management rules.
- How to Build an Investment Plan That Actually Works for You?
- What Is the MACD Indicator and How to Use It
- What Is a Wedge Pattern in Trading?
- What Is Ichimoku Cloud Strategy? A Complete Trading System
- Mastering Elliott Wave Theory: Rules and Trading Strategies
- News Trading: Strategies, Execution Risks, and Risk Control
- What Is an Iron Condor Options Strategy?
- Backtesting Explained: What It Is and Why It Really Matters
- Grid Trading: Mechanics, Parameters, and Risk Strategies
- What Is Breakout Trading and How Does It Work?
- Mean Reversion: Technical Strategies and Risk Frameworks
- Momentum Trading: Indicators, Strategies, and Risk Control
- Hammer Candlestick: Structure, Meaning, and Strategy
- Doji Candlestick: Types, Signals, and Trading Strategies
- What Is the Sharpe Ratio and How to Calculate It
- What Is VWAP and How Do Traders Use It?
- Trade the Ascending Triangle: A Step-by-Step Practical Guide
- What Is the Stochastic Oscillator and How to Use It
- How to Trade the Descending Triangle Pattern
- High Frequency Trading: Speed, Algorithms, and Market Impact
- What Is Volume Profile and How to Use It in Trading
- What Is a Morning Star Pattern Candlestick?
- Trade with Parabolic SAR: A Practical Analysis Guide
- Evening Star Pattern: Structure, Rules, and Risk Controls
- Kelly Criterion: Formula, Position Sizing, and Risk
- What Is the NYSE Minimum Trading Price? Rules Explained
Disclaimer: The content on this page is intended for educational and informational purposes only. It does not constitute financial, investment, tax, or legal advice, and should not be interpreted as a recommendation to buy, sell, or hold any financial instrument or asset. Trading and investing involve significant risk, including the possible loss of your entire capital. Products such as forex, CFDs, and cryptocurrencies carry additional risks due to leverage, high volatility, and limited regulatory protection in some jurisdictions. Past performance of any financial instrument does not guarantee future results. Any market views, forecasts, or opinions expressed are those of the author at the time of writing and may not reflect current market conditions. Platform features, fees, and regulatory status are subject to change — always verify information directly with the relevant provider or regulator before making any financial decision. BrokerSpecs may receive compensation from third parties featured on this site. Always conduct your own due diligence and consider seeking advice from a licensed financial professional before investing. Portions of this article were prepared with the assistance of AI tools and reviewed by our editorial team before publication.