


Related Tags
Imagine entering a day trade right as price breaks out to new morning highs, only to watch the market reverse sharply and drag your position into the red. You check traditional indicators, but they fail to capture what actually moved the market: institutional order flow. While retail traders often watch price action in isolation, institutional market participants measure their fills against volume.
This is where the VWAP indicator comes in. By combining price and volume into a single reference line, VWAP gives intraday traders a clear view of true fair value and market trend.
What Is the VWAP Indicator?
The Volume Weighted Average Price (VWAP) is an intraday technical indicator that calculates the average price an asset has traded at throughout the trading session, weighted by total trading volume.
Unlike standard moving averages that treat every price bar equally, VWAP gives greater statistical weight to price points with higher trading volume. This volume-weighting mechanism makes VWAP a preferred benchmark for assessing intraday liquidity, fair market value, and overall directional momentum.
How VWAP Is Calculated: Formula and Worked Example
VWAP indicator is calculated by multiplying the typical price of a security by its volume for a specific period, summing those values cumulatively across the day, and dividing by cumulative volume.
The formula for VWAP is:
VWAP = ∑(Typical Price x Volume) / ∑Volume
Where Typical Price is defined as:
Typical Price = (High + Low + Close) / 3
To understand how volume weights the price, consider three 5-minute bars during a trading morning:
- Period 1: High $102, Low $100, Close $101. Typical Price = $101. Volume = 1,000 shares.
Volume x Price = 101 x 1,000 = 101,000
- Period 2: High $105, Low $103, Close $104. Typical Price = $104. Volume = 5,000 shares (institutional heavy buying).
Volume x Price = 104 x 5,000 = 520,000
- Period 3: High $103, Low $101, Close $102. Typical Price = $102. Volume = 1,000 shares.
Volume x Price = 102 x 1,000 = 102,000
Calculating cumulative values:
- Cumulative Volume x Price: 101,000 + 520,000 + 102,000 = 723,000
- Cumulative Volume: 1,000 + 5,000 + 1,000 = 7,000 shares
VWAP = 723,000 / 7,000 = $103.29
Notice how the cumulative average stays closer to $104 due to the high volume in Period 2, whereas a simple arithmetic average of typical prices ($101, $104, $102) would yield $102.33.
Standard Settings and Deviation Bands for VWAP
For intraday traders, the default setting for the VWAP indicator is the daily session reset. Every morning when the session opens, the cumulative price and volume calculations reset to zero.
Many trading platforms also offer standard deviation bands plotted above and below the main VWAP line.
- +1 / +2 Standard Deviations: Represent potential intraday overbought conditions where buyers may become exhausted.
- -1 / -2 Standard Deviations: Represent potential oversold conditions where mean-reverting buyers often step in.
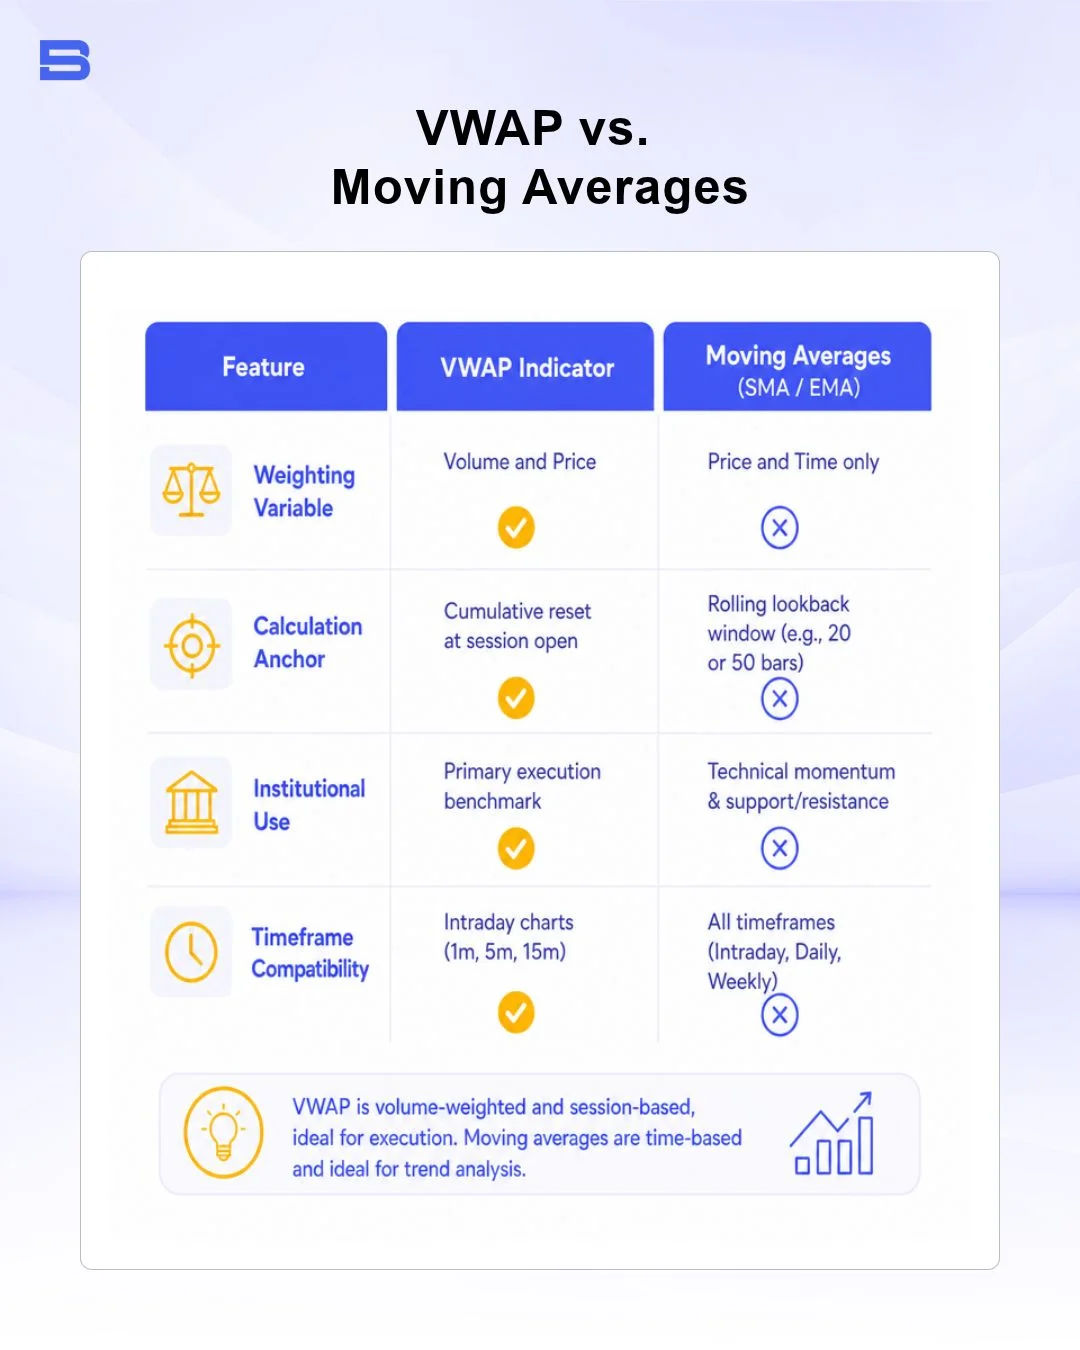
VWAP vs. Moving Averages: Key Differences
While both VWAP indicator and moving averages display trend lines on a chart, their underlying mechanics and trading applications differ substantially. A traditional moving average tracks price changes across time periods, whereas VWAP tracks price relative to market volume.
Why Institutional Traders Use VWAP
Institutional funds, asset managers, and algorithmic execution desks rarely buy or sell massive orders in a single transaction. Executing an order of 500,000 shares on the open market would cause significant market impact, driving prices higher when buying or lower when selling.
To minimize market impact, institutional brokers use VWAP execution algorithms. The institutional goal is to execute large buy orders below the prevailing VWAP line or sell orders above it. Industry best-execution conventions, which asset managers often benchmark against standards discussed by organizations like the CFA Institute, generally treat filling an order below the session's VWAP as a favorable, cost-efficient execution.
Broker-dealers' execution practices more broadly fall under oversight by regulators such as the US Securities and Exchange Commission (SEC), though VWAP benchmarking itself is an industry convention rather than a specific SEC rule.
As institutional traders accumulate positions during an accumulation phase, their massive volume creates strong support or resistance at the VWAP level.
Core VWAP Trading Strategies
Retail traders can leverage VWAP by trading alongside institutional order flow rather than fighting it. Here are core intraday setups built around the VWAP indicator.
Determining Intraday Trend: Bullish vs. Bearish VWAP Signals
The relationship between current price and the VWAP indicator provides immediate market bias:
- Bullish Bias: Price trades above the VWAP line, and the VWAP slope points upward. Institutional buyers are paying above-average prices, confirming aggressive buying demand.
- Bearish Bias: Price trades below the VWAP line, and the VWAP slope points downward. Sellers hold structural control, driving prices below the average volume node.
Traders often combine this bias with intraday pivot points trading to identify logical confluence zones for trade location.
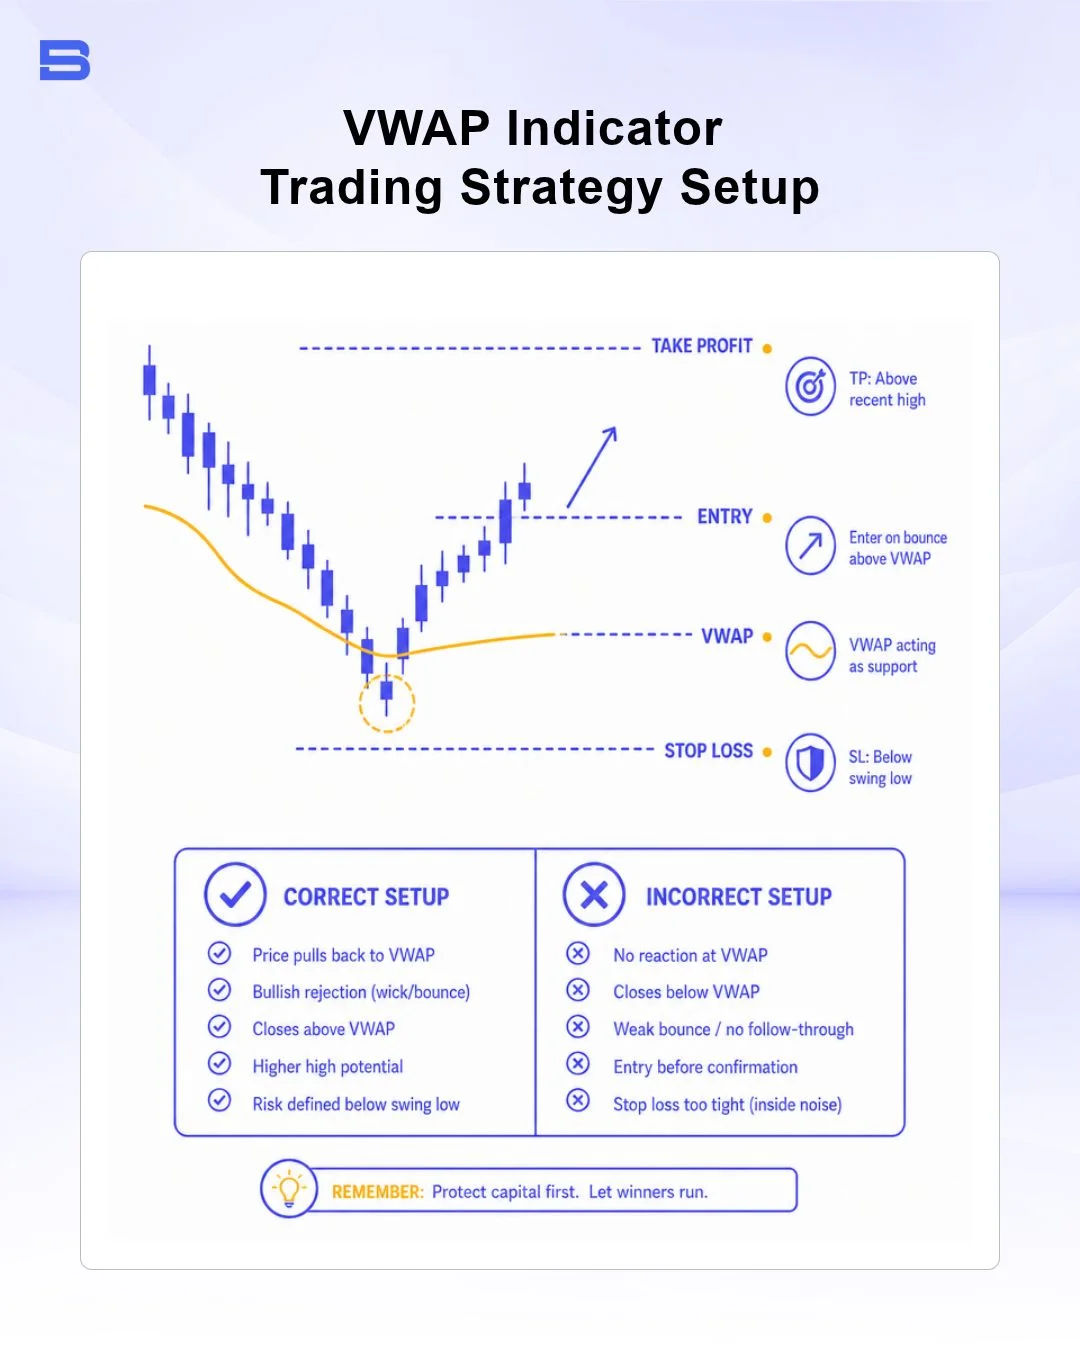
The VWAP Pullback Setup
The VWAP pullback strategy seeks high-probability entries when a strong trending asset temporarily retraces back toward its average value line.
- Setup: Identify an asset making higher highs above an ascending VWAP line during morning trade.
- Trigger: Wait for price to pull back and touch or slightly pierce the VWAP line on decreasing volume.
- Entry: Enter long when a bullish reversal candle (such as a hammer or engulfing pattern) forms at the VWAP line.
- Risk Management: Place a stop-loss just below the swing low or the -1 standard deviation band. Set initial profit targets near the session high or the +2 standard deviation band.
Leverage amplifies your returns when you are right, but it accelerates capital destruction just as quickly when the market moves against you. For instance, holding a 30:1 leveraged position on a volatile index during a sharp VWAP breakdown can result in severe margin depletion if stop-loss boundaries are ignored.
Anchored VWAP vs. Standard Session VWAP
While standard VWAP resets at the start of every daily trading session, Anchored VWAP allows you to manually select the calculation starting point. Introduced by technical analyst Brian Shannon, Anchored VWAP enables traders to calculate volume-weighted average price from key market events:
- Major economic announcements (e.g., FOMC rate decisions or CPI reports)
- Corporate earnings releases
- Significant market swing highs or swing lows
Anchored VWAP reveals whether buyers or sellers who entered during that specific event remain in profit or are under pressure.
Setting Up the VWAP Indicator on MetaTrader 5 (MT5)
While MetaTrader 5 (MT5) includes many technical tools out of the box, standard MT5 installations often require custom indicator additions for session VWAPs.
- Download / Locate Indicator: Access a daily session VWAP custom indicator file (.mq5 or .ex5) from the MQL5 Market or a trusted platform repository.
- Open Data Folder: In MT5, click File > Open Data Folder.
- Navigate to Indicators: Open the MQL5 folder, then open Indicators. Paste the downloaded indicator file here.
- Refresh Platform: In MT5, right-click Indicators in the Navigator pane and select Refresh.
- Apply to Chart: Drag the VWAP indicator onto your intraday timeframe (e.g., 5-minute chart). Set your preferences for standard deviation bands and line colors under the Inputs tab.
To refine timing on setups across technical styles, traders often combine VWAP with momentum strategies like an Ichimoku cloud strategy.
Risks, Limitations, and Slippage Around VWAP
Despite its widespread institutional use, relying solely on VWAP carries distinct trading risks:
- Early-Session Volatility: During the first 15 to 30 minutes of the trading day, low cumulative volume can cause the VWAP line to jump erratically, creating false signals.
- Lagging Effect in Late Session: As cumulative volume builds toward the close, late-day price spikes have less mathematical weight on the overall calculation, causing VWAP to lag significantly behind rapid price moves.
- Execution Slippage: Attempting to trade VWAP breakouts or breakdowns during high-impact news releases can lead to severe slippage, as market liquidity thins and bid-ask spreads widen dramatically.
The Bottom Line
The VWAP indicator provides a reliable window into intraday institutional activity by unifying price and volume into a dynamic reference line. Whether used to gauge intraday trend bias, identify pullback entries, or benchmark algorithmic order execution, VWAP gives traders a grounded perspective on market value.
By combining VWAP with strict risk management, proper stop-loss placement, and secondary technical confirmation, you can navigate volatile intraday price action with greater precision.
- How to Build an Investment Plan That Actually Works for You?
- What Is the MACD Indicator and How to Use It
- What Is a Wedge Pattern in Trading?
- What Is Ichimoku Cloud Strategy? A Complete Trading System
- Mastering Elliott Wave Theory: Rules and Trading Strategies
- News Trading: Strategies, Execution Risks, and Risk Control
- What Is an Iron Condor Options Strategy?
- Backtesting Explained: What It Is and Why It Really Matters
- Grid Trading: Mechanics, Parameters, and Risk Strategies
- What Is Breakout Trading and How Does It Work?
- Mean Reversion: Technical Strategies and Risk Frameworks
- Momentum Trading: Indicators, Strategies, and Risk Control
- Hammer Candlestick: Structure, Meaning, and Strategy
- Doji Candlestick: Types, Signals, and Trading Strategies
- What Is the Sharpe Ratio and How to Calculate It
- What Is VWAP and How Do Traders Use It?
- Trade the Ascending Triangle: A Step-by-Step Practical Guide
- What Is the Stochastic Oscillator and How to Use It
- How to Trade the Descending Triangle Pattern
- High Frequency Trading: Speed, Algorithms, and Market Impact
- What Is Volume Profile and How to Use It in Trading
- What Is a Morning Star Pattern Candlestick?
- Trade with Parabolic SAR: A Practical Analysis Guide
- Evening Star Pattern: Structure, Rules, and Risk Controls
- Kelly Criterion: Formula, Position Sizing, and Risk
- What Is the NYSE Minimum Trading Price? Rules Explained
Disclaimer: The content on this page is intended for educational and informational purposes only. It does not constitute financial, investment, tax, or legal advice, and should not be interpreted as a recommendation to buy, sell, or hold any financial instrument or asset. Trading and investing involve significant risk, including the possible loss of your entire capital. Products such as forex, CFDs, and cryptocurrencies carry additional risks due to leverage, high volatility, and limited regulatory protection in some jurisdictions. Past performance of any financial instrument does not guarantee future results. Any market views, forecasts, or opinions expressed are those of the author at the time of writing and may not reflect current market conditions. Platform features, fees, and regulatory status are subject to change — always verify information directly with the relevant provider or regulator before making any financial decision. BrokerSpecs may receive compensation from third parties featured on this site. Always conduct your own due diligence and consider seeking advice from a licensed financial professional before investing. Portions of this article were prepared with the assistance of AI tools and reviewed by our editorial team before publication.