



Related Tags
You are watching a cryptocurrency chart consolidate near key resistance, unsure whether institutional capital is accumulating or quietly preparing to dump. Traditional market screens leave you guessing about who holds what behind private brokerage walls. This is where on-chain analysis helps: it moves decisions on how to trade Bitcoin from chart guesswork to direct inspection of the public ledger.
What Is On Chain Analysis and How Does It Work?
On chain analysis is the practice of examining public blockchain transaction data and wallet balances to evaluate cryptocurrency market sentiment, network activity, and capital flows.
Because public distributed ledgers record every transaction immutably, every transfer between wallets is visible to anyone inspecting the network. Traditional finance conceals institutional volume within private clearinghouses and dark pools. Public blockchains instead broadcast the timestamp, transfer volume, fee paid, and sender and receiver addresses to the entire globe in real time.
Data providers parse this raw block telemetry into digestible indicators. Advanced heuristics group fragmented addresses into identifiable entities, separating centralized exchanges from private custodians.
Analyzing these granular movements helps you verify whether underlying network adoption supports current speculative price action, or if a rally runs on hollow liquidity.
Key On-Chain Metrics Every Trader Should Understand
Evaluating raw blockchain data requires structured frameworks rather than checking random transaction hashes. The primary metrics separate into valuation models, network activity indicators, and liquidity shifts across known entities.
Market Value to Realized Value (MVRV) Ratio
The MVRV ratio measures the relationship between a network’s current market capitalization and its realized capitalization. Realized capitalization values each unit of cryptocurrency at the exact price it last moved on-chain, rather than its current market quote.
When the MVRV ratio rises above 3.0, the market holds large unrealized gains, historically elevating the probability of widespread profit-taking. Conversely, readings under 1.0 indicate aggregate holders sit underwater, which often marks macro accumulation phases.
Network Value to Transactions (NVT) Ratio
The NVT ratio compares market capitalization to daily transaction volume transmitted over the base blockchain network. Investors often describe this metric as crypto’s equivalent to the price-to-earnings (P/E) ratio.
A high NVT ratio indicates high market capitalization unsupported by transactional utility on the network, which may point to speculative froth. A low NVT ratio implies heavy economic usage relative to current network value, signaling organic throughput.
Exchange Netflows and Whale Wallet Tracking
Exchange netflow measures the net difference between coins deposited into centralized exchange wallets and coins withdrawn to private custody.
Heavy positive netflows indicate holders are transferring tokens to exchanges, expanding immediately available sell liquidity. Large negative netflows show aggressive withdrawals into cold storage, removing liquid supply from circulation.
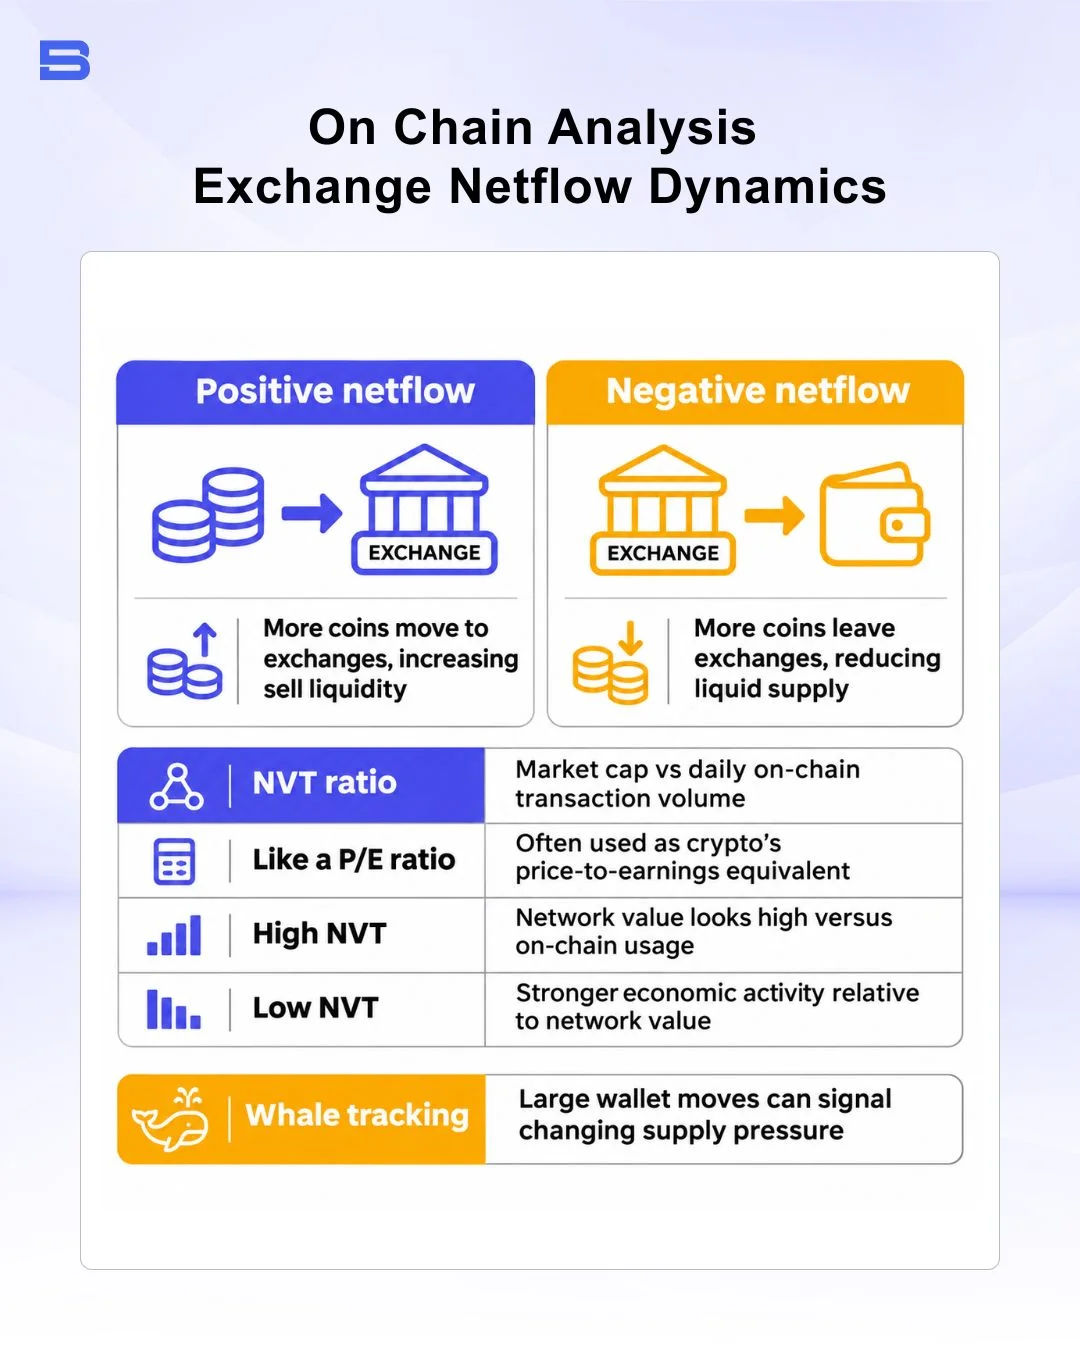
Tracking these movements requires caution, as automated internal wallet reorganizations by exchanges can mimic large whale accumulations.
Evaluating Market Sentiment Through Miner and Holder Supply
Categorizing blockchain addresses by coin dormancy separates short-term speculative churn from high-conviction custody.
Tracking these supply divisions provides clear insight into prevailing market sentiment. Long-term holders (LTH), typically categorized as addresses holding assets untouched for more than 155 days, show lower sensitivity to short-term intraday volatility. When LTH supply trends steadily upward during corrections, it may suggest that long-term investors are absorbing panic selling.
Proof-of-work blockchain health also reflects miner balance telemetry. Miners carry ongoing operational liabilities denominated in fiat currencies.
When falling prices force miners to sell their reserves to cover costs, miner capitulation metrics (measures of heavy miner selling) may warn that extra spot supply is about to hit exchange order books.
On Chain Analysis vs. Technical Analysis: Key Differences
Technical analysis reads price and volume off centralized order books, while on-chain metrics diagnose underlying ledger settlement. Combining them balances immediate execution timing against macro fundamental flows.
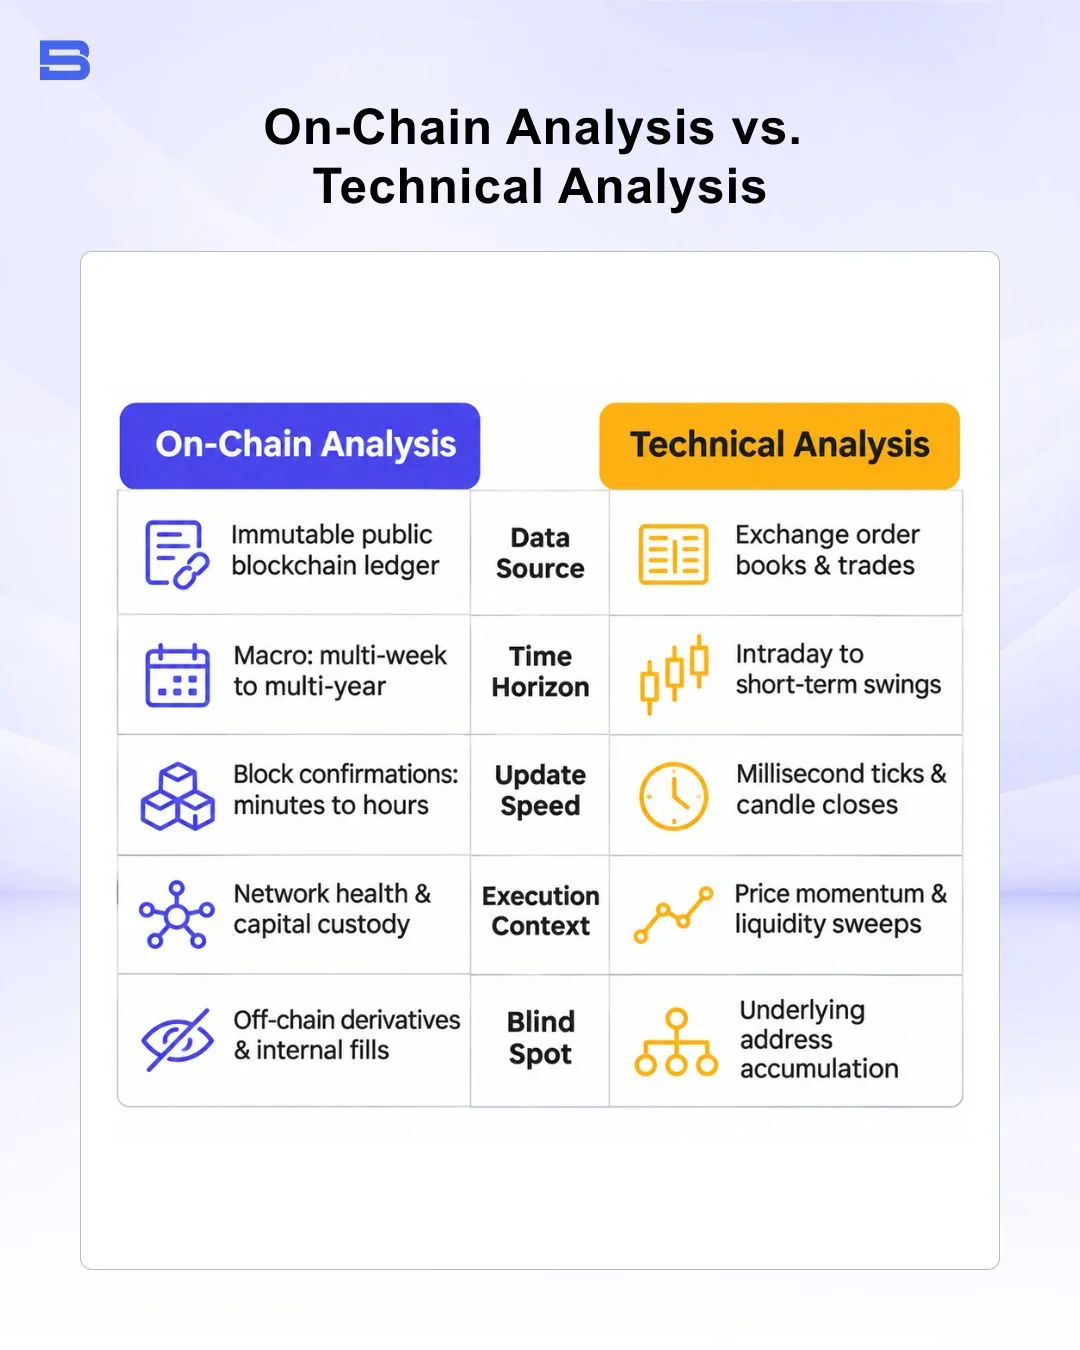
Traders relying exclusively on chart patterns miss shifts in wallet concentration. Conversely, executing immediate day entries with on-chain telemetry fails because blockchain data lacks the microsecond granularity required for order flow trading.
Practical Execution: Combining On-Chain Signals with Risk Management
Applying on-chain signals requires rigid execution boundaries, because blockchain trends unfold across weeks rather than immediate hours. Combining ledger telemetry with institutional discipline, such as principles outlined by the CFA Institute, keeps speculative positions within strict risk allocations.
Consider a practical scenario where you analyze Bitcoin consolidating at $85,000. Your technical charts show an overbought daily Relative Strength Index (RSI), while the on-chain MVRV ratio sits at an elevated 2.8. However, exchange netflow data reveals three consecutive days of sustained net outflows, totaling 25,000 BTC moving into institutional cold storage.
- Scenario: Bullish custody outflow vs. elevated MVRV valuation
- Total Capital: $10,000
- Max Account Risk (2%): $200
- Entry Price: $85,000
- Invalidation / Technical Stop-Loss: $81,600 (4% downside stop)
- Calculated Position Size: $5,000 (0.0588 BTC)
- Take-Profit Target (1:2 R:R): $91,800
Because the elevated MVRV suggests that profit-taking risk may be climbing, the position is kept at $5,000 with no leverage, so the planned maximum loss stays at the $200 set by the stop-loss. Leverage can magnify both gains and losses, and a fast sell-off can push the exit below the stop-loss, so traders who add leverage may face larger losses than planned.
Some systematic traders also watch exchange netflows when planning crypto arbitrage or statistical arbitrage across markets, although price gaps between venues often close too quickly for on-chain data alone to time an entry. Build every entry around a structured trading plan to prevent macro ledger biases from overriding technical stop invalidations.
Structural Pitfalls and Limitations of On Chain Analysis
Blockchain data provides transparent accounting, but it does not guarantee directional certainty. Misinterpreting transactional noise often leads to costly execution mistakes.
As research from the Bank for International Settlements (BIS) notes regarding digital asset tracking, off-chain volume on centralized exchanges represents the vast majority of daily crypto price discovery as of the publication date of this article. Speculative derivatives, high-frequency internal cross-matching, and institutional dark matching execute entirely off-chain without generating a single transaction hash on mainnet ledgers.
Internal exchange wallet restructuring presents another hurdle. A major exchange consolidating fragmented customer balances into a new cold storage vault can register as an unusually large transaction spike, misleading automated scrapers into signaling a major market event. Furthermore, the growth of Layer-2 rollups bundles thousands of transactions into solitary mainnet settlement proofs, masking individual retail capital flows.
Treat on-chain metrics as probabilistic diagnostic telemetry rather than an infallible forecasting system.
The Bottom Line
On-chain analysis provides a transparent view of capital movement, transforming public distributed ledgers into practical market diagnostics. Monitoring metrics like MVRV ratios and exchange netflows clarifies whether liquidity is entering or exiting the ecosystem. Integrate these signals alongside technical execution parameters, maintain sensible position sizing, and never let high-level macro data replace disciplined capital protection.
- How to Build an Investment Plan That Actually Works for You?
- What Is the MACD Indicator and How to Use It
- What Is a Wedge Pattern in Trading?
- What Is Ichimoku Cloud Strategy? A Complete Trading System
- Mastering Elliott Wave Theory: Rules and Trading Strategies
- News Trading: Strategies, Execution Risks, and Risk Control
- What Is an Iron Condor Options Strategy?
- Backtesting Explained: What It Is and Why It Really Matters
- Grid Trading: Mechanics, Parameters, and Risk Strategies
- What Is Breakout Trading and How Does It Work?
- Mean Reversion: Technical Strategies and Risk Frameworks
- Momentum Trading: Indicators, Strategies, and Risk Control
- Hammer Candlestick: Structure, Meaning, and Strategy
- Doji Candlestick: Types, Signals, and Trading Strategies
- What Is the Sharpe Ratio and How to Calculate It
- What Is VWAP and How Do Traders Use It?
- Trade the Ascending Triangle: A Step-by-Step Practical Guide
- What Is the Stochastic Oscillator and How to Use It
- How to Trade the Descending Triangle Pattern
- High Frequency Trading: Speed, Algorithms, and Market Impact
- What Is Volume Profile and How to Use It in Trading
- What Is a Morning Star Pattern Candlestick?
- Trade with Parabolic SAR: A Practical Analysis Guide
- Evening Star Pattern: Structure, Rules, and Risk Controls
- Kelly Criterion: Formula, Position Sizing, and Risk
- What Is the NYSE Minimum Trading Price? Rules Explained
Disclaimer: The content on this page is intended for educational and informational purposes only. It does not constitute financial, investment, tax, or legal advice, and should not be interpreted as a recommendation to buy, sell, or hold any financial instrument or asset. Trading and investing involve significant risk, including the possible loss of your entire capital. Products such as forex, CFDs, and cryptocurrencies carry additional risks due to leverage, high volatility, and limited regulatory protection in some jurisdictions. Past performance of any financial instrument does not guarantee future results. Any market views, forecasts, or opinions expressed are those of the author at the time of writing and may not reflect current market conditions. Platform features, fees, and regulatory status are subject to change — always verify information directly with the relevant provider or regulator before making any financial decision. BrokerSpecs may receive compensation from third parties featured on this site. Always conduct your own due diligence and consider seeking advice from a licensed financial professional before investing. Portions of this article were prepared with the assistance of AI tools and reviewed by our editorial team before publication.