



Related Tags
You are staring at a stock chart that should be climbing based on stellar profit reports, yet prices keep dropping fast. Panic sets in as orders execute, leaving you wondering why solid numbers failed to deliver gains.
In financial markets, technical patterns and corporate financials do not drive price movements alone — the aggregate human emotion behind every transaction dictates direction. Understanding how crowd psychology moves quotes allows you to read broader market direction rather than fighting invisible momentum.
What Is Market Sentiment and How Does It Affect Trading?
Market sentiment is the overall consensus, attitude, or emotional tone held by traders and investors toward a specific asset or financial market. At its core, market sentiment reflects crowd psychology—the collective blend of optimism (bullish sentiment) and pessimism (bearish sentiment) across participants.
When optimism dominates, buying demand expands, pushing prices upward even if economic fundamentals appear weak. Conversely, when fear takes hold, selling pressure accelerates, driving prices lower regardless of underlying asset strength.
This dynamic creates distinct market cycles. During extreme bullish phases, excess enthusiasm can create asset price bubbles. During extreme bearish phases, widespread panic often leads to sharp undervaluation.
Prices rarely reflect asset value in a pure vacuum. They move dynamically based on how human expectations interpret new information. For a deeper look into automated market participation and leader strategies, explore copy trading.
Key Market Sentiment Indicators
Gauging sentiment requires measuring quantitative metrics and tracking qualitative tools. Because emotional states drive execution volume, traders rely on distinct indicators to track institutional and retail biases.
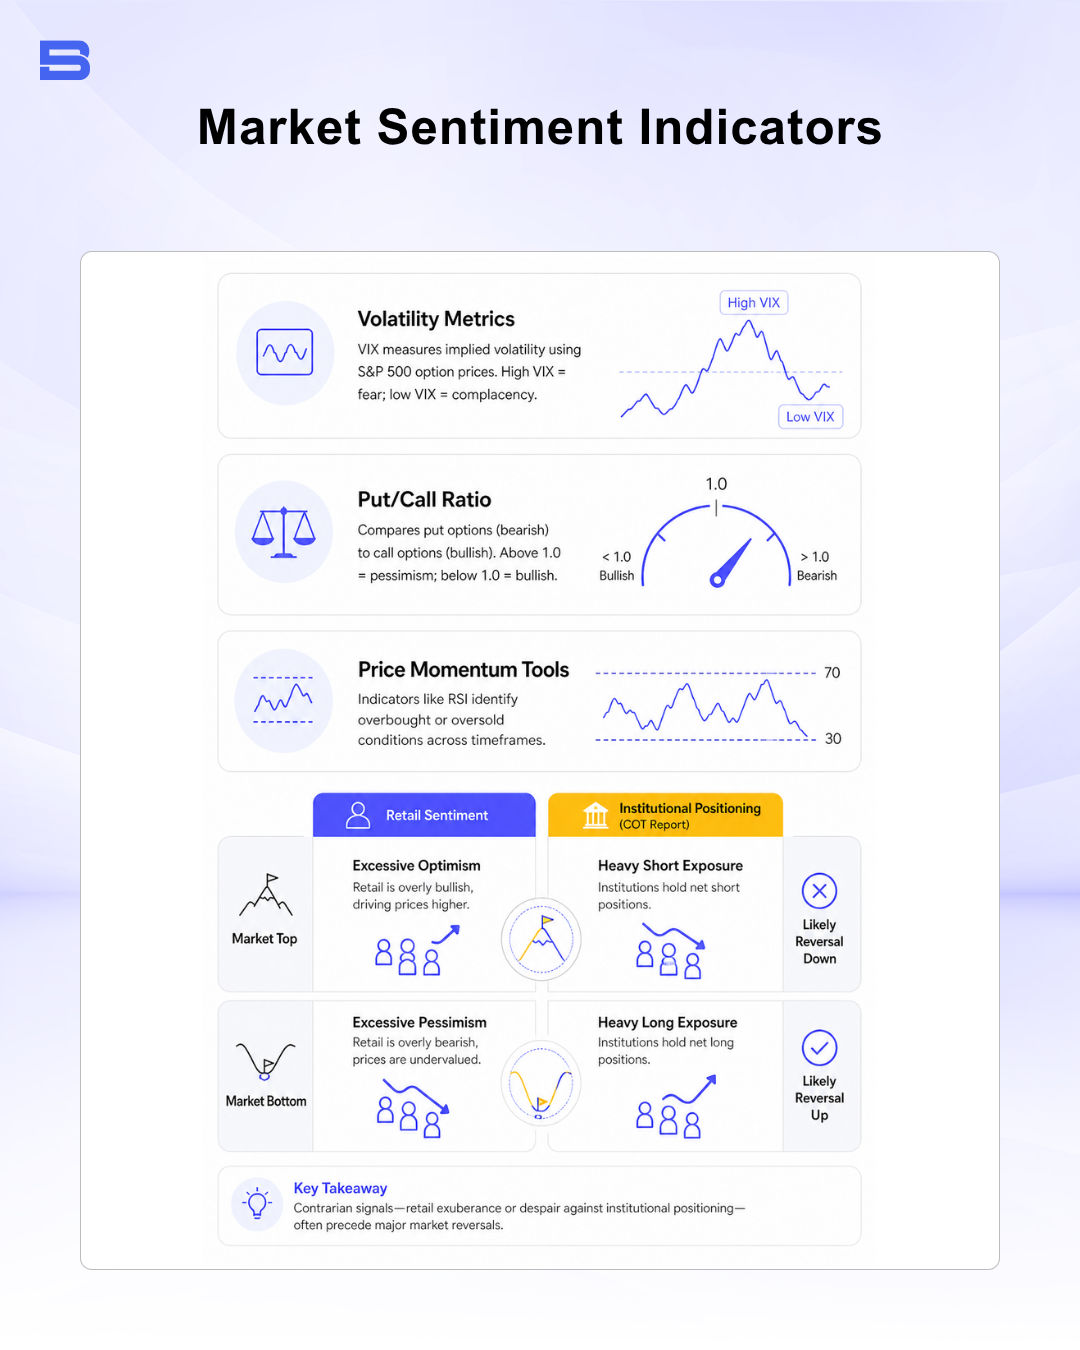
- Volatility Metrics: The CBOE Volatility Index (VIX) measures implied volatility using S&P 500 option prices. High VIX levels reflect heightened trader fear, while low readings indicate market complacency.
- Put/Call Ratio: Comparing traded put options (bearish bets) against call options (bullish bets) shows market positioning. A ratio above 1.0 indicates prevailing pessimism, whereas a low ratio highlights bullish bias.
- Price Momentum Tools: Indicators like the Relative Strength Index (RSI) identify overbought or oversold conditions across various timeframes.
Popular Retail and Institutional Sentiment Tools
Retail traders frequently check aggregate tools like the Fear and Greed Index, which combines momentum, volatility, put/call ratios, and safe-haven demand into a 0-to-100 score.
Institutional positioning requires deeper data, such as the U.S. Commodity Futures Trading Commission's (CFTC) Commitment of Traders (COT) report. The COT report reveals weekly net long and short positions across three participant classes:
- Commercial Traders: Hedgers using markets to offset physical business exposure.
- Non-Commercial Traders: Large institutional speculators, such as hedge funds.
- Small Traders: Individual retail traders whose collective sentiment often reaches bullish extremes at market tops and bearish extremes at market bottoms.
Understanding institutional flow is essential when evaluating broader asset liquidity. The Bank for International Settlements (BIS) provides extensive research on global capital flows and financial stability.
Is Market Sentiment a Leading or Lagging Indicator?
Market sentiment functions as both a coincidental and leading indicator, depending on how it is applied:
- Contrarian Signal (Leading): When sentiment reaches historical extremes — such as 90% bullish retail surveys — it becomes a leading indicator for potential trend reversals, as few buyers remain to push prices higher.
- Trend Confirmation (Lagging): During early and middle trend phases, sentiment follows price momentum, lagging initial shifts.
Relying exclusively on sentiment indicators during strong momentum trends carries risk. Extreme sentiment readings can remain elevated for extended periods while prices continue climbing or falling.
Combining Market Sentiment with Technical Analysis
Sentiment metrics work best when paired with technical analysis on price charts. Extreme sentiment points to potential turning zones, but price action confirms when a trend shift is underway.
When sentiment reaches an extreme near major support and resistance levels, the probability of a market reversal increases. Confirming setups with a moving average helps ensure you trade with confirmed price momentum rather than anticipating a top or bottom too early.
Worked Example: Shorting an Oversaturated Trend
Consider an asset approaching long-term resistance:
- Sentiment Trigger: Retail sentiment surveys reach 88% bullish enthusiasm while the put/call ratio drops to an extreme low of 0.45.
- Technical Level: Price tests strong multi-month resistance at $150.00.
- Confirmation Signal: Instead of shorting immediately based on sentiment alone, you wait for price action confirmation. Price breaks below its 50-day moving average at $147.50 on high volume.
- Trade Execution: You enter a short position at $147.00, placing a stop-loss above resistance at $151.50.
Waiting for price confirmation helps protect your capital against sentiment readings remaining at extremes during strong trends.
How Different Trading Styles Use Sentiment Data
Traders apply sentiment analysis across different timeframes:
- Day Traders: Track intraday volume spikes, Level 2 order flow, and immediate news reactions to trade short-term price adjustments.
- Swing Traders: Use daily put/call ratios, VIX moves, and overbought/oversold technical indicators over multi-day horizons.
- Position Traders: Long-term market participants rely on COT report shifts and macroeconomic sentiment over multi-month windows. Review position trading strategies for more context on extended execution models.
Market Sentiment vs. Copy Trading Strategies
Copy trading allows individuals to replicate trades executed by experienced strategy leaders. However, copying trades during extreme crowd sentiment can lead to unexpected losses if the leader fails to adjust for market shifts. Assessing sentiment gives copy traders a clearer perspective on whether a strategy leader is trading with market momentum or managing extreme counter-trend risks appropriately.
Risk Management When Trading Sentiment Extremes
Trading against crowd sentiment carries significant risk. Markets can remain irrational longer than account margins can withstand drawdown.
Risk management rules when trading sentiment extremes:
- Never Trade Sentiment Alone: Always wait for price action confirmation before executing a setup.
- Control Position Size: Limit total exposure on contrarian setups to a small percentage of total account equity.
- Enforce Hard Stop-Losses: Always place structural stop-loss orders to limit losses if runaway trends continue.
Leverage amplifies your returns when you are right, but it accelerates capital destruction just as quickly when the market moves against you — a 2.5% move against a 30:1 leveraged position can wipe out a large share of your margin.
Navigating Market Sentiment
Market sentiment provides a valuable window into crowd psychology, helping you spot market complacency and panic. However, sentiment metrics are most effective when used alongside technical analysis and sound risk management. By combining sentiment metrics with price confirmation, you can navigate market shifts with greater clarity.
- How to Build an Investment Plan That Actually Works for You?
- What Is the MACD Indicator and How to Use It
- What Is a Wedge Pattern in Trading?
- What Is Ichimoku Cloud Strategy? A Complete Trading System
- Mastering Elliott Wave Theory: Rules and Trading Strategies
- News Trading: Strategies, Execution Risks, and Risk Control
- What Is an Iron Condor Options Strategy?
- Backtesting Explained: What It Is and Why It Really Matters
- Grid Trading: Mechanics, Parameters, and Risk Strategies
- What Is Breakout Trading and How Does It Work?
- Mean Reversion: Technical Strategies and Risk Frameworks
- Momentum Trading: Indicators, Strategies, and Risk Control
- Hammer Candlestick: Structure, Meaning, and Strategy
- Doji Candlestick: Types, Signals, and Trading Strategies
- What Is the Sharpe Ratio and How to Calculate It
- What Is VWAP and How Do Traders Use It?
- Trade the Ascending Triangle: A Step-by-Step Practical Guide
- What Is the Stochastic Oscillator and How to Use It
- How to Trade the Descending Triangle Pattern
- High Frequency Trading: Speed, Algorithms, and Market Impact
- What Is Volume Profile and How to Use It in Trading
- What Is a Morning Star Pattern Candlestick?
- Trade with Parabolic SAR: A Practical Analysis Guide
- Evening Star Pattern: Structure, Rules, and Risk Controls
- Kelly Criterion: Formula, Position Sizing, and Risk
- What Is the NYSE Minimum Trading Price? Rules Explained
Disclaimer: The content on this page is intended for educational and informational purposes only. It does not constitute financial, investment, tax, or legal advice, and should not be interpreted as a recommendation to buy, sell, or hold any financial instrument or asset. Trading and investing involve significant risk, including the possible loss of your entire capital. Products such as forex, CFDs, and cryptocurrencies carry additional risks due to leverage, high volatility, and limited regulatory protection in some jurisdictions. Past performance of any financial instrument does not guarantee future results. Any market views, forecasts, or opinions expressed are those of the author at the time of writing and may not reflect current market conditions. Platform features, fees, and regulatory status are subject to change — always verify information directly with the relevant provider or regulator before making any financial decision. BrokerSpecs may receive compensation from third parties featured on this site. Always conduct your own due diligence and consider seeking advice from a licensed financial professional before investing. Portions of this article were prepared with the assistance of AI tools and reviewed by our editorial team before publication.