


Related Tags
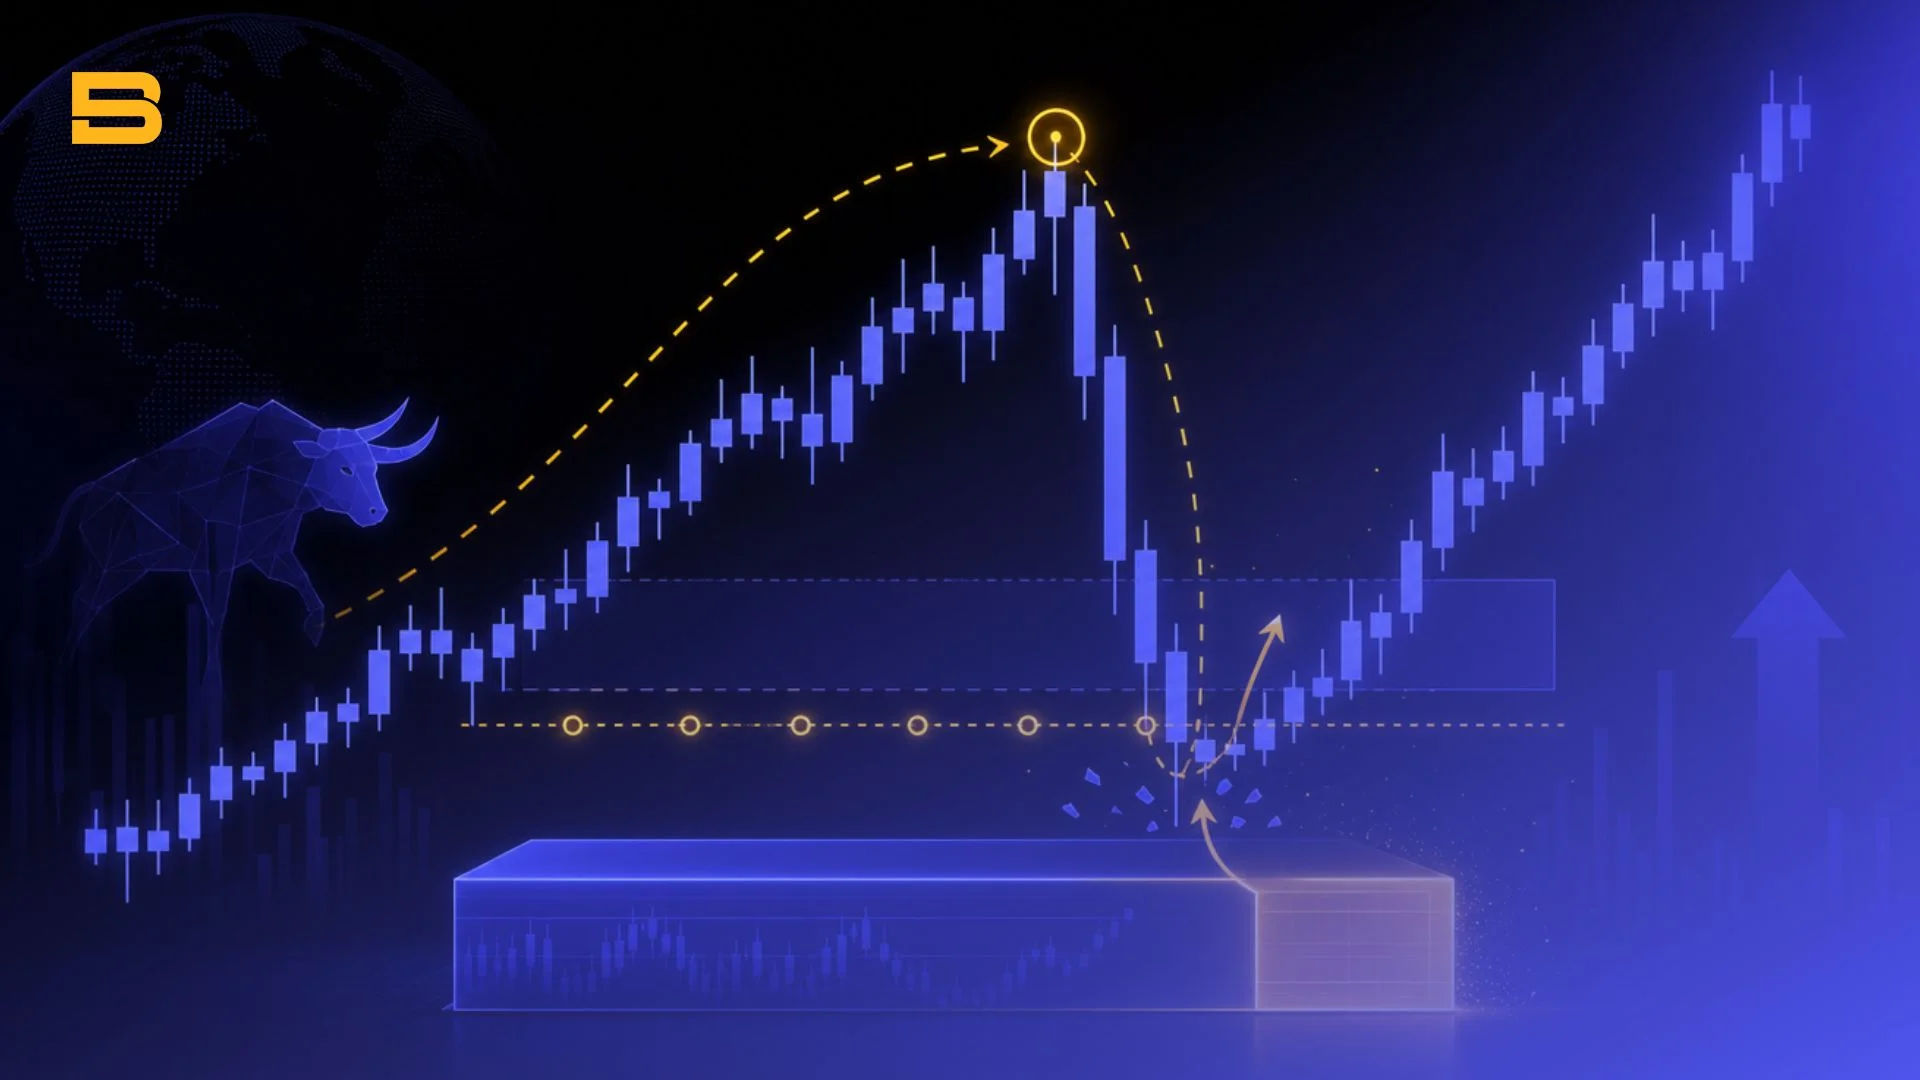
Imagine setting a buy limit order right above a clean support level, only for price to briefly dip below, hit your stop-loss, and immediately soar toward your initial target.
This frustrating scenario is not a coincidence; it is a structural mechanism used by institutional market participants to build liquidity.
Understanding inducement in trading allows you to identify where retail traders are being trapped before major directional moves occur. Rather than becoming the liquidity that fuels institutional orders, learning this Smart Money Concept (SMC) enables you to align your strategy alongside institutional capital flows.
What Is Inducement in Trading? How Smart Money Traps Retail Traders
In financial markets, institutional participants—such as central banks, hedge funds, and market makers—trade with enormous position sizes. Because of these large volumes, they cannot simply enter or exit positions at market price without causing significant price slippage. To fill their massive orders, institutions require an equivalent pool of counterparty liquidity.
Inducement in trading refers to a temporary price movement engineered by institutional traders to tempt or "induce" retail traders into taking early positions. This manipulation creates a concentrated pool of stop-loss orders and breakout entry orders at specific, visible price levels.
Once enough liquidity is stacked, institutions push price past these key levels to absorb those orders, filling their own positions before expanding price in the true intended direction.
What Is Inducement Trading?
Inducement in trading is an analytical framework within Smart Money Concepts (SMC) that focuses on identifying these engineered traps before entering a trade. Instead of reacting to minor chart patterns, traders who utilize inducement tactics wait patiently for institutional sweeps to clear out early retail positions.
By identifying where retail stops are pooled, you transform traditional breakout levels into liquidity target zones. Once the sweep occurs and price mitigates a valid institutional order block, you enter alongside smart money rather than falling victim to the trap.
Inducement vs. Liquidity Grab: Understanding the Structural Difference
While both concepts involve the taking of stop losses, understanding the difference between a minor inducement and a major liquidity grab is essential for accurate market structure mapping.
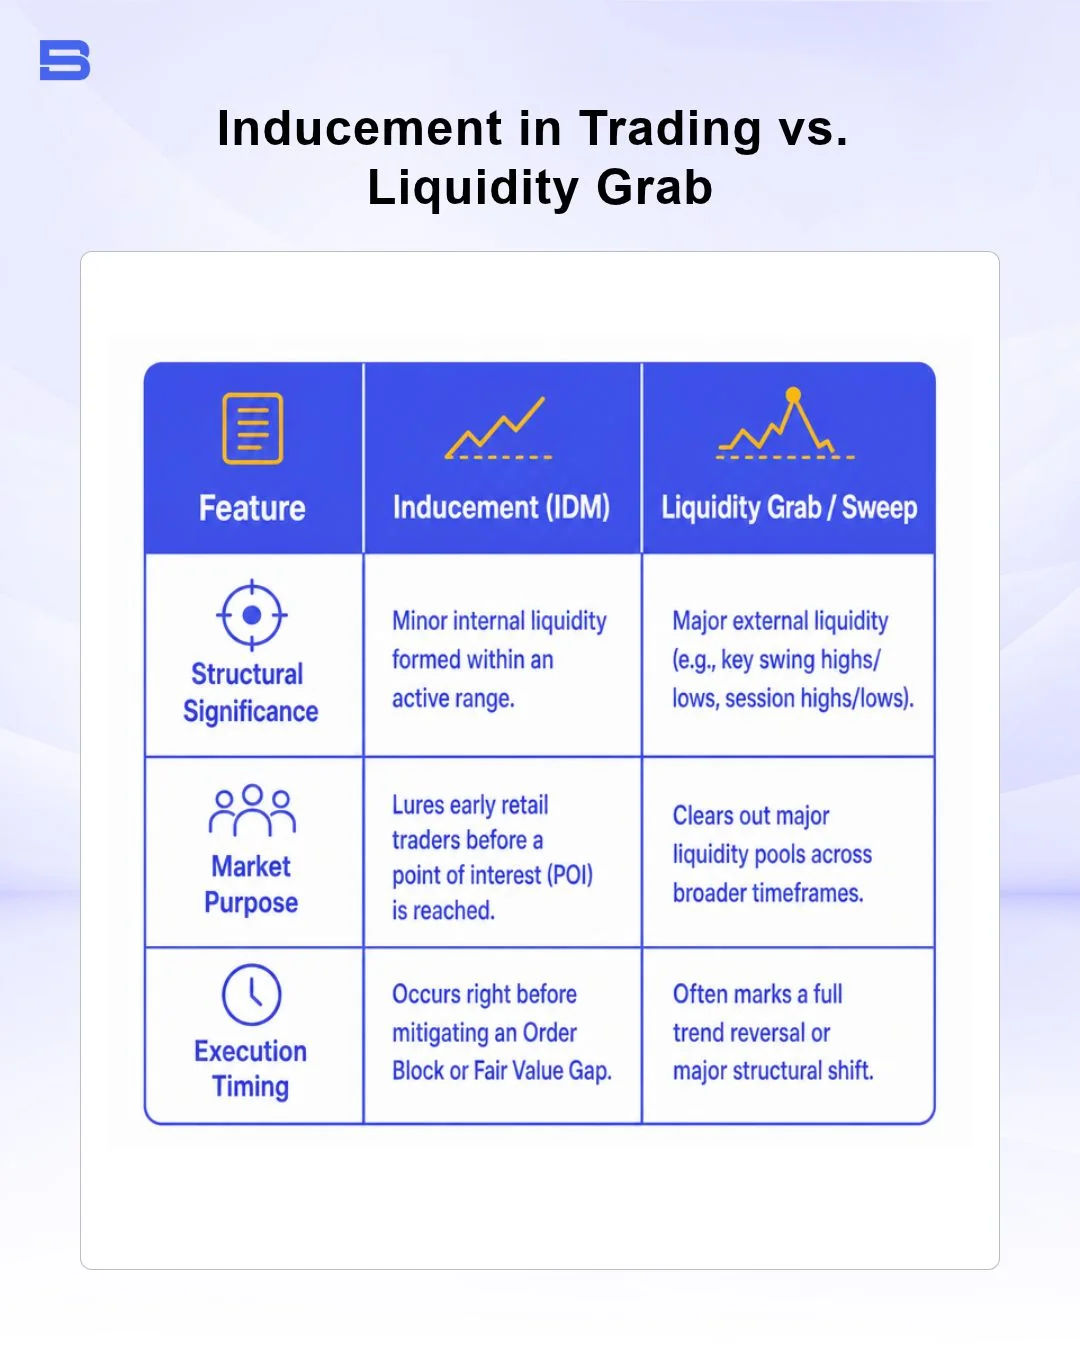
As shown in the comparison above, inducement acts as a preliminary trap, whereas a liquidity grab clears larger structural boundaries.
Common Forms of Inducement in Financial Markets
Institutions engineer inducement in trading using technical patterns that are widely taught in classic retail trading books. Because thousands of retail traders place their stop-loss orders around these recognizable visual cues, they serve as ideal targets for liquidity harvesting.
Common Retail Traps: Equal Highs and Equal Lows (EQH/EQL)
Equal Highs (EQH) and Equal Lows (EQL) represent classical double-top and double-bottom chart patterns. Retail technical analysis teaches traders to sell at resistance (EQH) or buy at support (EQL), placing stop-loss orders directly beyond these levels.
Smart money recognizes that a cluster of buy stop-loss orders rests just above Equal Highs, while sell stop-loss orders pool directly beneath Equal Lows. Institutions intentionally keep these levels clean to accumulate liquidity. When price eventually breaks these levels, it triggers those pending orders, supplying institutions with the exact volume needed to fill their large positions.
Trendline Liquidity and Minor Internal Structure
Retail traders frequently draw trendlines across price peaks and troughs, entering on third or fourth touches and placing stop-losses just beyond the trendline boundary. Institutions use this behavior by allowing price to respect a trendline temporarily, building up trendline liquidity.
Similarly, minor internal highs and lows within a larger leg of price action create internal structural inducement. Retail traders often mistake these internal pullbacks for genuine structural breaks, entering prematurely before the broader institutional move unfolds.
How to Identify Inducement on Price Charts: Step-by-Step Guide
Identifying inducement in trading requires a systematic approach to reading market structure. By combining structural validation with liquidity recognition, you can map out high-probability trade setups.
- Map the Higher Timeframe Structure: Identify the primary trend direction and mark the valid higher-timeframe point of interest, such as an order block trading area or fair value gap.
- Locate the Inducement Level: Look for minor internal swing highs/lows, trendlines, or Equal Highs/Lows resting directly between the current price and your target point of interest.
- Wait for the Liquidity Sweep: Do not enter as price approaches the inducement level. Wait for price to sweep through the liquidity pool, triggering retail stop-loss orders.
- Confirm the Structural Shift: Watch for a lower-timeframe break of structure (BOS) or Market Structure Shift (MSS) immediately following the sweep into the point of interest.
- Enter on Mitigation: Enter at the newly formed lower-timeframe entry zone, placing your stop-loss safely beyond the sweep high or low.
Real-World Inducement Example in Forex Trading
Consider a scenario on the EUR/USD currency pair trading at 1.0850 within an overall bullish trend.
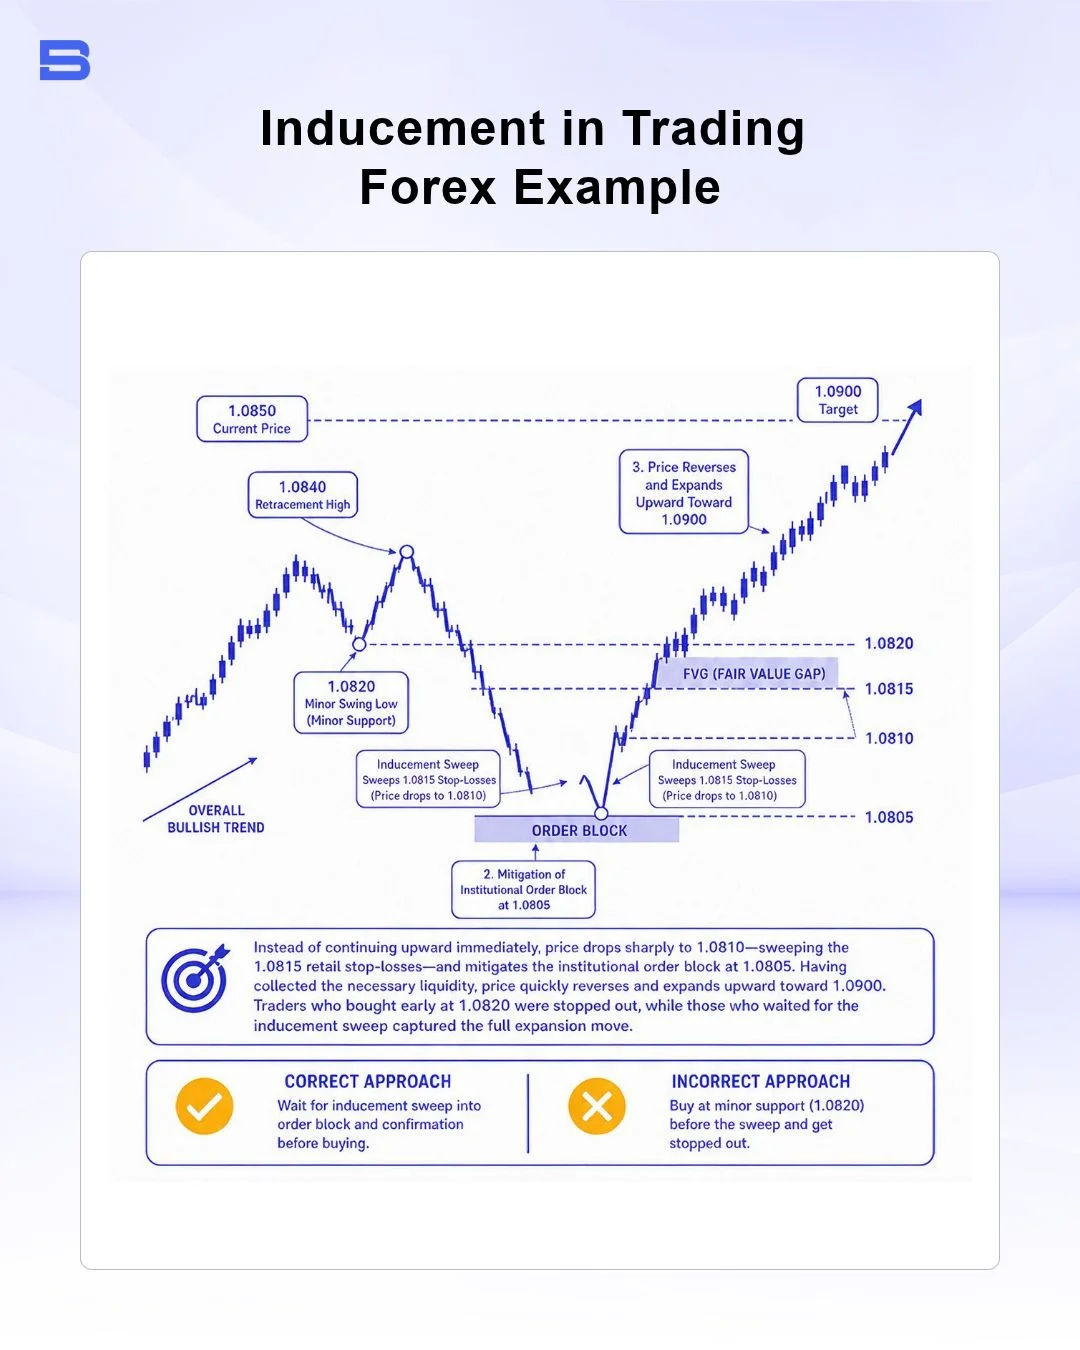
Price forms a minor swing low at 1.0820 before making a small upward retracement toward 1.0840. Retail traders identify 1.0820 as minor support and place buy orders with stop-losses set at 1.0815. Directly beneath this level lies an institutional order block at 1.0805.
Instead of continuing upward immediately, price drops sharply to 1.0810—sweeping the 1.0815 retail stop-losses—and mitigates the institutional order block at 1.0805. Having collected the necessary liquidity, price quickly reverses and expands upward toward 1.0900.
Traders who bought early at 1.0820 were stopped out, while those who waited for the inducement sweep captured the full expansion move.
Strategic Placement Near High-Probability Order Blocks
Inducement in trading acts as a confirmation filter for identifying high-probability institutional entry zones. An order block or fair value gap that does not have clear inducement resting in front of it carries a higher risk of failing, as price may use the order block itself as liquidity.
When evaluating a point of interest, always ask yourself: Where is the liquidity that will fuel this order block? If a clear inducement level exists directly before your zone, the probability of that order block holding increases significantly.
Risk Management: Protecting Your Capital During Liquidity Sweeps
Trading liquidity sweeps carries inherent execution risks that every retail trader must manage carefully. During institutional sweeps, price action can become extremely fast and volatile, leading to spread expansion and slippage.
To protect your capital when trading institutional concepts:
- Avoid Placing Pending Orders Inside Liquidity Pools: Entering prematurely before a sweep exposes your account to unnecessary stop-outs. Always wait for price to react after sweeping liquidity.
- Factor in Broker Spreads: During high-volatility sweeps or session opens, variable spreads can widen significantly. Ensure your stop-loss accounts for potential spread expansion.
- Manage Position Sizing: Liquidity sweeps can extend deeper than anticipated. Risk no more than 1–2% of your total account equity on any single trade setup.
Regulatory bodies such as the Securities Commission Malaysia (SC) and the UK's Financial Conduct Authority (FCA) emphasize that retail investors should understand execution risks, leverage mechanics, and broker terms before trading volatile markets.
Conclusion
This mechanic is a foundational part of market structure that explains why traditional retail support and resistance levels frequently fail. By learning to identify engineered liquidity traps—such as Equal Highs, trendlines, and minor internal swings—you can avoid taking early retail entries. Waiting patiently for liquidity sweeps into valid institutional order blocks helps align your portfolio with institutional order flow while keeping risk strictly controlled.
- How to Build an Investment Plan That Actually Works for You?
- What Is the MACD Indicator and How to Use It
- What Is a Wedge Pattern in Trading?
- What Is Ichimoku Cloud Strategy? A Complete Trading System
- Mastering Elliott Wave Theory: Rules and Trading Strategies
- News Trading: Strategies, Execution Risks, and Risk Control
- What Is an Iron Condor Options Strategy?
- Backtesting Explained: What It Is and Why It Really Matters
- Grid Trading: Mechanics, Parameters, and Risk Strategies
- What Is Breakout Trading and How Does It Work?
- Mean Reversion: Technical Strategies and Risk Frameworks
- Momentum Trading: Indicators, Strategies, and Risk Control
- Hammer Candlestick: Structure, Meaning, and Strategy
- Doji Candlestick: Types, Signals, and Trading Strategies
- What Is the Sharpe Ratio and How to Calculate It
- What Is VWAP and How Do Traders Use It?
- Trade the Ascending Triangle: A Step-by-Step Practical Guide
- What Is the Stochastic Oscillator and How to Use It
- How to Trade the Descending Triangle Pattern
- High Frequency Trading: Speed, Algorithms, and Market Impact
- What Is Volume Profile and How to Use It in Trading
- What Is a Morning Star Pattern Candlestick?
- Trade with Parabolic SAR: A Practical Analysis Guide
- Evening Star Pattern: Structure, Rules, and Risk Controls
- Kelly Criterion: Formula, Position Sizing, and Risk
- What Is the NYSE Minimum Trading Price? Rules Explained
Disclaimer: The content on this page is intended for educational and informational purposes only. It does not constitute financial, investment, tax, or legal advice, and should not be interpreted as a recommendation to buy, sell, or hold any financial instrument or asset. Trading and investing involve significant risk, including the possible loss of your entire capital. Products such as forex, CFDs, and cryptocurrencies carry additional risks due to leverage, high volatility, and limited regulatory protection in some jurisdictions. Past performance of any financial instrument does not guarantee future results. Any market views, forecasts, or opinions expressed are those of the author at the time of writing and may not reflect current market conditions. Platform features, fees, and regulatory status are subject to change — always verify information directly with the relevant provider or regulator before making any financial decision. BrokerSpecs may receive compensation from third parties featured on this site. Always conduct your own due diligence and consider seeking advice from a licensed financial professional before investing. Portions of this article were prepared with the assistance of AI tools and reviewed by our editorial team before publication.