


Related Tags
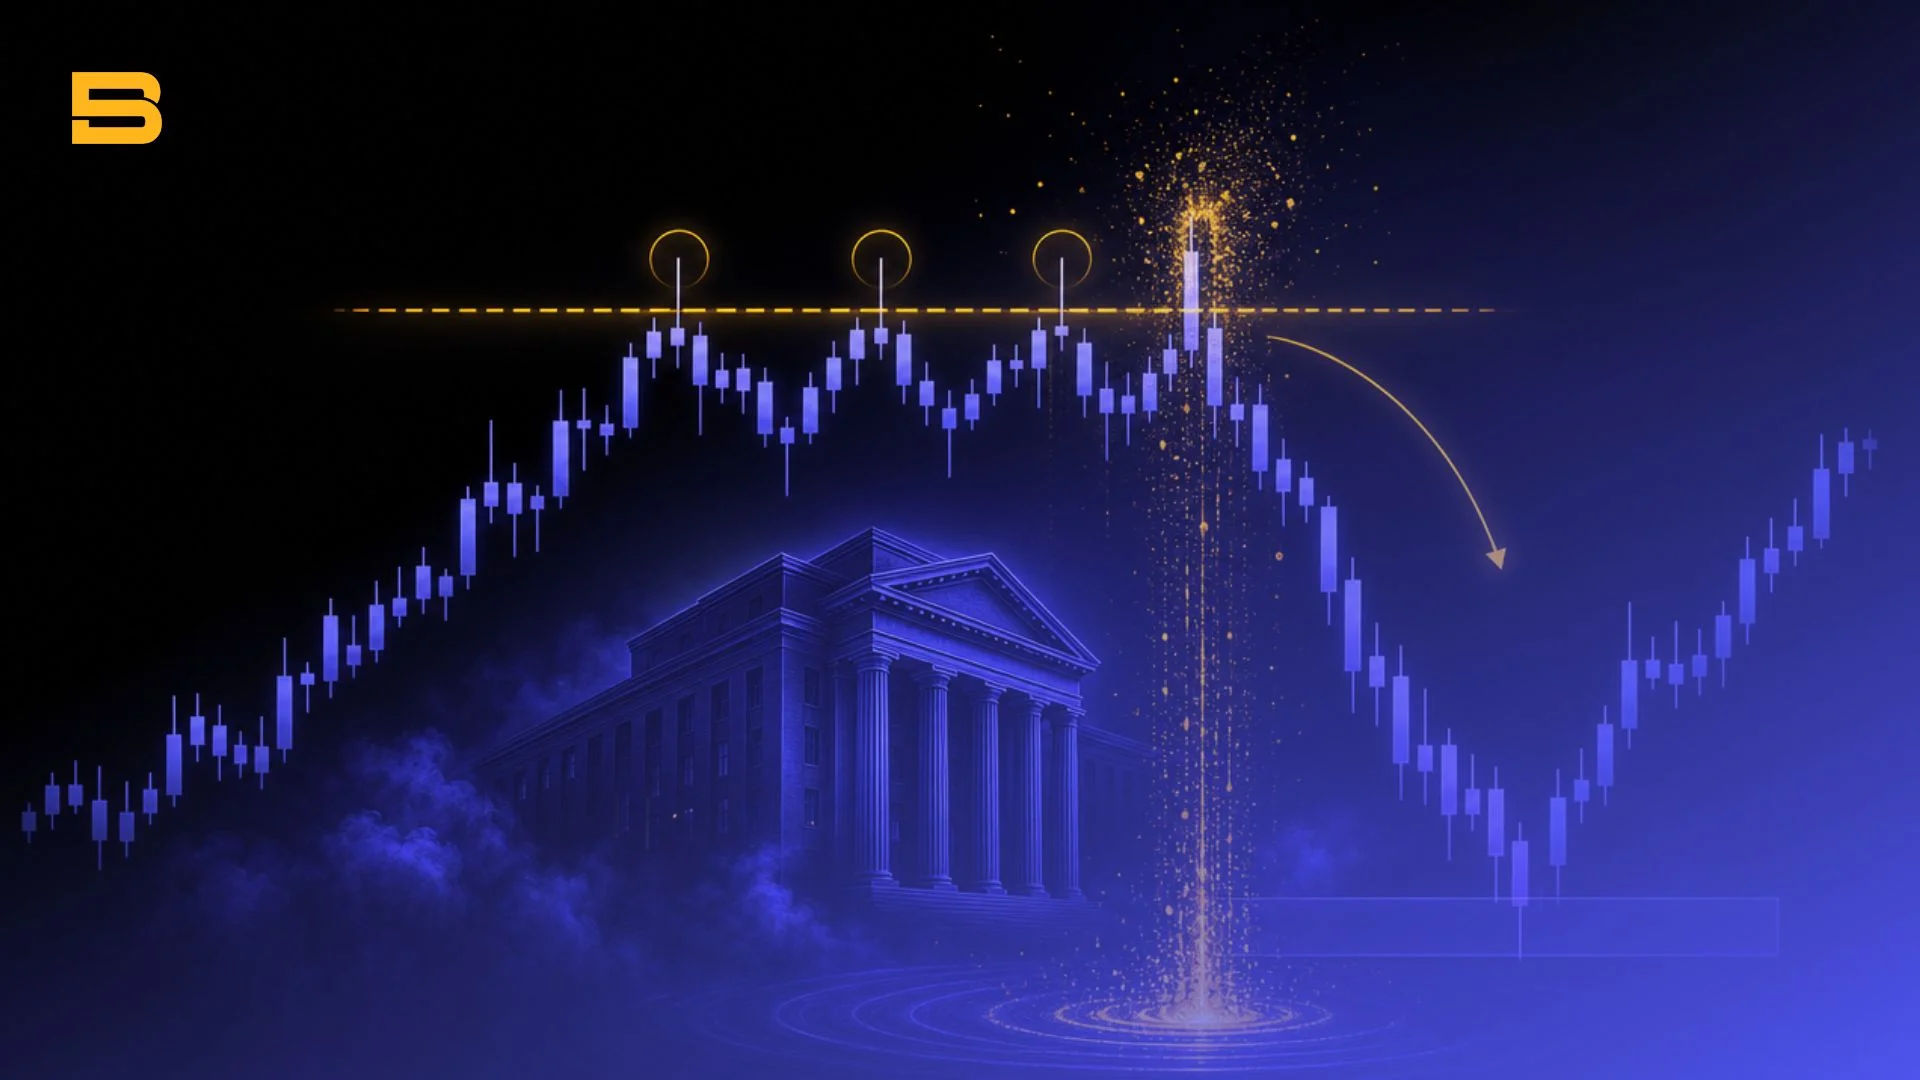
Imagine setting a tight stop loss just above a key resistance level on your EUR/USD chart, confident in your risk management. Within minutes, a sudden, fast-moving wick surges right past that resistance line, triggering your stop order and closing your trade at a loss. Almost immediately, price aggressively reverses and drops precisely toward your original take-profit target. You have just experienced a classic liquidity grab—a price action phenomenon driven by institutional mechanics rather than accidental market noise.
What Is a Liquidity Grab?
A liquidity grab (or liquidity sweep) is an institutional market execution where large institutional players push price beyond technical support or resistance levels to trigger retail stop-loss orders and absorb resting liquidity before violently reversing direction.
To understand why this happens, you need to understand institutional order size constraints. Central banks, hedge funds, and institutional market participants cannot simply enter a $500 million position at market price without suffering massive slippage. To fulfill large buy orders, institutions need an equal volume of sell orders. Conversely, to enter massive short positions, they require a heavy concentration of buy orders.
Under the smart money concept (SMC) framework — a widely used price-action theory, not a confirmed institutional policy — many traders interpret institutional behavior as non-random, with large players likely to target price zones where retail stop losses cluster, using those resting orders as counterpart liquidity to help fill large positions.
What Is Liquidity Grab in Stock Market and Forex Trading?
While the core mechanical principles remain identical across financial markets, the underlying infrastructure creates distinct differences between equities and currency trading.
In stock markets, equity trading occurs on centralized exchanges like the New York Stock Exchange or Bursa Malaysia with a centralized order book. Market participants can observe depth-of-market (DOM) data to see limit orders waiting at specific price levels. Institutional fund managers frequently utilize dark pools and off-exchange trading systems to execute massive block orders without revealing their order flow to retail market participants.
However, when price approaches obvious technical levels on public exchanges—such as 52-week highs, major moving averages, or pre-market highs—institutions aggressively trigger accumulated stop orders to fill their position transfers. Regulators like the US Securities and Exchange Commission (SEC) oversee stock market execution transparency to enforce fair market access and mitigate market manipulation risks.
In contrast, the foreign exchange market operates as a decentralized, over-the-counter (OTC) environment dominated by tier-1 banks and major liquidity providers. Institutional FX desks process continuous order flow, allowing them to anticipate where retail buy stops and sell stops are concentrated.
This structural dynamic makes forex pairs particularly prone to swift session sweeps, where price momentarily wicks through swing highs or lows before returning to value zones. Regardless of the market you trade, understanding order book dynamics and order blocks — price zones where institutions previously placed large orders, often acting as future support or resistance — is essential to recognize institutional footprints.
The Institutional Mechanics Behind Liquidity Pools
Liquidity does not sit evenly across a price chart; it accumulates in dense clusters known as liquidity pools.
Buy-Side vs Sell-Side Liquidity
Liquidity pools are categorized based on the types of pending orders waiting at specific price zones:
- Buy-Side Liquidity (BSL): Concentrated above swing highs, resistance levels, and equal highs. BSL primarily consists of buy stop orders from retail traders hedging short positions or momentum breakout traders setting buy stop market orders.
- Sell-Side Liquidity (SSL): Concentrated below swing lows, support levels, and equal lows. SSL is composed of sell stop orders from retail traders protecting long positions or breakdown traders entering sell stop market orders.
When institutions need to accumulate a sell position, they push price upward into Buy-Side Liquidity to absorb those buy stop orders. Once the resting buy orders match their institutional sell orders, the buy pressure evaporates, causing price to fall rapidly.
Inducement vs Liquidity Grabs
A key element in institutional execution is inducement in trading. Inducement refers to minor chart patterns, internal micro-structures, or weak trendlines engineered by institutions to lure early retail traders into taking positions prematurely. Retail traders see a minor support level hold and enter buy orders, placing their stop losses directly underneath.
Once enough retail orders accumulate beneath this minor structure, institutions trigger a full liquidity grab—sweeping the induced stops to collect liquidity before expanding in the true intended direction.
The Judas Swing as a Session-Based Liquidity Grab
In intraday trading, liquidity sweeps often follow time-based patterns aligned with major market sessions. The Judas Swing is a classic session-based false move occurring predominantly during the London or New York session opens.
As the London session begins, institutional market makers deliberately drive price in the opposite direction of the day's true intended trend, sweeping Asia session high or low liquidity pools. Once this initial liquidity is captured, price aggressively reverses to establish the true expansion trend for the session.
Liquidity Grab vs Breakout: Key Differences
A costly and common mistake among retail traders is confusing a temporary liquidity sweep with a genuine market structure breakout.
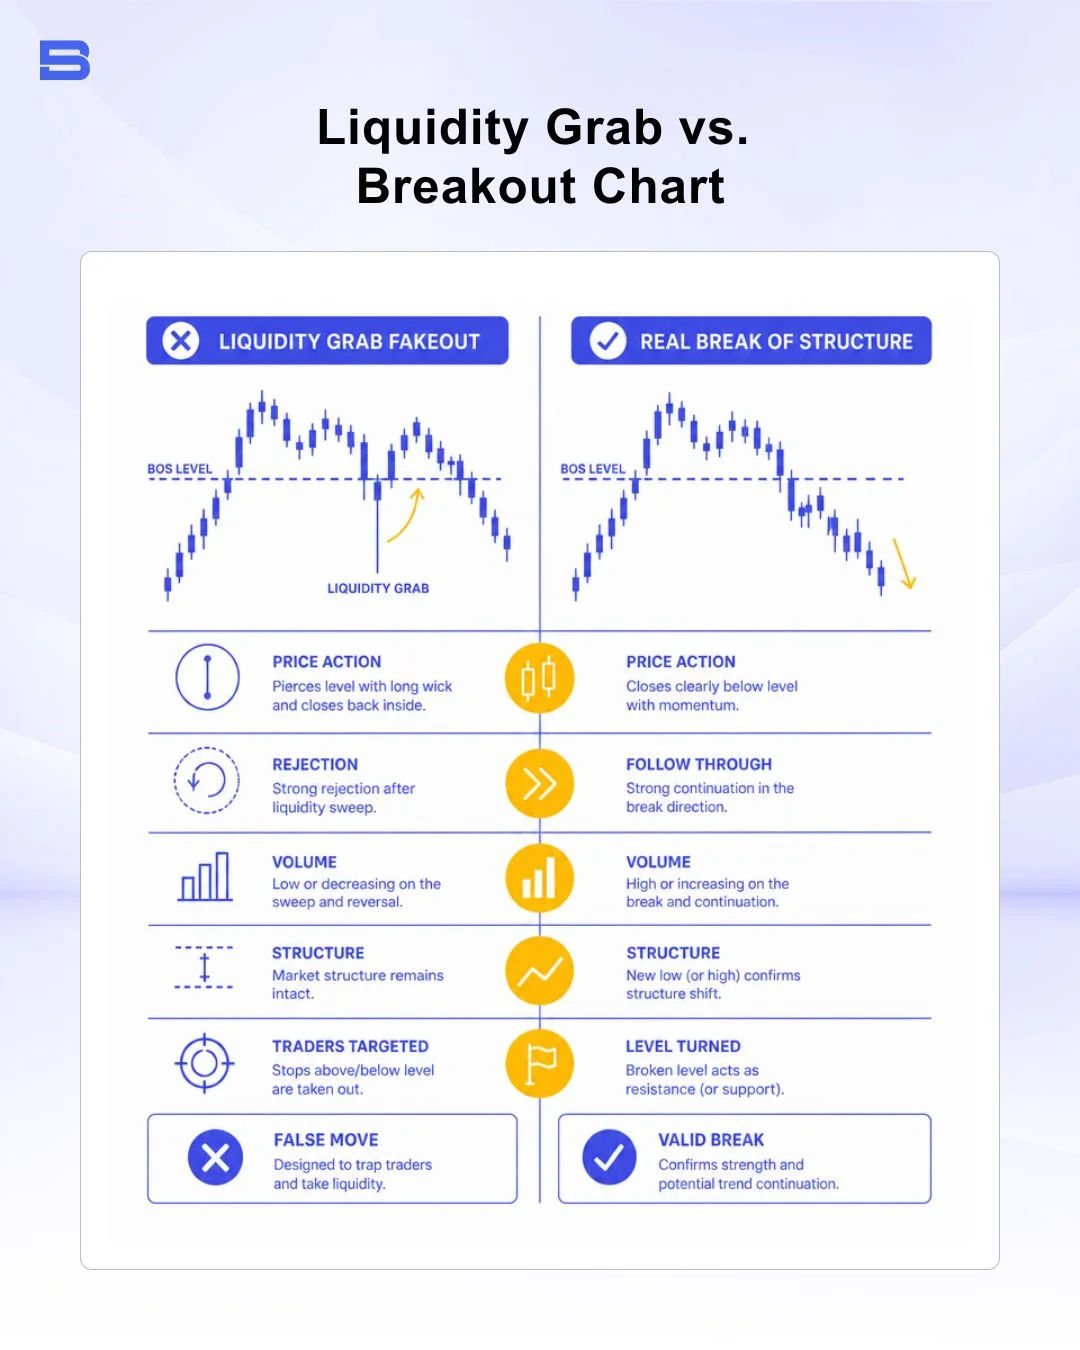
A liquidity grab is defined by rejection and failure to hold new price territory. A genuine breakout reflects price acceptance, where institutional buyers or sellers are actively building value above or below key structural boundaries.
How to Spot and Trade a Liquidity Grab
Trading alongside institutional order flow requires patience, systematic rules, and confirmation rather than guessing where sweeps will occur.
How to Identify a Liquidity Grab on Your Chart
To spot a valid liquidity sweep on your chart, apply strict candle-close guidelines:
- Locate Clean Highs or Lows: Identify obvious technical pools—such as equal highs (EQH), equal lows (EQL), daily highs/lows, or session extremes—where retail stop-loss clusters sit.
- Observe the Piercing Movement: Watch as price aggressively spikes through the key technical level.
- Verify the Reversal Candle Close: Do not enter while the candle is forming. Wait for the candle to close. A valid liquidity sweep requires the candle body to close back behind the swept level, leaving a long rejection wick extended into the liquidity pool.
Is a Liquidity Grab Bullish or Bearish?
A liquidity sweep itself is contextually directional based on which liquidity pool was swept:
- Bullish Liquidity Grab: Price sweeps below a key swing low or support zone to clean out sell-side liquidity (SSL). Once sell stops are filled by institutional buy orders, the market turns bullish.
- Bearish Liquidity Grab: Price sweeps above a key swing high or resistance zone to absorb buy-side liquidity (BSL). Once buy stops are matched with institutional short positions, the market turns bearish.
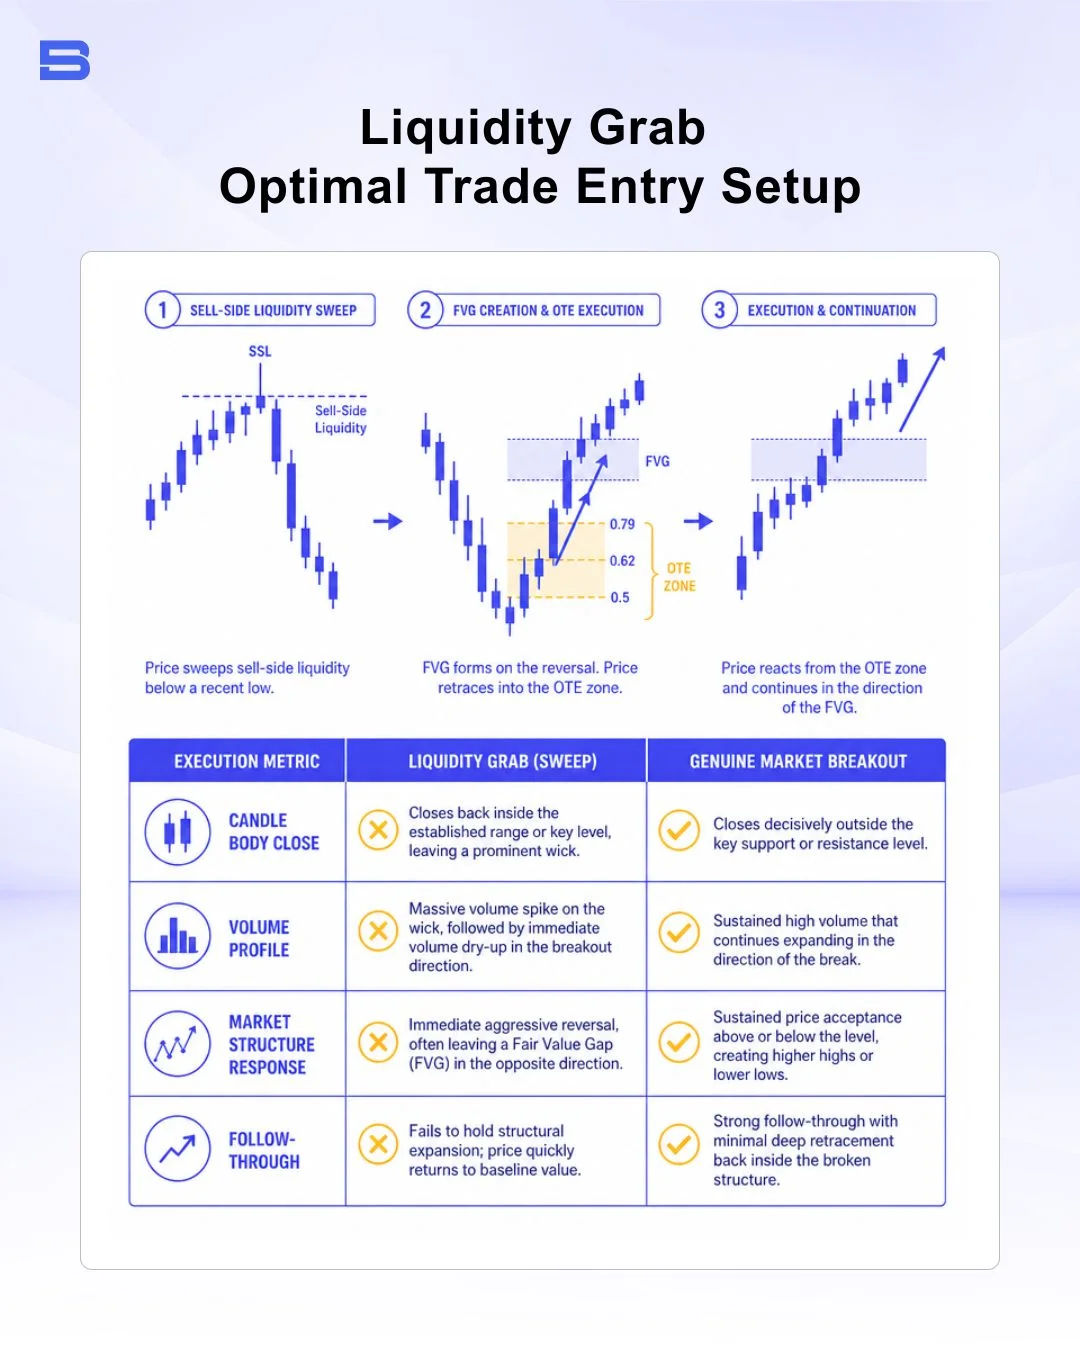
Confirming Shifts via Break of Structure (BOS) & Fair Value Gaps (FVG)
Never trade a wick sweep in isolation. To confirm that institutions have taken control, wait for structural confirmation on your lower timeframes:
- Shift in Market Structure: Following a sell-side liquidity sweep, wait for price to surge upward and displace past the recent micro swing high, creating a clear break of structure (BOS).
- Fair Value Gap (FVG) Formation: The aggressive reversal movement should leave a three-candle imbalance on your chart, known as a fair value gap. This imbalance confirms strong institutional displacement.
Execution Rules & Optimal Trade Entry (OTE)
Once displacement and a Fair Value Gap are confirmed, enter on a retracement to the imbalance zone using optimal trade entry (OTE) Fibonacci levels (typically between 61.8% and 79% retracement).
Worked Risk Scenario
Consider a live trading scenario on EUR/USD:
- Account Capital: $10,000
- Risk Parameter: 1% risk per trade ($100 maximum risk)
- Setup: Price sweeps equal highs at $1.1000 (buy-side liquidity sweep) and rapidly reverses, leaving a lower-timeframe Break of Structure (BOS) and an FVG.
- Entry Price: $1.0980 (limit sell entry on retracement to the FVG)
- Stop Loss: $1.1010 (placed 10 pips above the liquidity sweep high at $1.1000; total stop distance = 30 pips)
- Take Profit Target: $1.0900 (placed at the opposing sell-side liquidity pool/swing low; total target distance = 80 pips)
- Position Sizing Calculation:
Position Size = Risk Amount / Stop Distance in Pips x Pip Value
Position Size = $100 / (30 x $10 /lot) = 0.33 lots (33,000 units)
- Risk-to-Reward Ratio (R:R): 30 pips risk vs 80 pips reward = 1:2.67 R:R ($100 risk for a $267 potential return).
Leverage amplifies your returns when you are right, but it accelerates capital destruction just as quickly when the market moves against you—a 2.5% move against a 30:1 position can wipe out a large share of your margin. Managing risk through exact position sizing ensures survival when a liquidity sweep evolves into a genuine breakout.
Final Thoughts
Understanding liquidity sweep shifts your perspective from trading against institutional market dynamics to aligning your execution with smart money order flow. By training yourself to identify high-density liquidity pools, waiting for candle-close rejection wicks, and demanding lower-timeframe structural confirmation through Fair Value Gaps and Breaks of Structure, you can avoid becoming counterparty liquidity for institutional participants.
Always validate your entry parameters, maintain strict position sizing discipline, and manage risk systematically on every trade setup.
- How to Build an Investment Plan That Actually Works for You?
- What Is the MACD Indicator and How to Use It
- What Is a Wedge Pattern in Trading?
- What Is Ichimoku Cloud Strategy? A Complete Trading System
- Mastering Elliott Wave Theory: Rules and Trading Strategies
- News Trading: Strategies, Execution Risks, and Risk Control
- What Is an Iron Condor Options Strategy?
- Backtesting Explained: What It Is and Why It Really Matters
- Grid Trading: Mechanics, Parameters, and Risk Strategies
- What Is Breakout Trading and How Does It Work?
- Mean Reversion: Technical Strategies and Risk Frameworks
- Momentum Trading: Indicators, Strategies, and Risk Control
- Hammer Candlestick: Structure, Meaning, and Strategy
- Doji Candlestick: Types, Signals, and Trading Strategies
- What Is the Sharpe Ratio and How to Calculate It
- What Is VWAP and How Do Traders Use It?
- Trade the Ascending Triangle: A Step-by-Step Practical Guide
- What Is the Stochastic Oscillator and How to Use It
- How to Trade the Descending Triangle Pattern
- High Frequency Trading: Speed, Algorithms, and Market Impact
- What Is Volume Profile and How to Use It in Trading
- What Is a Morning Star Pattern Candlestick?
- Trade with Parabolic SAR: A Practical Analysis Guide
- Evening Star Pattern: Structure, Rules, and Risk Controls
- Kelly Criterion: Formula, Position Sizing, and Risk
- What Is the NYSE Minimum Trading Price? Rules Explained
Disclaimer: The content on this page is intended for educational and informational purposes only. It does not constitute financial, investment, tax, or legal advice, and should not be interpreted as a recommendation to buy, sell, or hold any financial instrument or asset. Trading and investing involve significant risk, including the possible loss of your entire capital. Products such as forex, CFDs, and cryptocurrencies carry additional risks due to leverage, high volatility, and limited regulatory protection in some jurisdictions. Past performance of any financial instrument does not guarantee future results. Any market views, forecasts, or opinions expressed are those of the author at the time of writing and may not reflect current market conditions. Platform features, fees, and regulatory status are subject to change — always verify information directly with the relevant provider or regulator before making any financial decision. BrokerSpecs may receive compensation from third parties featured on this site. Always conduct your own due diligence and consider seeking advice from a licensed financial professional before investing. Portions of this article were prepared with the assistance of AI tools and reviewed by our editorial team before publication.