


Related Tags
You enter a solid long position after hours of patient technical scanning, confident that the broader momentum is firmly on your side. Two bars later, a sudden erratic red bar spikes downward, clipping your stop-loss order right before price aggressively rebounds back to new session highs.
Standard candlestick charts capture every volatile tick, but they frequently trick disciplined traders into abandoning profitable swings due to intraday market noise. The Heikin Ashi chart solves this exact friction by calculating synthetic, averaged candle values to help you filter choppy market turbulence and stay aligned with the actual prevailing trend.
What Is a Heikin Ashi Chart and How Does It Work?
Originating from the Japanese phrase meaning "average bar," a heikin ashi chart is a technical charting tool that averages price data across two periods to filter market noise and highlight underlying trend direction. Unlike conventional charting that records raw tick prints, this visual technique recalculates the open, high, low, and close (OHLC) of each candle. The result is a continuous flow of consistent green or red candle sequences that make structural momentum obvious at a glance.
Traditional candlestick bars alternate erratically between green and red during routine pullbacks, testing your emotional discipline and tempting you into premature exits. Heikin Ashi charts smooth out these transient market fluctuations, creating uniform sequences during sustained trends.
You can apply these modified bars across any liquid market, including forex pairs, broad stock indices, and commodities. However, because these bars reflect synthetic mathematical averages rather than pure live prices, you must never treat them like conventional transaction bars.
The Heikin Ashi Formula: How Modified OHLC Values Are Calculated
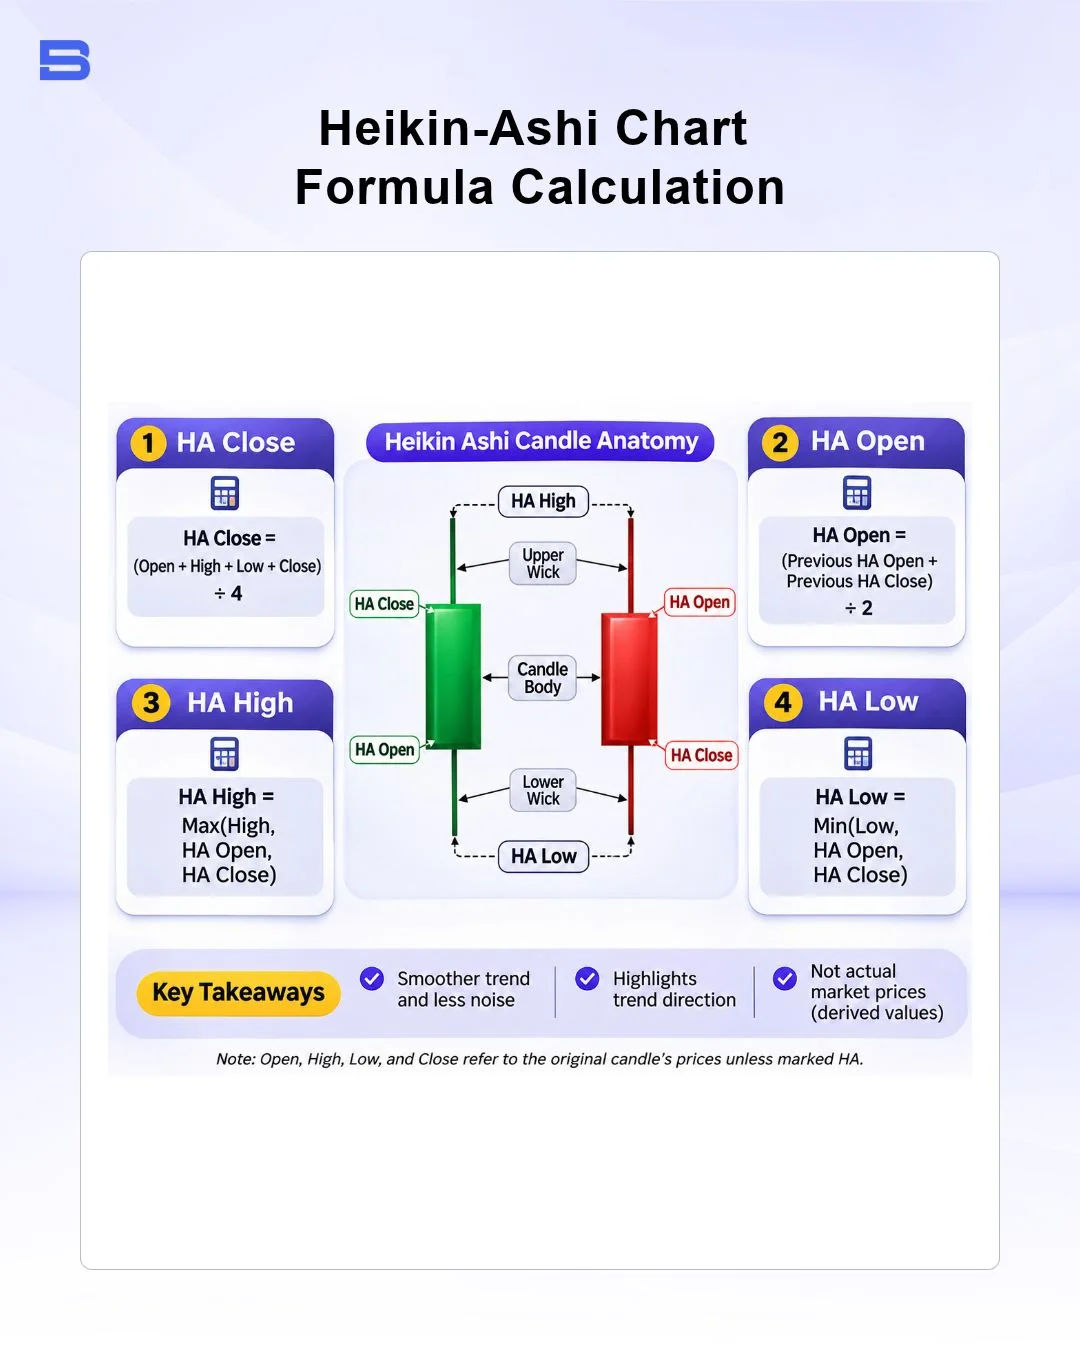
The visual smoothness of a Heikin Ashi chart is powered by a four-part mathematical formula that ties each current bar to the midpoint of the preceding candle. Understanding how an indicator is mathematically derived helps prevent traders from misinterpreting calculated values as executable quotes.
- Close_HA = (Open + High + Low + Close) / 4
- Open_HA = (Open_HA (prev) + Close_HA (prev)) / 2
- High_HA = max(High, Open_HA, Close_HA)
- Low_HA = min(Low, Open_HA, Close_HA)
To see how this works in live conditions, imagine trading the EUR/USD. The previous Heikin Ashi candle printed an open of 1.0800 and a close of 1.0840. The current live session forms a raw candlestick bar with an open of 1.0835, a high of 1.0890, a low of 1.0825, and a close of 1.0870.
Under the Heikin Ashi formula, the synthetic close calculates as (1.0835 + 1.0890 + 1.0825 + 1.0870) / 4 = 1.0855. Meanwhile, the synthetic open calculates as the midpoint of the previous bar: (1.0800 + 1.0840) / 2 = 1.0820. The high maps to the maximum of the real high (1.0890) and synthetic bounds (1.0855, 1.0820), setting it at 1.0890, while the low takes the minimum, registering at 1.0820.
Notice how the calculated Heikin Ashi close registers at 1.0855, while actual market participants are actively trading at 1.0870. This 15-pip mathematical lag is the exact price you pay for visual clarity.
Heikin Ashi vs Regular Candlesticks: Key Structural Differences
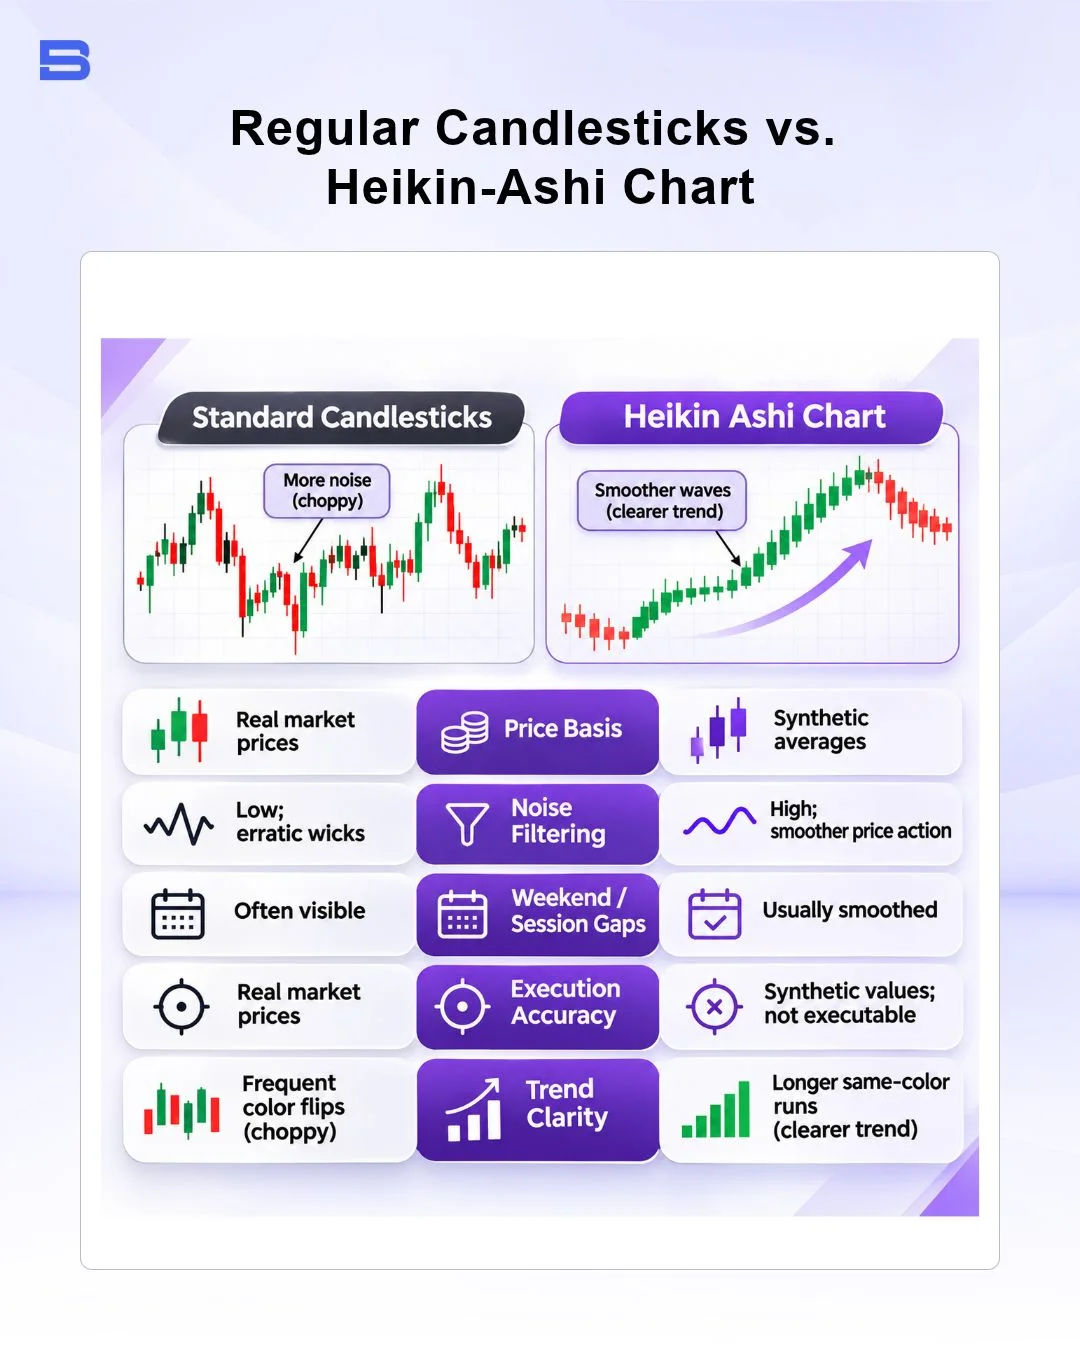
The primary practical distinction between these charting methods comes down to raw execution fidelity versus visual trend smoothing. Regular candlesticks present unprocessed transaction prints from the broker's liquidity book, capturing every gap, price spike, and momentary consolidation zone. In contrast, Heikin Ashi candles reconstruct the visual narrative by blending recent historical prices with current range data.
Because the synthetic open always begins at the middle of the previous bar's real body, weekend and overnight opening gaps disappear on a Heikin Ashi chart. While this produces clean, aesthetically pleasing trend waves, it also masks violent price jumps that could threaten highly leveraged positions. Traders using traditional bars observe immediate market sentiment shifts, whereas Heikin Ashi traders experience a slight confirmation delay.
How to Trade with Heikin Ashi Chart: Core Trend Rules and Setups
Reading a Heikin Ashi chart requires looking for structural candle shapes rather than complex multi-bar formations. By monitoring body expansion and wick presence, you can quickly assess whether market participants possess strong directional conviction or if a move is exhausting itself.
Identifying Strong Bullish and Bearish Trends
A powerful upward trend manifests as consecutive green candles with broad bodies and prominent upper wicks, but absolutely no lower wicks. The complete absence of a lower shadow signals that buyers are dominating the auction so aggressively that price never drops below the synthetic open.
Conversely, a sustained bearish trend displays tall red bodies with long lower wicks and clean, flat tops with no upper wicks. As long as these flat tops or flat bottoms persist unbroken, momentum remains firmly intact, providing a visual cue to let your winning runner trades develop without second-guessing normal intraday counter-moves.
Reading Heikin Ashi Doji and Reversal Signals
When an established trend begins losing momentum, the candles reflect compression. You will notice shrinking real bodies paired with emerging opposing wicks on both sides.
A Heikin Ashi doji features an exceptionally thin body framed by long upper and lower shadows, resembling a cross. In this charting environment, a doji does not mandate an immediate counter-trend reversal trade; rather, it warns you that momentum is stalling into consolidation. It advises tightening trailing stops or locking in partial profits while waiting for standard candlestick confirmation before considering an exit.
Combining Heikin Ashi with Moving Averages for Trend Confirmation
Because Heikin Ashi averages price action, relying solely on single candles can occasionally trap you in sideways whipsaws during low-volume ranges. Pairing the smoothed candles with an objective baseline trend filter, such as an exponential moving average or a responsive Hull Moving Average, creates a robust decision framework.
You can also cross-examine momentum using a traditional oscillator like Williams %R to confirm overbought or oversold extremes before entering on a candle color change. When price prints above the moving average and transitions from a transitional doji into a shave-bottom green candle, the setup may offer higher statistical confluence than an isolated visual signal, though this isn't guaranteed.
The Execution Price Trap: Why Heikin Ashi Is a Lagging Tool
The greatest hazard retail traders face when adopting this tool is treating synthetic candle highs, lows, and closes as live broker quotes. Regulators in many jurisdictions require brokers to provide transparent order execution and fair dealing for retail leveraged clients, so it's worth reviewing your own broker's execution policy.
When you click "Buy Market" while staring at a Heikin Ashi candle, your broker fills your order at the prevailing interbank ask price, not the smoothed HA close. During fast-moving sessions, the real market quote might trade significantly higher than the synthetic print, leading to substantial unexpected slippage. Always remember that the smoothing mechanism is inherently a Heikin Ashi lagging indicator that delays turning points by averaging past data.
Practical Execution and Stop-Loss Rules Under Real Market Conditions
To avoid cost-heavy execution mistakes, keep a split-screen or dual-chart setup active during active sessions. Use the Heikin Ashi chart on your primary monitor to filter psychological noise and identify broad directional trends, but always reference a raw candlestick chart for order routing.
Never place your structural stop-loss orders at the bottom of a synthetic Heikin Ashi wick. Instead, anchor your stops and limit profit targets to verifiable market swing points, horizontal support zones, or standard mathematical pivot points.
Leverage magnifies both potential gains and losses equally. Relying on smoothed synthetic levels during volatile economic news events can trigger severe account drawdowns if the real bid plunges far lower than the averaged bar displays.
The Bottom Line
A Heikin Ashi chart serves as a dependable visual filter for traders overwhelmed by erratic market noise, providing an intuitive way to track strong trends without getting shaken out prematurely. However, its aesthetic smoothness relies entirely on lagged synthetic mathematics rather than live liquidity prints. Treat Heikin Ashi as a strategic momentum compass, confirm its signals alongside objective indicators, and always execute your entries and manage risk against true market prices.
- How to Build an Investment Plan That Actually Works for You?
- What Is the MACD Indicator and How to Use It
- What Is a Wedge Pattern in Trading?
- What Is Ichimoku Cloud Strategy? A Complete Trading System
- Mastering Elliott Wave Theory: Rules and Trading Strategies
- News Trading: Strategies, Execution Risks, and Risk Control
- What Is an Iron Condor Options Strategy?
- Backtesting Explained: What It Is and Why It Really Matters
- Grid Trading: Mechanics, Parameters, and Risk Strategies
- What Is Breakout Trading and How Does It Work?
- Mean Reversion: Technical Strategies and Risk Frameworks
- Momentum Trading: Indicators, Strategies, and Risk Control
- Hammer Candlestick: Structure, Meaning, and Strategy
- Doji Candlestick: Types, Signals, and Trading Strategies
- What Is the Sharpe Ratio and How to Calculate It
- What Is VWAP and How Do Traders Use It?
- Trade the Ascending Triangle: A Step-by-Step Practical Guide
- What Is the Stochastic Oscillator and How to Use It
- How to Trade the Descending Triangle Pattern
- High Frequency Trading: Speed, Algorithms, and Market Impact
- What Is Volume Profile and How to Use It in Trading
- What Is a Morning Star Pattern Candlestick?
- Trade with Parabolic SAR: A Practical Analysis Guide
- Evening Star Pattern: Structure, Rules, and Risk Controls
- Kelly Criterion: Formula, Position Sizing, and Risk
- What Is the NYSE Minimum Trading Price? Rules Explained
Disclaimer: The content on this page is intended for educational and informational purposes only. It does not constitute financial, investment, tax, or legal advice, and should not be interpreted as a recommendation to buy, sell, or hold any financial instrument or asset. Trading and investing involve significant risk, including the possible loss of your entire capital. Products such as forex, CFDs, and cryptocurrencies carry additional risks due to leverage, high volatility, and limited regulatory protection in some jurisdictions. Past performance of any financial instrument does not guarantee future results. Any market views, forecasts, or opinions expressed are those of the author at the time of writing and may not reflect current market conditions. Platform features, fees, and regulatory status are subject to change — always verify information directly with the relevant provider or regulator before making any financial decision. BrokerSpecs may receive compensation from third parties featured on this site. Always conduct your own due diligence and consider seeking advice from a licensed financial professional before investing. Portions of this article were prepared with the assistance of AI tools and reviewed by our editorial team before publication.