



Related Tags
Entering a fast-moving financial market can feel like reading a chart in the middle of a storm. Prices tick up and down constantly, driven by order flow, economic news, and market noise.
A moving average is a foundational indicator in technical analysis designed to filter out that short-term price noise. By smoothing raw price data over a specified time period, it creates a clean line that helps you identify market direction and dynamic support and resistance levels.
What Is a Moving Average in Trading?
In technical analysis, it's a calculation that takes a security's price data over a set number of periods and averages those values into a single line on your chart. The line is called "moving" because every time a new price candle closes, the oldest data point is dropped and the newest price is added to the calculation.
When plotted on a candlestick chart, a moving average acts as a visual filter. Rather than focusing on every individual high and low wick of a single candlestick chart, you can look at the direction of the moving average line to determine the prevailing trend.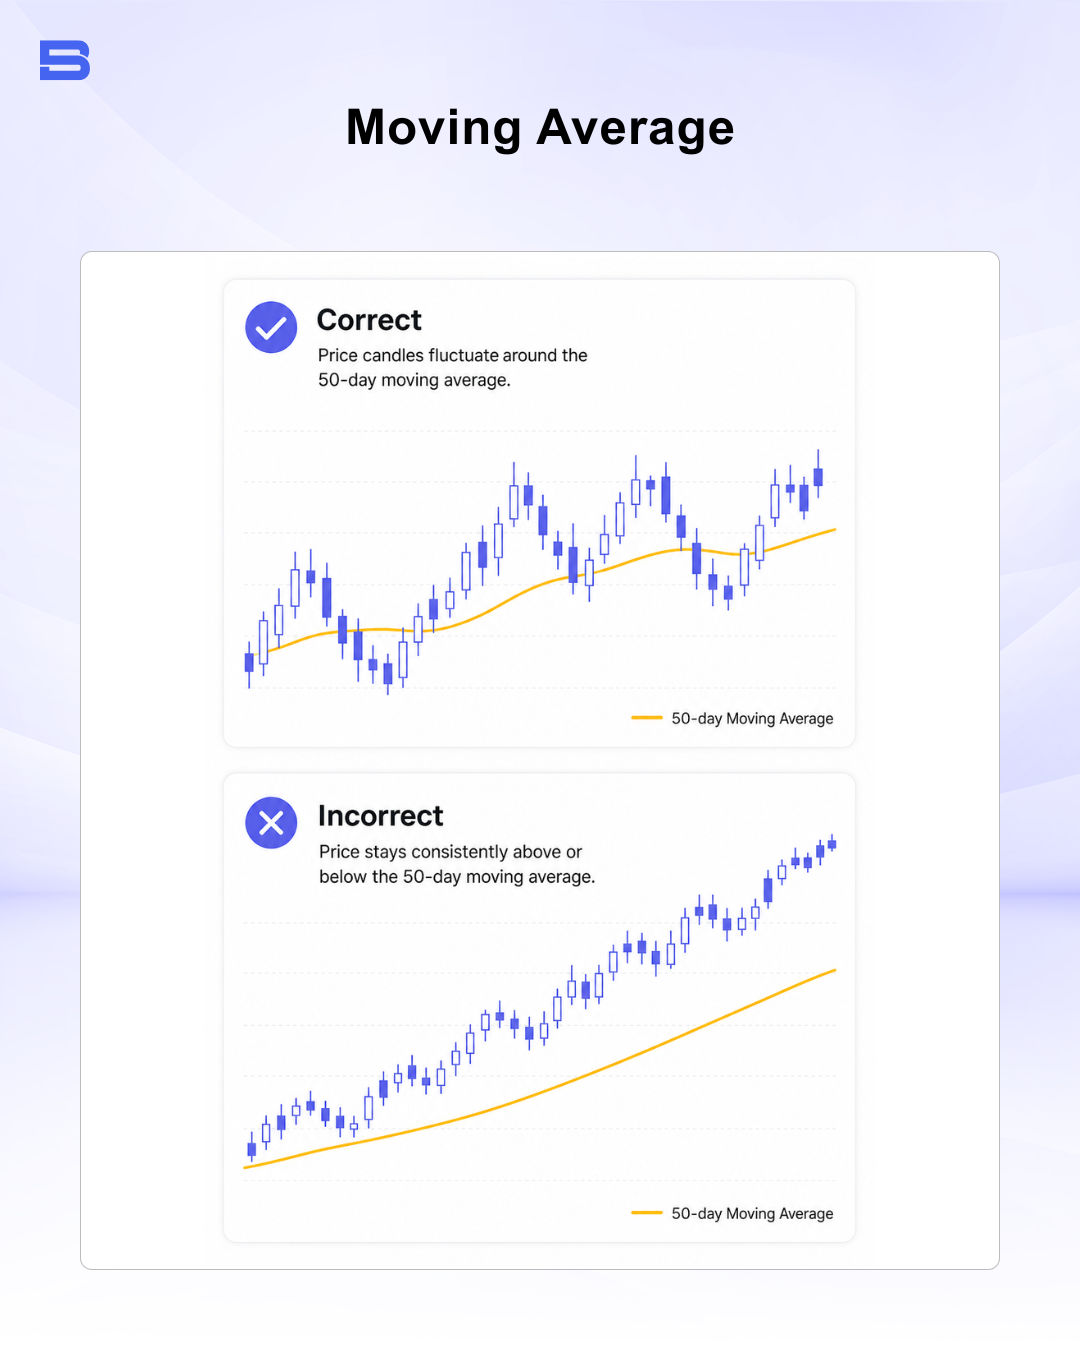 Understanding basic quantitative tools like moving averages is considered essential groundwork before trading in volatile markets, helping you interpret price action with more confidence.
Simple Moving Average (SMA) vs. Exponential Moving Average (EMA)
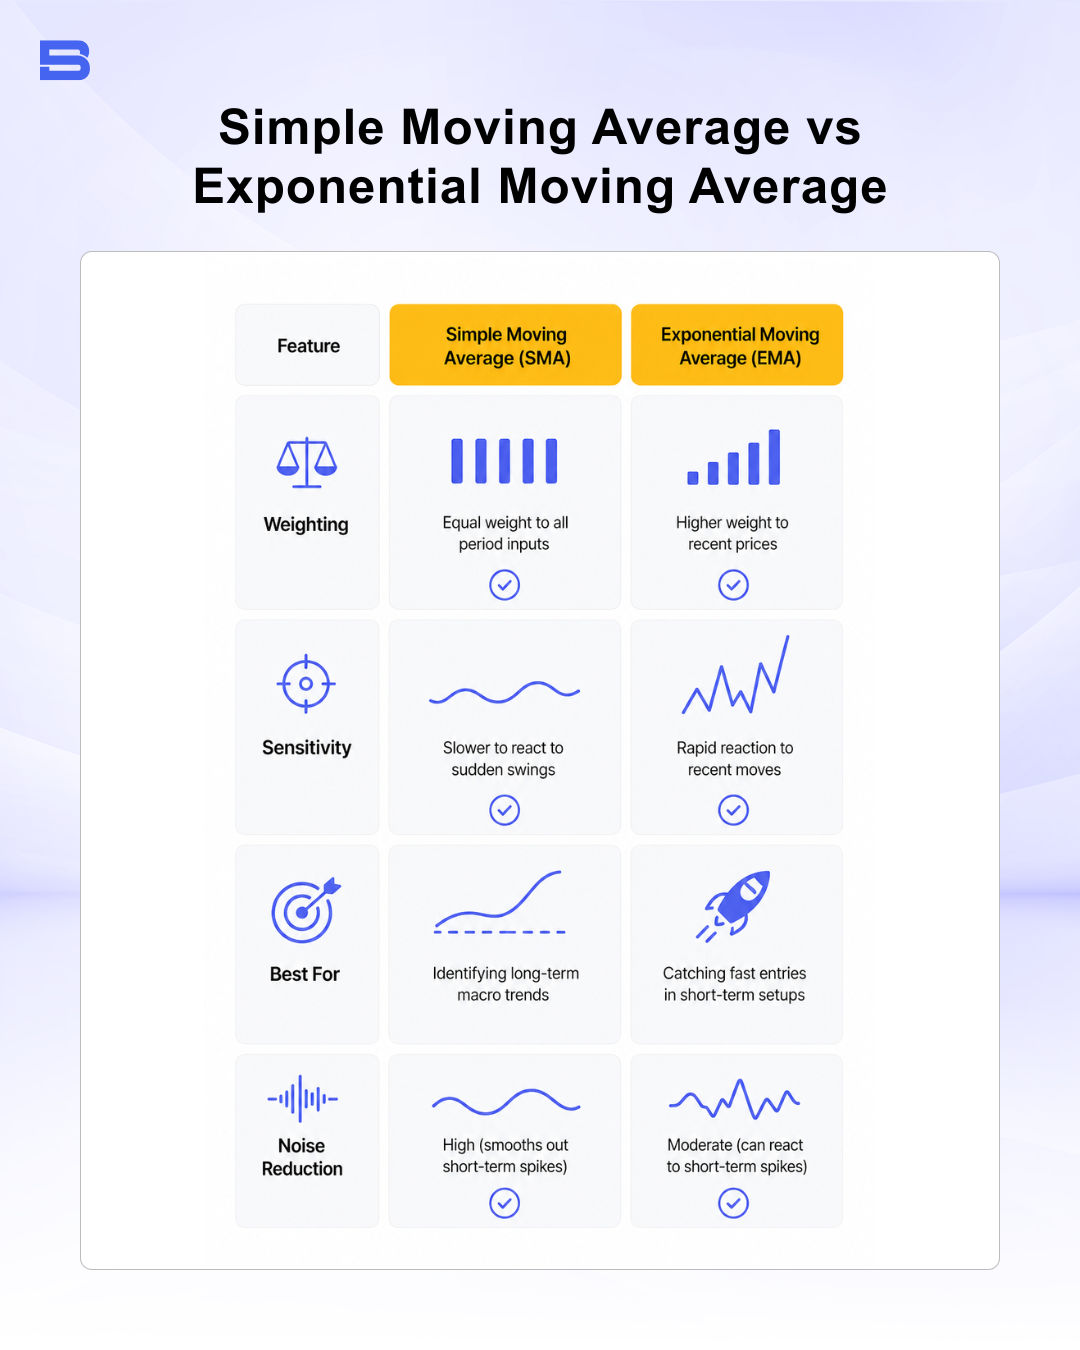
While all of them smooth price data, they calculate that data differently. The two most common types used by retail and institutional traders are the Simple Moving Average (SMA) and the Exponential Moving Average (EMA). A third variation, the Weighted Moving Average (WMA), assigns custom weights to prices but is less widely used in basic chart setups.
Simple Moving Average (SMA) Calculation
The Simple Moving Average (SMA) treats every price point in the chosen period with equal importance. To calculate a 5-day SMA, you sum the closing prices of the last 5 days and divide the total by 5.
SMA = (P₁ + P₂ + P₃ + P₄ + P₅) ÷ 5
Suppose an asset closes at the following prices over five consecutive trading sessions:
- Day 1: $100
- Day 2: $102
- Day 3: $101
- Day 4: $105
- Day 5: $107
SMA = (100 + 102 + 101 + 105 + 107) ÷ 5 = 515 ÷ 5 = $103
The 5-day SMA value for Day 5 is $103. When Day 6 closes at $109, the price from Day 1 ($100) is dropped, and the new average is calculated using Days 2 through 6.
Exponential Moving Average (EMA) Calculation
The Exponential Moving Average (EMA) addresses a common critique of the SMA: it gives equal weight to older data that may no longer be relevant. Instead, the EMA applies a weighting multiplier to place greater emphasis on recent price action.
Multiplier = 2 ÷ (N + 1)
For a 10-day EMA, the weighting multiplier is calculated as:
Multiplier = 2 ÷ (10 + 1) = 2 ÷ 11 ≈ 18.18%
Because recent prices carry more statistical weight, an EMA responds faster to sudden market price changes than an SMA. However, that faster reaction speed means the EMA may also generate more false signals during low-volatility conditions.
Using Moving Averages as Dynamic Support and Resistance
Traditional horizontal support and resistance lines are drawn at fixed historical price levels. By contrast, it creates dynamic support and resistance levels that shift continuously alongside new price data.
In a strong uptrend, price action often pulls back toward a core trend line—such as the 20-period or 50-period moving average—bounces off it, and continues upward. In a downtrend, that same average can act as a dynamic ceiling resistance.
Traders monitor these dynamic zones for trend confirmation:
- Trend Pullback Bounce: Looking for bullish confirmation wicks when price touches a rising 50-day SMA in an established uptrend.
- Breakout Failure: Observing whether price fails to break above a declining 200-day SMA, indicating sustained overhead selling pressure.
How Traders Use Moving Averages
Traders incorporate these strategies into structured trading plans to establish market direction and isolate potential execution triggers.
Trend Filtering and Direction
The simplest way to use a moving average is as a directional filter:
- Bullish Filter: Price trades consistently above the moving average, and the average line angles upward.
- Bearish Filter: Price trades below the moving average, and the average line slopes downward.
If your strategy dictates trading only in the direction of the macro trend, you might restrict buy setups to times when price is above the 200-day moving average.
Moving Average Crossovers
Crossover strategies combine two of these indicators across different timeframes — one short-term (fast) and one long-term (slow).
- Bullish Crossover: Occurs when the fast moving average crosses above the slow moving average, signaling accelerating upward momentum.
- Bearish Crossover: Occurs when the fast moving average crosses below the slow moving average, indicating shifting downward momentum.
Golden Cross and Death Cross Signals
Two widely followed technical crossover setups involve the 50-day and 200-day SMAs:
- Golden Cross: The 50-day SMA crosses above the 200-day SMA. Historically, market participants view this as confirmation of a long-term bull market transition.
- Death Cross: The 50-day SMA crosses below the 200-day SMA. This signals potential long-term bearish conditions.
Choosing the Right Moving Average for Your Trading Style
Selecting appropriate period settings depends entirely on your market horizon and risk approach. Short periods react quickly but generate more whipsaws; long periods are smooth but lag price movements significantly.
- Day Trading and Scalping (1-minute to 15-minute charts): Traders often use 9-period, 13-period, or 21-period EMAs to capture fast intraday momentum moves.
- Swing Trading (4-hour to Daily charts): Traders frequently rely on 20-period and 50-period SMAs or EMAs to identify multi-day swings and retracements.
- Position Trading (Daily to Weekly charts): Investors focused on position trading rely heavily on the 50-day, 100-day, and 200-day SMAs to guide macro portfolio allocations.
Moving Averages and Market Sentiment
A moving average reflects aggregate market sentiment across different participant types. When a benchmark asset trades well above its 200-day moving average, institutional buying pressure has sustained higher valuations over a multi-month period.
When price approaches major moving averages, order volume often increases. Because thousands of market participants view the exact same key averages on their charts, orders tend to cluster around these technical levels, turning them into self-fulfilling market zones.
Limitations of Moving Averages: Lag and Whipsaws
They're valuable tools, but they are not predictive indicators. Understanding their limitations is critical for sensible capital preservation.
- Moving Average Lag: Because they're based on historical prices, the indicator always lags current market action. By the time a moving average crossover confirms a new trend, a significant portion of the price move may already be over.
- Whipsaw Risk in Choppy Markets: Moving averages perform poorly during non-trending, sideways consolidation phases. Price will chop back and forth across the line, generating repeated false breakout signals that can erode trading capital if traded aggressively.
Using stop-loss orders and limiting risk per trade helps protect your balance when market conditions produce these false crossover signals.
Incorporating Moving Averages into Automated and Strategy Systems
Systematic traders often convert moving average logic into quantitative code to trigger algorithmic rules. In automated models and platform setups like copy trading, moving average crossovers often serve as baseline entry/exit logic.
When evaluating automated strategies or following systematic providers, reviewing how their models use moving average filters helps you determine if the underlying logic aligns with your personal risk tolerance.
Summary of Moving Averages
Moving averages smooth raw price data to help you identify directional trends and dynamic market boundaries. While short-term EMAs provide quick sensitivity for active traders, longer-term SMAs offer macro context for long-term strategies. Combining moving averages with clear risk limits ensures you manage lag and sideways market noise effectively.
- How to Build an Investment Plan That Actually Works for You?
- What Is the MACD Indicator and How to Use It
- What Is a Wedge Pattern in Trading?
- What Is Ichimoku Cloud Strategy? A Complete Trading System
- Mastering Elliott Wave Theory: Rules and Trading Strategies
- News Trading: Strategies, Execution Risks, and Risk Control
- What Is an Iron Condor Options Strategy?
- Backtesting Explained: What It Is and Why It Really Matters
- Grid Trading: Mechanics, Parameters, and Risk Strategies
- What Is Breakout Trading and How Does It Work?
- Mean Reversion: Technical Strategies and Risk Frameworks
- Momentum Trading: Indicators, Strategies, and Risk Control
- Hammer Candlestick: Structure, Meaning, and Strategy
- Doji Candlestick: Types, Signals, and Trading Strategies
- What Is the Sharpe Ratio and How to Calculate It
- What Is VWAP and How Do Traders Use It?
- Trade the Ascending Triangle: A Step-by-Step Practical Guide
- What Is the Stochastic Oscillator and How to Use It
- How to Trade the Descending Triangle Pattern
- High Frequency Trading: Speed, Algorithms, and Market Impact
- What Is Volume Profile and How to Use It in Trading
- What Is a Morning Star Pattern Candlestick?
- Trade with Parabolic SAR: A Practical Analysis Guide
- Evening Star Pattern: Structure, Rules, and Risk Controls
- Kelly Criterion: Formula, Position Sizing, and Risk
- What Is the NYSE Minimum Trading Price? Rules Explained
Disclaimer: The content on this page is intended for educational and informational purposes only. It does not constitute financial, investment, tax, or legal advice, and should not be interpreted as a recommendation to buy, sell, or hold any financial instrument or asset. Trading and investing involve significant risk, including the possible loss of your entire capital. Products such as forex, CFDs, and cryptocurrencies carry additional risks due to leverage, high volatility, and limited regulatory protection in some jurisdictions. Past performance of any financial instrument does not guarantee future results. Any market views, forecasts, or opinions expressed are those of the author at the time of writing and may not reflect current market conditions. Platform features, fees, and regulatory status are subject to change — always verify information directly with the relevant provider or regulator before making any financial decision. BrokerSpecs may receive compensation from third parties featured on this site. Always conduct your own due diligence and consider seeking advice from a licensed financial professional before investing. Portions of this article were prepared with the assistance of AI tools and reviewed by our editorial team before publication.