



Related Tags
You sit at your screen, watching a currency pair run hard into a technical ceiling. The candles begin to stall, but instead of guessing where momentum ends, you notice the distinct swings forming an M-like structure across your chart. Harmonic patterns take the visual geometry of classical charting and anchor it to specific mathematical measurements, giving you defined coordinates where trend exhaustion often occurs.
What Is Harmonic Pattern Trading and How Does It Work?
Harmonic patterns are multi-leg geometric price formations that use precise Fibonacci retracement and extension ratios to identify turning points in financial assets. Market technicians developed this methodology systematically after H.M. Gartley’s initial work, treating market swings not as random noise but as cyclical waves that repeatedly reflect human behavior.
Unlike conventional chart patterns that rely purely on visual support or resistance lines, harmonic pattern trading demands strict mathematical verification across five distinct turning points: X, A, B, C, and D. Market research published by institutions like the CFA Institute emphasizes that technical frameworks rely on structural market behavior, yet no geometric setup guarantees market direction.
The Foundational ABCD Pattern
The simplest harmonic structure is the ABCD pattern, a four-point sequence that forms the backbone of all advanced harmonic models. In this setup, leg AB establishes the initial trend, BC represents a partial retracement, and CD mirrors the directional impulse of AB.
Traders evaluate the symmetry of price and time between these swings. When the CD leg equals the AB leg in both point distance and elapsed duration, the structure signals that an impulse move may be completing.
The Core Harmonic Pattern Cheat Sheet and Fibonacci Ratios
To separate valid geometric setups from erratic chop, this discipline relies on non-negotiable mathematical tolerances. A pattern is invalid if intermediate pivot points miss their designated Fibonacci boundaries.
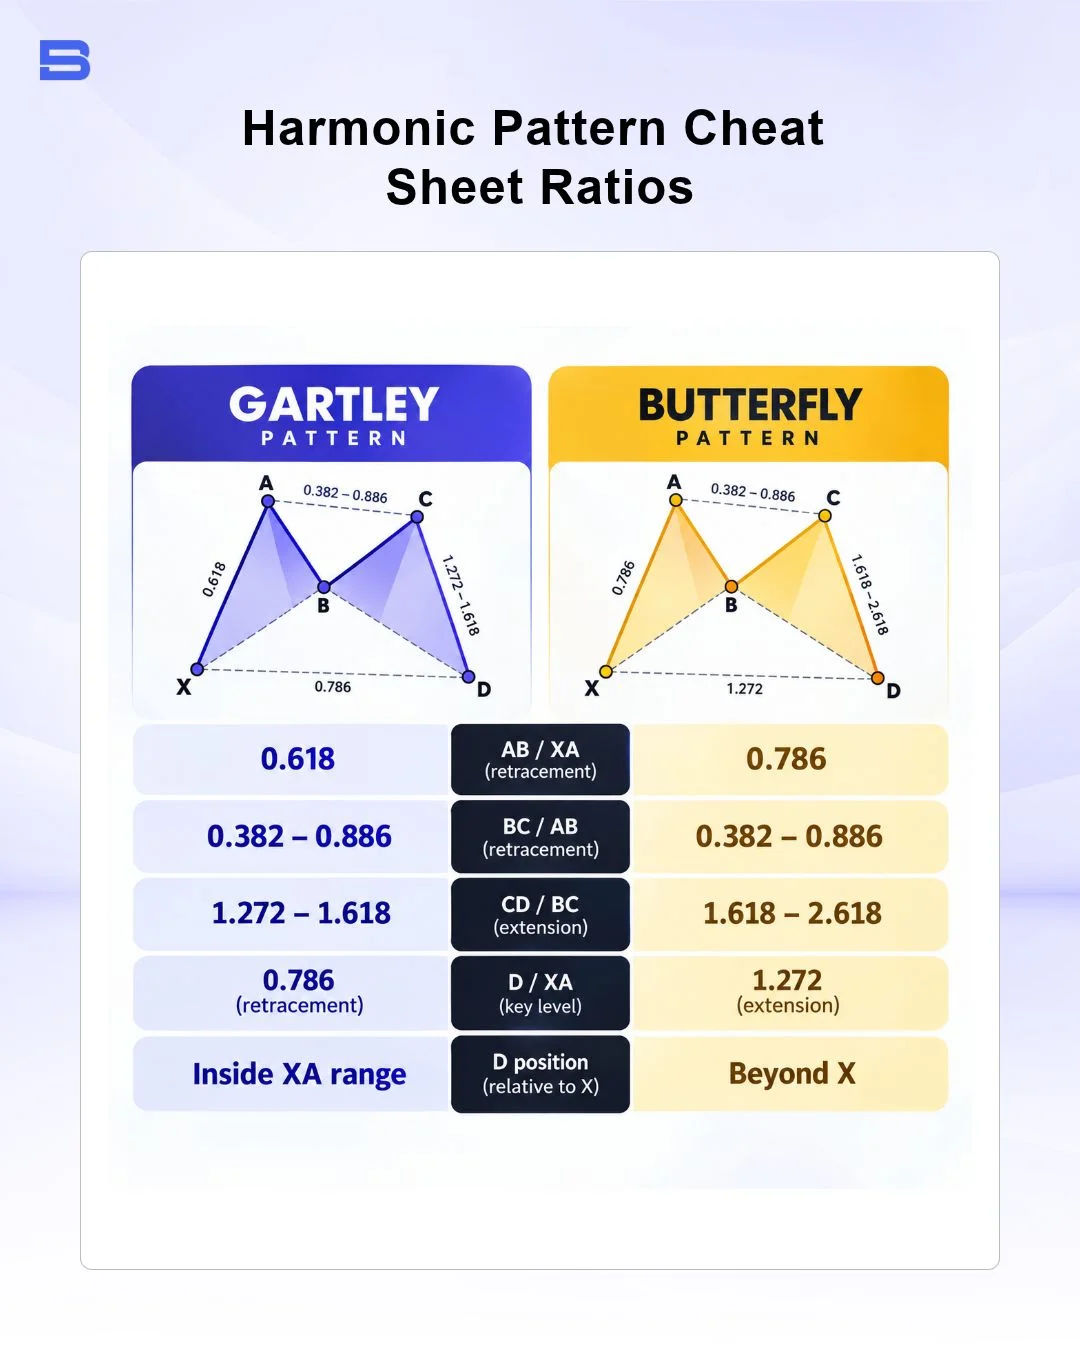
This trading style cheat sheet outlines the exact Fibonacci requirements for the two primary classical patterns:
The Gartley Pattern: Structure and Rules
The Gartley Pattern is a conservative retracement formation characterized by strict internal discipline. Point B must terminate precisely at the 61.8% Fibonacci retracement of the primary XA swing.
Following a secondary BC swing, the CD leg must drive price to point D at an exact 78.6% retracement of the original XA leg. A move beyond point X destroys the geometry immediately.
The Butterfly Pattern: Catching Trend Reversals
The Butterfly Pattern functions as an extension setup rather than a retracement structure. While its B point tests a deep 78.6% retracement of XA, its defining feature is that leg CD pushes entirely past the origin point X.
Point D completes at either a 1.272 or 1.618 Fibonacci extension of the XA swing, giving traders a framework to catch sharp terminal exhaustion during aggressive market trends. Traders seeking alternate multi-wave exhaustion structures also study the three drives pattern — a three-leg sequence of alternating rallies and pullbacks that similarly signals trend exhaustion.
How to Identify and Trade the Potential Reversal Zone (PRZ)
The Potential Reversal Zone (PRZ) is the specific price band around point D where multiple independent Fibonacci measurements converge. Harmonic trading does not view point D as a single rigid line, but rather as a tight convergence cluster.
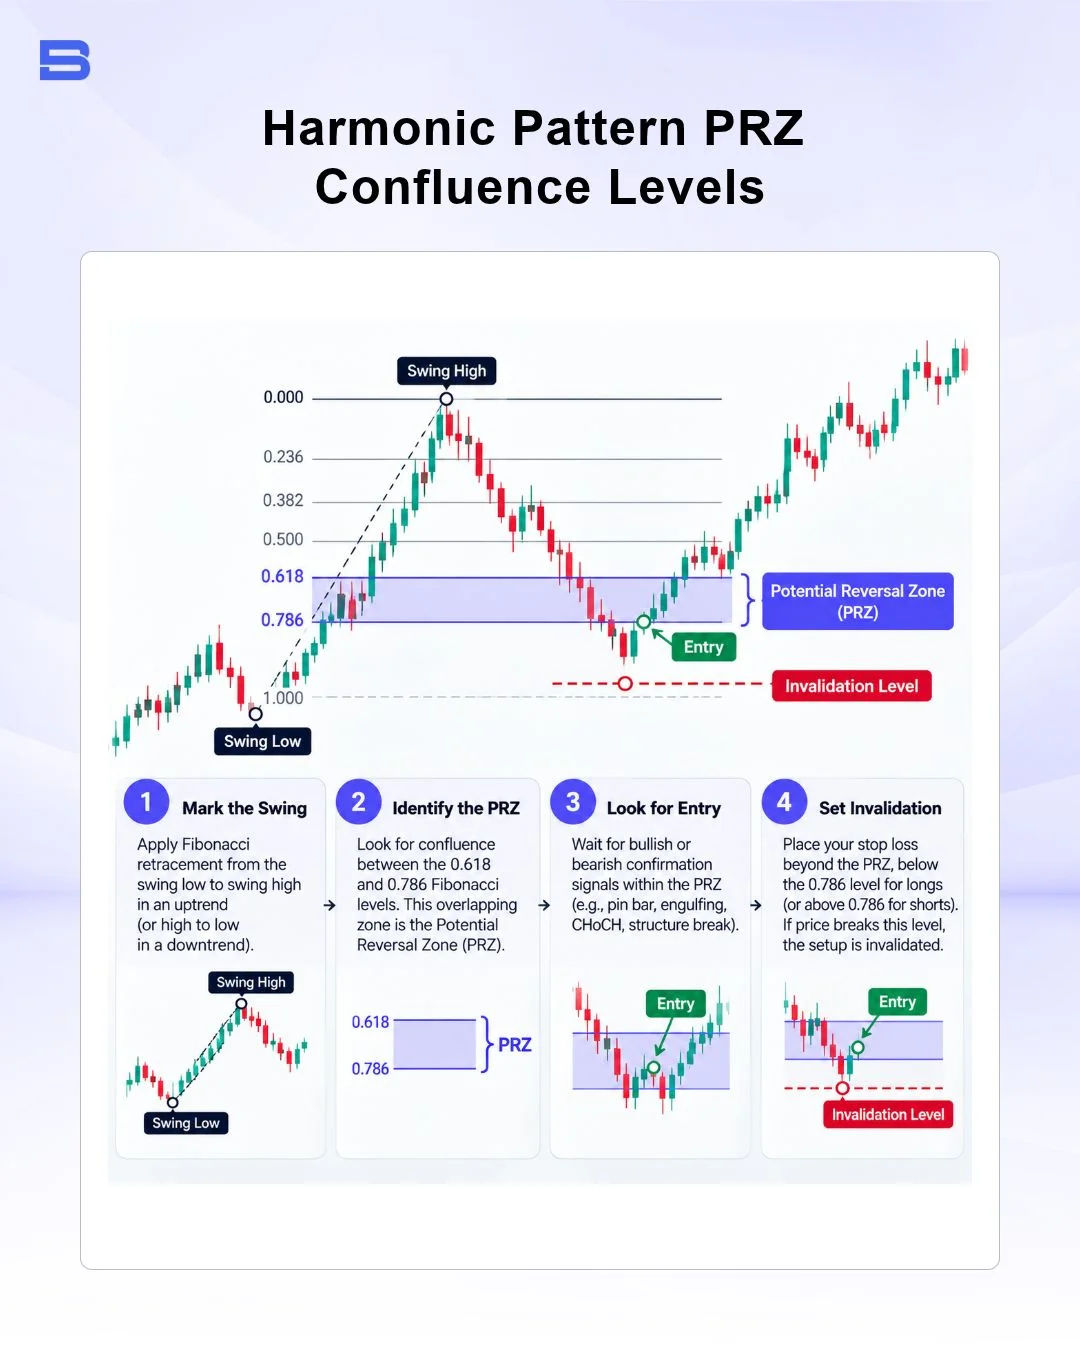
When an XA retracement, a BC projection, and an ABCD symmetry target all align within a narrow price range, Fibonacci confluence is established. However, entering an order blindly the moment price touches the PRZ exposes your capital to severe momentum risk.
Disciplined execution requires waiting for price confirmation within the zone. You should look for decisive candlestick chart rejection signals, such as an engulfing candle or a long-wick rejection bar, before committing funds.
Applying Harmonic Pattern Forex Setups in Liquid Currency Pairs
Executing harmonic pattern forex setups tends to yield clearer structural swings in high-volume major pairs like EUR/USD and GBP/USD. Deep institutional liquidity smooths out erratic pricing, allowing Fibonacci levels to form cleaner technical structures.
In contrast, exotic currencies or thinly traded small-cap assets frequently suffer erratic wicks that prematurely breach technical pivot points.
Step-by-Step Execution: Invalidation, Targets, and Risk-Reward
Trading harmonic setups requires objective order mechanics to remove emotional hesitation. Regulatory bodies such as the Financial Conduct Authority (FCA) frequently caution retail traders about the risks inherent in leveraged derivative products, making predefined stop levels mandatory.
Your trade invalidation point is clear: place your protective stop-loss just outside point X for retracement setups, or beyond the furthest extension boundary in an extension structure. Profit targets are managed in two distinct phases:
- Take Profit 1 (TP1): Set at the 38.2% Fibonacci retracement of the entire CD leg, where you close half your position and move your stop to break-even.
- Take Profit 2 (TP2): Set at the 61.8% Fibonacci retracement of the CD leg to capture secondary swing continuation.
Consider a practical execution scenario on EUR/USD. Suppose a Bearish Gartley completes at a PRZ price of 1.0850, with point X situated at 1.0870. You place your protective stop at 1.0880, risking 30 pips.
If your 38.2% CD retracement (TP1) sits at 1.0810, you achieve a 40-pip reward on the first lot, locking in a favorable risk-reward ratio before letting the remaining lot run toward 1.0770 (TP2).
Why Harmonic Patterns Fail: Invalidation Rules and Market Realities
Geometric perfection looks effortless on past charts, but real-world execution carries constant friction. High-impact macroeconomic releases, sudden liquidity voids, and algorithmic momentum can drive price straight through a PRZ without pause.
A harmonic pattern failure happens whenever price invalidates point X or closes decisively outside the PRZ boundaries. When this occurs, the geometric premise is destroyed, and holding the position in hope of an eventual turnaround invites catastrophic drawdown.
Subjectivity is another critical factor. Two traders may anchor point X to different swing lows, producing entirely divergent reversal zones. Treating this trading style as absolute rules rather than probabilistic frameworks is the fastest way to deplete trading capital.
Final Thoughts
Harmonic patterns offer a structured framework for charting reversals by combining geometry with mathematical discipline. They remove ambiguity by giving you specific coordinates for entries, invalidations, and take-profit milestones.
However, mathematical elegance does not eliminate market risk. Treat these geometric formations as probabilistic guides, prioritize confirmation inside the PRZ, and manage every position with strict stop-loss parameters.
- How to Build an Investment Plan That Actually Works for You?
- What Is the MACD Indicator and How to Use It
- What Is a Wedge Pattern in Trading?
- What Is Ichimoku Cloud Strategy? A Complete Trading System
- Mastering Elliott Wave Theory: Rules and Trading Strategies
- News Trading: Strategies, Execution Risks, and Risk Control
- What Is an Iron Condor Options Strategy?
- Backtesting Explained: What It Is and Why It Really Matters
- Grid Trading: Mechanics, Parameters, and Risk Strategies
- What Is Breakout Trading and How Does It Work?
- Mean Reversion: Technical Strategies and Risk Frameworks
- Momentum Trading: Indicators, Strategies, and Risk Control
- Hammer Candlestick: Structure, Meaning, and Strategy
- Doji Candlestick: Types, Signals, and Trading Strategies
- What Is the Sharpe Ratio and How to Calculate It
- What Is VWAP and How Do Traders Use It?
- Trade the Ascending Triangle: A Step-by-Step Practical Guide
- What Is the Stochastic Oscillator and How to Use It
- How to Trade the Descending Triangle Pattern
- High Frequency Trading: Speed, Algorithms, and Market Impact
- What Is Volume Profile and How to Use It in Trading
- What Is a Morning Star Pattern Candlestick?
- Trade with Parabolic SAR: A Practical Analysis Guide
- Evening Star Pattern: Structure, Rules, and Risk Controls
- Kelly Criterion: Formula, Position Sizing, and Risk
- What Is the NYSE Minimum Trading Price? Rules Explained
Disclaimer: The content on this page is intended for educational and informational purposes only. It does not constitute financial, investment, tax, or legal advice, and should not be interpreted as a recommendation to buy, sell, or hold any financial instrument or asset. Trading and investing involve significant risk, including the possible loss of your entire capital. Products such as forex, CFDs, and cryptocurrencies carry additional risks due to leverage, high volatility, and limited regulatory protection in some jurisdictions. Past performance of any financial instrument does not guarantee future results. Any market views, forecasts, or opinions expressed are those of the author at the time of writing and may not reflect current market conditions. Platform features, fees, and regulatory status are subject to change — always verify information directly with the relevant provider or regulator before making any financial decision. BrokerSpecs may receive compensation from third parties featured on this site. Always conduct your own due diligence and consider seeking advice from a licensed financial professional before investing. Portions of this article were prepared with the assistance of AI tools and reviewed by our editorial team before publication.