



Related Tags
Imagine staring at a fast-moving price chart where candlestick spikes appear chaotic and unpredictable. Amidst that noise, professional traders look for repeating geometric structures that pinpoint precise turning points before major market swings unfold.
Understanding how the Gartley pattern — a five-point harmonic price structure validated by Fibonacci ratios — maps market psychology through mathematical ratios allows you to identify high-probability trade setups with clearly defined risk boundaries.
What Are Harmonic Patterns and Where Does Gartley Fit?
Harmonic trading combines geometric price patterns with precise mathematical ratios to anticipate potential market turning points. These structures operate on the premise that price movements reflect market psychology, which frequently retraces and expands in alignment with Fibonacci proportions.
Unlike basic classical chart setups such as the double top pattern or a continuation flag pattern, harmonic setups require strict ratio compliance between individual price swings.
Origin of the Gartley 222 Pattern
The structure originated in 1935 when market analyst H.M. Gartley published his book Profits in the Stock Market. On page 222, Gartley illustrated a distinct five-point chart pattern designed to spot trend reversals in equities.
Technical analysts Larry Pesavento and Bryce Gilmore later refined the structure by applying exact Fibonacci retracement ratios to every leg. Today, traders refer to this classic harmonic structure interchangeably as the Gartley pattern or the 222 pattern.
Anatomy of the Gartley Pattern
The Gartley pattern is a 5-point geometric price pattern consisting of 4 distinct price swings — labeled XA, AB, BC, and CD — validated by specific Fibonacci retracement levels.
To evaluate a valid Gartley structure, you must trace five consecutive price pivot points designated as X, A, B, C, and D. The movement begins with an initial impulse wave (XA), followed by three counter-trend consolidation legs (AB, BC, and CD).

Bullish Gartley Pattern (W-Shape)
A bullish Gartley pattern resembles a distinct "W" shape on a price chart. The structure starts with a sharp upward move from Point X to Point A. Price then declines through AB, bounces upward toward C, and drops down to complete leg CD at Point D.
Point D marks the completion of the structure, signaling a potential upward price reversal where buyers typically prepare to enter long positions.
Bearish Gartley Pattern (M-Shape)
A bearish setup forms an "M" shape on the chart, indicating potential downside reversal. The setup opens with a strong downward price leg from Point X to Point A.
Price subsequently rallies to Point B, declines slightly to Point C, and makes a final upward push to Point D. At Point D, upward momentum tends to exhaust, providing short sellers an opportunity to capitalize on an anticipated downward turn.
Key Fibonacci Retracement Rules of the Gartley Structure
Harmonic patterns demand strict adherence to Fibonacci ratios; if a single leg breaches its required tolerance band, the pattern is invalidated. Many professional analysts favor quantitative validation methods — in line with industry best practices championed by bodies like the CFA Institute — to help eliminate subjective bias when backtesting geometric trading models.
Finding the Potential Reversal Zone (PRZ) at Point D
The Potential Reversal Zone (PRZ) represents a narrow price band where multiple Fibonacci calculation lines converge at Point D. In a classic Gartley setup, the PRZ is defined by the confluence of the 78.6% XA retracement, a 127.2% or 161.8% extension of leg BC, and an AB=CD symmetry completion (where the CD leg mirrors the length and angle of the AB leg).
When price enters this confluence band, institutional traders monitor price action closely for confirmation signals rather than placing blind limit orders.
Worked Price Scenario: EUR/USD Gartley Calculation
Consider a scenario on the EUR/USD hourly chart to see how these calculations map out in real-time execution:
- Point X: 1.0800 (base anchor)
- Point A: 1.1000 (initial impulse peak; XA = 200 pips)
- Point B: 1.0876 (exact 61.8% retracement of 200 pips from Point A)
- Point C: 1.0950 (rally retraces 59.6% of leg AB, staying valid between 38.2% and 88.6%)
- Point D (PRZ): 1.0843 (exact 78.6% retracement of 200 pips down from Point A: 1.1000 − (200 × 0.786) = 1.0843)
As price approaches 1.0843, the PRZ activates, signaling that the corrective phase is reaching completion.
Step-by-Step Execution: How Do You Trade the Gartley Pattern?
Trading the Gartley pattern requires a systematic process that moves from visual scanning to quantitative ratio validation and confirmation.
- Identify the Initial Impulse (XA): Locate a strong, clear price trend leg on your charting software.
- Measure Pivot Points B and C: Apply the Fibonacci retracement tool to leg XA to verify that Point B hits the 61.8% level. Then measure leg AB to ensure Point C stays within the 38.2%–88.6% boundary.
- Project the PRZ at Point D: Calculate the 78.6% retracement of XA. Mark this target area as your primary zone of interest.
- Wait for Confirmation: Observe candlestick price action when price touches the PRZ. Look for reversal indicators such as a bullish pin bar, an engulfing pattern, or a momentum divergence on the Relative Strength Index (RSI).
- Set Profit Targets: Divide your position into two take-profit levels based on the AD price leg. Set Take-Profit 1 (TP1) at the 38.2% retracement of leg AD, and Take-Profit 2 (TP2) at the 61.8% retracement of leg AD.
Risk Management and Stop-Loss Placement
Proper stop-loss placement is vital for protecting trading capital against sharp market breakouts. Your stop loss must always be placed beyond Point X.
Because Point X serves as the origin of the entire pattern structure, a price move past Point X completely invalidates the geometric premise of the trade setup.
Leverage amplifies your returns when the market moves in your favor, but it accelerates losses just as quickly if price breaches your setup — a sudden 1% unexpected move against a 20:1 leveraged position wipes out 20% of allocated trade equity.
Managing position size relative to the distance between Point D and your stop loss beyond Point X ensures that single trade failures do not compromise your overall portfolio.
Gartley Pattern vs. Bat, Butterfly, and Crab Patterns
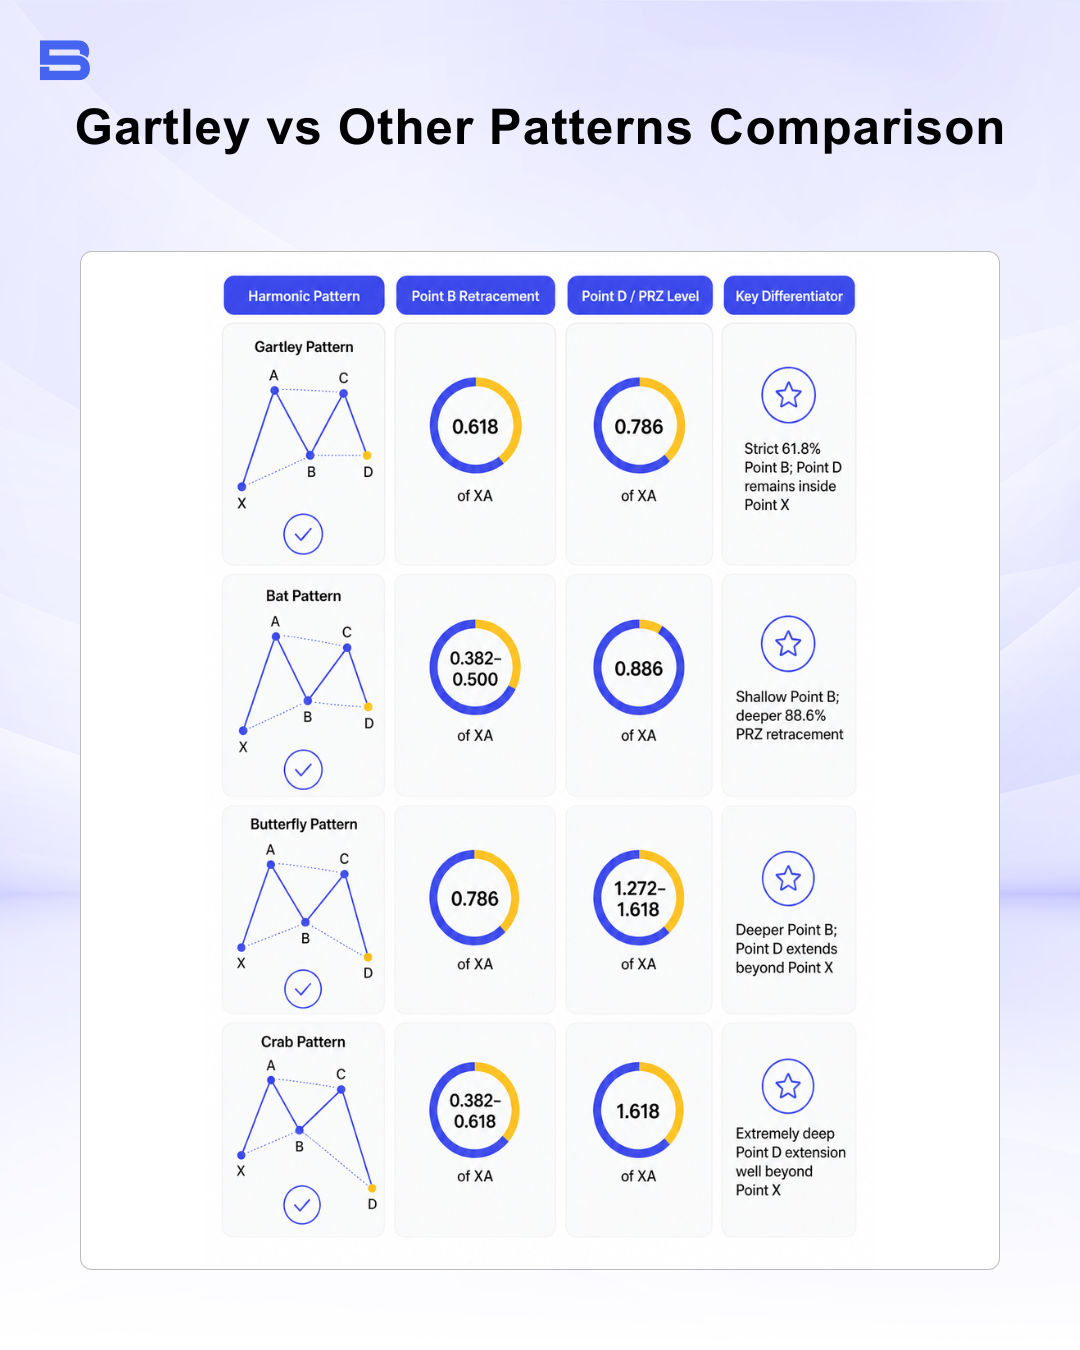
Harmonic patterns share similar XABCD letter structures, which frequently leads traders to misidentify setups. Distinguishing between patterns depends primarily on the retracement level at Point B and whether Point D stays within or expands beyond Point X.
Mastering the Gartley pattern comes down to disciplined ratio validation, patient confirmation at the PRZ, and consistent stop-loss placement beyond Point X — treat every setup as a probability-based structure rather than a guaranteed reversal signal.
- How to Build an Investment Plan That Actually Works for You?
- What Is the MACD Indicator and How to Use It
- What Is a Wedge Pattern in Trading?
- What Is Ichimoku Cloud Strategy? A Complete Trading System
- Mastering Elliott Wave Theory: Rules and Trading Strategies
- News Trading: Strategies, Execution Risks, and Risk Control
- What Is an Iron Condor Options Strategy?
- Backtesting Explained: What It Is and Why It Really Matters
- Grid Trading: Mechanics, Parameters, and Risk Strategies
- What Is Breakout Trading and How Does It Work?
- Mean Reversion: Technical Strategies and Risk Frameworks
- Momentum Trading: Indicators, Strategies, and Risk Control
- Hammer Candlestick: Structure, Meaning, and Strategy
- Doji Candlestick: Types, Signals, and Trading Strategies
- What Is the Sharpe Ratio and How to Calculate It
- What Is VWAP and How Do Traders Use It?
- Trade the Ascending Triangle: A Step-by-Step Practical Guide
- What Is the Stochastic Oscillator and How to Use It
- How to Trade the Descending Triangle Pattern
- High Frequency Trading: Speed, Algorithms, and Market Impact
- What Is Volume Profile and How to Use It in Trading
- What Is a Morning Star Pattern Candlestick?
- Trade with Parabolic SAR: A Practical Analysis Guide
- Evening Star Pattern: Structure, Rules, and Risk Controls
- Kelly Criterion: Formula, Position Sizing, and Risk
- What Is the NYSE Minimum Trading Price? Rules Explained
Disclaimer: The content on this page is intended for educational and informational purposes only. It does not constitute financial, investment, tax, or legal advice, and should not be interpreted as a recommendation to buy, sell, or hold any financial instrument or asset. Trading and investing involve significant risk, including the possible loss of your entire capital. Products such as forex, CFDs, and cryptocurrencies carry additional risks due to leverage, high volatility, and limited regulatory protection in some jurisdictions. Past performance of any financial instrument does not guarantee future results. Any market views, forecasts, or opinions expressed are those of the author at the time of writing and may not reflect current market conditions. Platform features, fees, and regulatory status are subject to change — always verify information directly with the relevant provider or regulator before making any financial decision. BrokerSpecs may receive compensation from third parties featured on this site. Always conduct your own due diligence and consider seeking advice from a licensed financial professional before investing. Portions of this article were prepared with the assistance of AI tools and reviewed by our editorial team before publication.