


Related Tags
You are watching a breakout gain momentum across your screens when the advance abruptly halts, reverses, and tumbles away from an invisible diagonal line where no obvious horizontal support or moving average exists. Moments like this often lead technical analysts toward the work of W.D. Gann, an early 20th-century market theorist who viewed financial charts not as random noise, but as precise geometric coordinates.
Understanding this methodology requires examining how market movements balance two inseparable dimensions: price distance and elapsed time.
What Is Gann Theory and How Does It Balance Time and Price?
Gann Theory is a technical analysis framework based on the premise that financial market prices and time intervals move in predictable mathematical proportions and geometric balance. Rather than treating price changes as isolated events, the system evaluates how many units of price a market moves relative to specific units of calendar or trading time.
The core structural premise of the theory is "squaring" time and price. When a security moves 100 points over the course of 100 days, or hits a price level that numerically matches the duration of the prior trend, Gann argues the market reaches mathematical equilibrium. At these intersection points, trends frequently experience exhaustion, directional pauses, or sharp reversals.
This geometric orientation separates Gann's work from other classical charting philosophies. While dow theory focuses on trend phases through primary market peaks and volume confirmation, Gann evaluates the slope velocity of the move itself.
Similarly, while the Wyckoff method deciphers institutional accumulation and distribution ranges through order flow absorption, Gann theory plots fixed geometric rays from major swing points to establish future structural boundaries.
Gann Angles and the Structural 1x1 Equilibrium
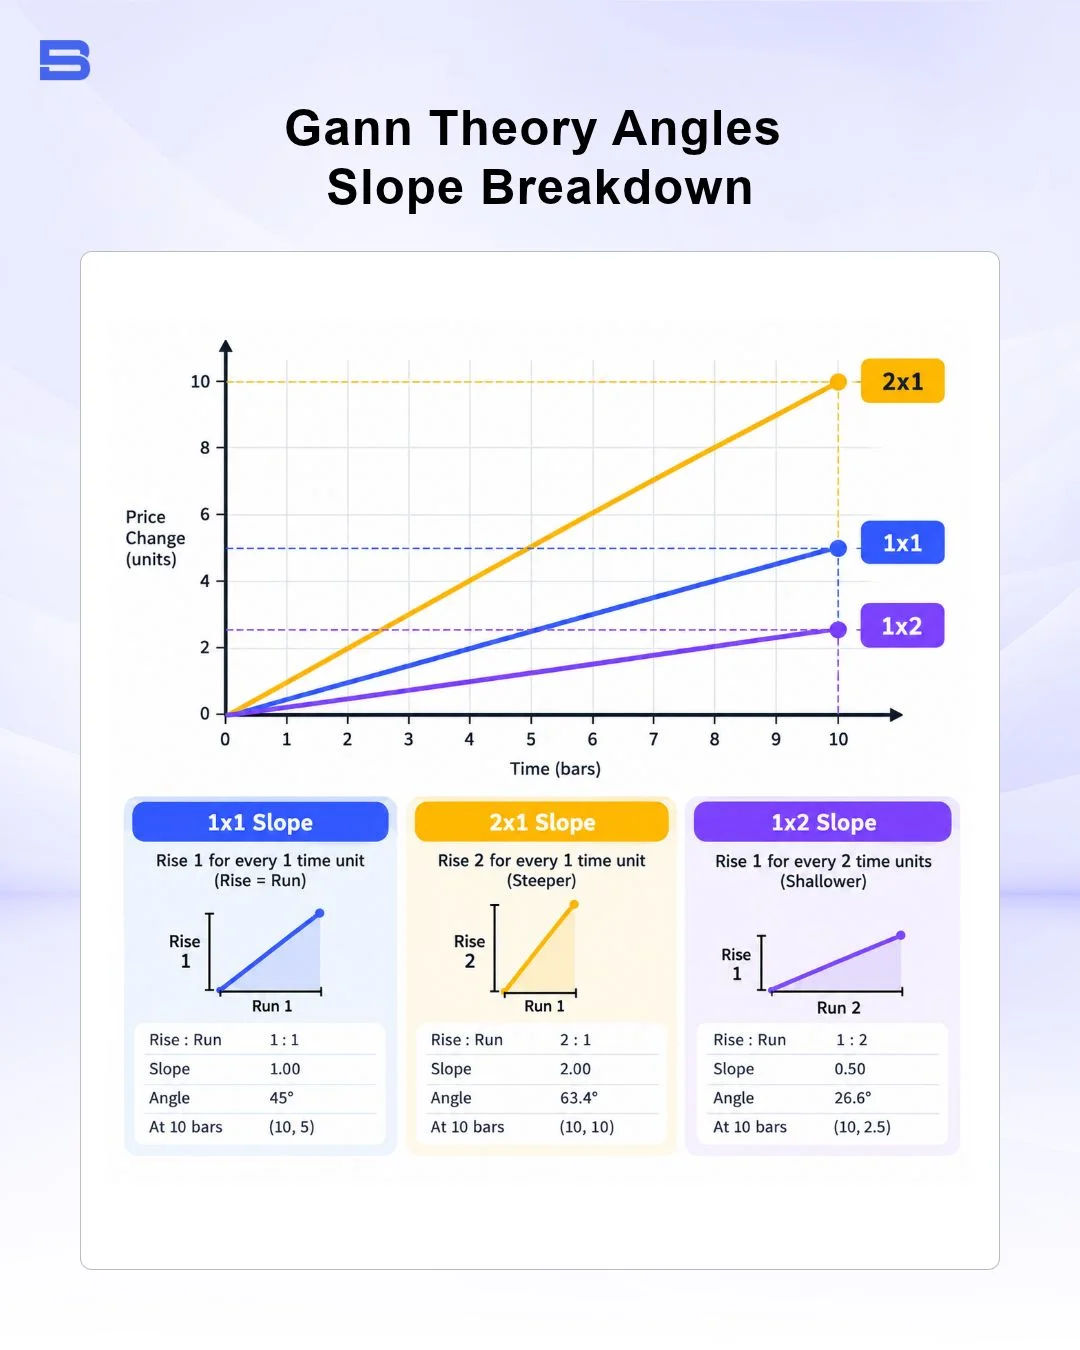
The foundation of Gann theory analysis rests on Gann angles, which represent distinct mathematical rates of change plotted diagonally across a price chart. The most significant angle in the entire framework is the 1x1 line, which represents exactly one unit of price movement for every one unit of time elapsed.
When drawn on a properly calibrated chart, the 1x1 angle forms a true 45-degree diagonal. Gann viewed this line as the ultimate equilibrium between buyers and sellers:
- Above the 1x1 Angle: The market demonstrates relative strength, indicating that buyers are driving prices upward faster than time is accumulating.
- Below the 1x1 Angle: The market displays underlying weakness, showing that price is failing to keep pace with elapsed time.
Beyond the baseline 1x1 equilibrium, secondary Gann angles track accelerating and decelerating trend velocities. Steeper angles like 2x1 (two units of price per one unit of time), 3x1, 4x1, and 8x1 reflect aggressive momentum phases. Conversely, flatter angles such as 1x2 (one price unit per two time units), 1x3, 1x4, and 1x8 outline decelerating trends where time outpaces price progression. When an asset breaks below a steep angle, it tends to gravitate toward the next flatter geometric support line below it.
Constructing a Gann Fan to Track Trend Momentum
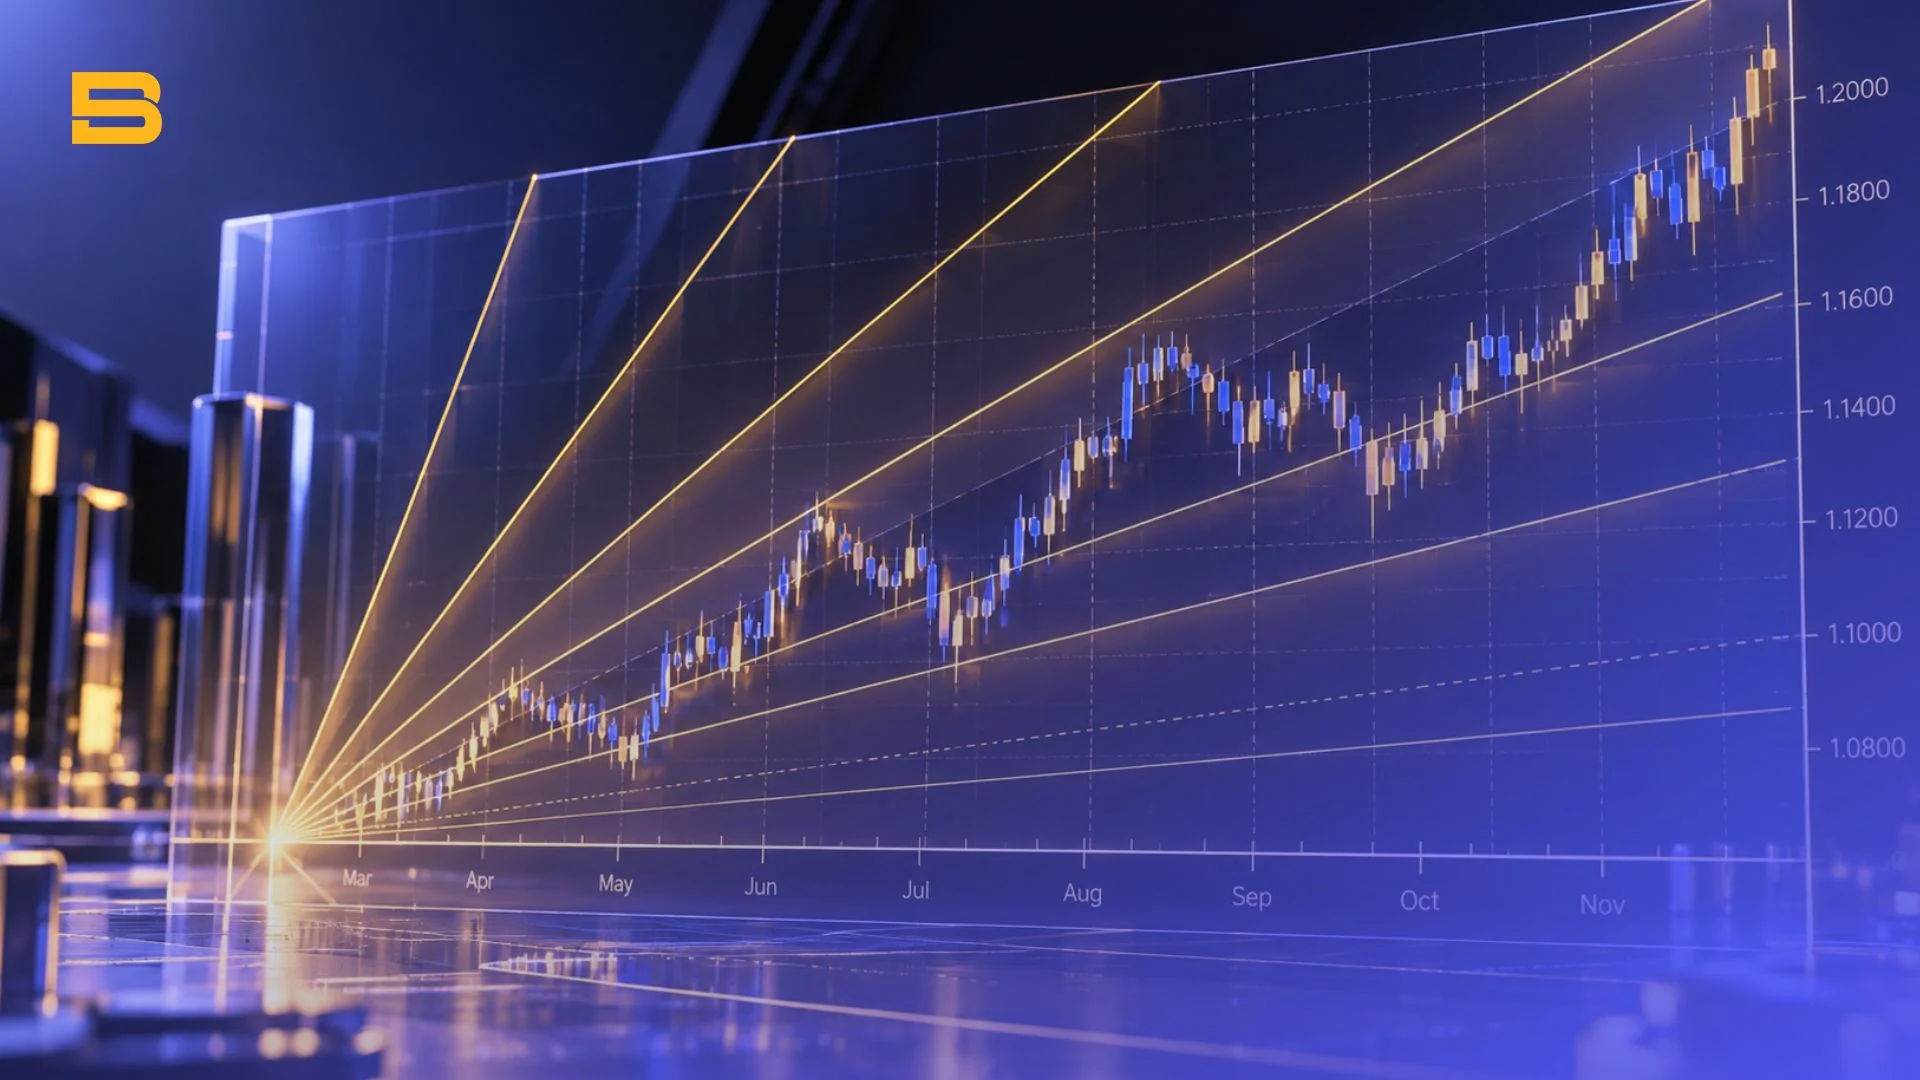
A Gann theory fan packages these geometric rays into a unified visual overlay anchored directly to a prominent market extreme. Traders anchor the base of the fan at a major swing low to project ascending support rays, or at an important swing high to plot descending overhead resistance.
As price advances, the fan rays act as dynamic support and resistance thresholds. If a rally accelerates above the 2x1 line, momentum remains exceptionally strong, but such steep velocity is rarely sustainable over extended periods. When the price inevitably breaks that steep trajectory below, it often experiences a sharp pullback toward the central 1x1 ray.
Monitoring how price interacts with these ray boundaries helps traders gauge momentum shifts before traditional horizontal levels trigger. A decisive breakdown beneath the 1x1 line signals that the dominant bullish phase has lost structural support, cautioning swing traders that lower geometric angles will likely be tested.
Navigating Price Targets with the Gann Square of 9
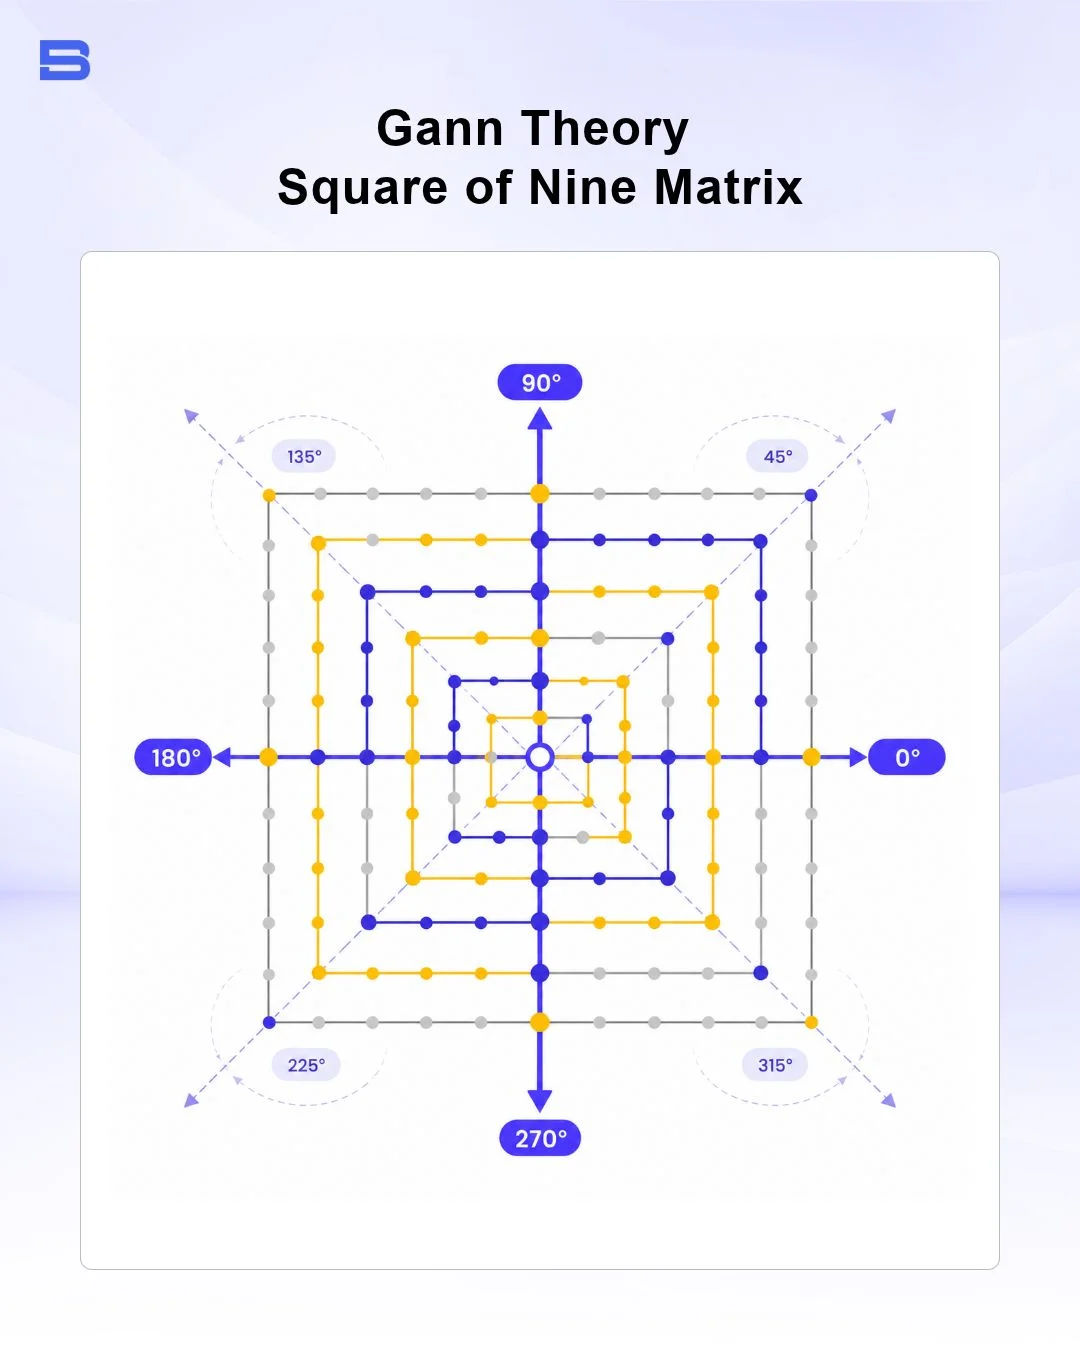
While angles track dynamic slope, the Gann Square of 9 is a computational matrix used to identify static support, resistance, and potential cycle turning points. The tool arranges numbers in a clockwise square spiral starting from the number 1 at its center, with values expanding incrementally outward across concentric rings.
The matrix operates on circular geometry, translating price levels into degrees around a 360-degree circle:
- Cardinal Cross (90° and 270°): Numbers falling along the vertical and horizontal axes represent primary quarterly turning points and major support or resistance levels.
- Ordinal Cross (45°, 135°, 225°, 315°): Numbers situated along the diagonal axes provide secondary structural reaction zones.
- Oppositions (180°): A half-circle rotation represents a direct mathematical polarity, frequently marking cyclical counter-trend targets.
By locating an asset's significant pivot low on the Square of 9, analysts project outward along specific degree increments to locate future price targets and forecast potential calendar dates for market turns.
How to Apply Gann Theory Trading in Modern Technical Analysis
Integrating Gann Theory into modern charting platforms requires combining geometric levels with systematic execution and disciplined risk control. Trading raw diagonal lines in isolation exposes capital to significant whipsaws, making confluence setups essential.
Many traders pair geometric levels with structural cycle extensions from Elliott Wave theory or harmonic completion zones found in harmonic pattern analysis to identify high-probability reversal clusters. Incorporating a strict trading plan ensures you only commit capital when geometric projections align with verifiable price action confirmation, such as a candlestick rejection pattern at a major angle intersection.
Consider a practical setup on an equity index. Suppose the index forms an intermediate swing low at 5,000 points and trends upward over 25 consecutive trading sessions to reach 5,100 points.
- Calculate the 1x1 Baseline: The asset moved 100 points over 25 days, which establishes a baseline 1x1 rate of change of 4.00 points per day (100 / 25 = 4.00).
- Project Geometric Slope: Plotting the 1x1 ray upward at 4.00 points per session establishes your primary dynamic support channel.
- Execution and Risk Definition: On day 30, the index pulls back to test the projected 1x1 support level at 5,120 points. Rather than placing a blind limit order on the ray, you wait for a bullish hammer confirmation candle on the daily chart. Once confirmed, you enter a long position at 5,124 points and place a stop-loss order at 5,108 points, just below the prior swing low and angle line. Your primary profit target sits at the 2x1 acceleration line overhead at 5,240 points.
Leverage amplifies your returns when you catch an accelerating geometric impulse, but it accelerates capital destruction just as quickly when the market breaks a key angle. Holding unhedged leveraged contracts through a broken 1x1 trend line can rapidly liquidate an account margin.
Technical Limitations: Aspect Ratio Scaling and Modern Chart Pitfalls
The single most common error retail traders make when applying Gann theory tools on modern software is ignoring aspect ratio scaling. Historical Gann analysis was conducted manually on physical grid paper using strict, permanent scales, such as one dollar equaling exactly one grid box per day.
Modern computer screens, however, utilize dynamic auto-scaling. When you zoom in, zoom out, or resize a browser window on a charting terminal, the visual angle of a trend line changes instantly.
A 45-degree diagonal on your screen may be calculated as a 2x1 slope on one monitor and a 1x2 slope on another unless you manually engage the "Lock Price To Bar Ratio" feature within your charting settings. Without locking this metric, geometric angles lose their mathematical relationship entirely.
Furthermore, traders must treat geometric squarings as probabilistic zones rather than deterministic turning points. Institutional standards established by the CFA Institute emphasize that no technical indicator guarantees future price movement, requiring rigorous testing and defined risk controls across all analytical frameworks.
Regulators such as the Securities Commission Malaysia (SC) frequently caution investors that relying on unverified predictive systems without structured capital preservation strategies significantly heightens trading risk.
Always pair geometric projections with a predetermined stop loss and sensible position sizing to protect trading capital from sudden market gaps and volatility spikes.
The Bottom Line
Gann Theory offers an insightful lens for evaluating markets through the co-equal relationship of price progression and elapsed time. When properly calibrated on fixed-scale charts and combined with modern momentum confirmation, its geometric angles and fan tools help frame trend velocity with clarity.
However, geometric lines are analytical guides rather than market guarantees; long-term trading longevity ultimately hinges on strict position sizing, disciplined stop-loss placement, and emotional restraint.
- How to Build an Investment Plan That Actually Works for You?
- What Is the MACD Indicator and How to Use It
- What Is a Wedge Pattern in Trading?
- What Is Ichimoku Cloud Strategy? A Complete Trading System
- Mastering Elliott Wave Theory: Rules and Trading Strategies
- News Trading: Strategies, Execution Risks, and Risk Control
- What Is an Iron Condor Options Strategy?
- Backtesting Explained: What It Is and Why It Really Matters
- Grid Trading: Mechanics, Parameters, and Risk Strategies
- What Is Breakout Trading and How Does It Work?
- Mean Reversion: Technical Strategies and Risk Frameworks
- Momentum Trading: Indicators, Strategies, and Risk Control
- Hammer Candlestick: Structure, Meaning, and Strategy
- Doji Candlestick: Types, Signals, and Trading Strategies
- What Is the Sharpe Ratio and How to Calculate It
- What Is VWAP and How Do Traders Use It?
- Trade the Ascending Triangle: A Step-by-Step Practical Guide
- What Is the Stochastic Oscillator and How to Use It
- How to Trade the Descending Triangle Pattern
- High Frequency Trading: Speed, Algorithms, and Market Impact
- What Is Volume Profile and How to Use It in Trading
- What Is a Morning Star Pattern Candlestick?
- Trade with Parabolic SAR: A Practical Analysis Guide
- Evening Star Pattern: Structure, Rules, and Risk Controls
- Kelly Criterion: Formula, Position Sizing, and Risk
- What Is the NYSE Minimum Trading Price? Rules Explained
Disclaimer: The content on this page is intended for educational and informational purposes only. It does not constitute financial, investment, tax, or legal advice, and should not be interpreted as a recommendation to buy, sell, or hold any financial instrument or asset. Trading and investing involve significant risk, including the possible loss of your entire capital. Products such as forex, CFDs, and cryptocurrencies carry additional risks due to leverage, high volatility, and limited regulatory protection in some jurisdictions. Past performance of any financial instrument does not guarantee future results. Any market views, forecasts, or opinions expressed are those of the author at the time of writing and may not reflect current market conditions. Platform features, fees, and regulatory status are subject to change — always verify information directly with the relevant provider or regulator before making any financial decision. BrokerSpecs may receive compensation from third parties featured on this site. Always conduct your own due diligence and consider seeking advice from a licensed financial professional before investing. Portions of this article were prepared with the assistance of AI tools and reviewed by our editorial team before publication.