


Related Tags
You are watching a stock or currency pair climb steadily for days, pushing into a price ceiling where rallies have stalled before. A wide green candle closes near its high, seemingly confirming buyer control, until the next session opens higher and then slides relentlessly downward to erase more than half of the previous day’s gains. That sudden shift in control is the dark cloud cover pattern, a visual warning that upward momentum may be running out of fuel.
What Is the Dark Cloud Cover Pattern and Why Does It Matter?
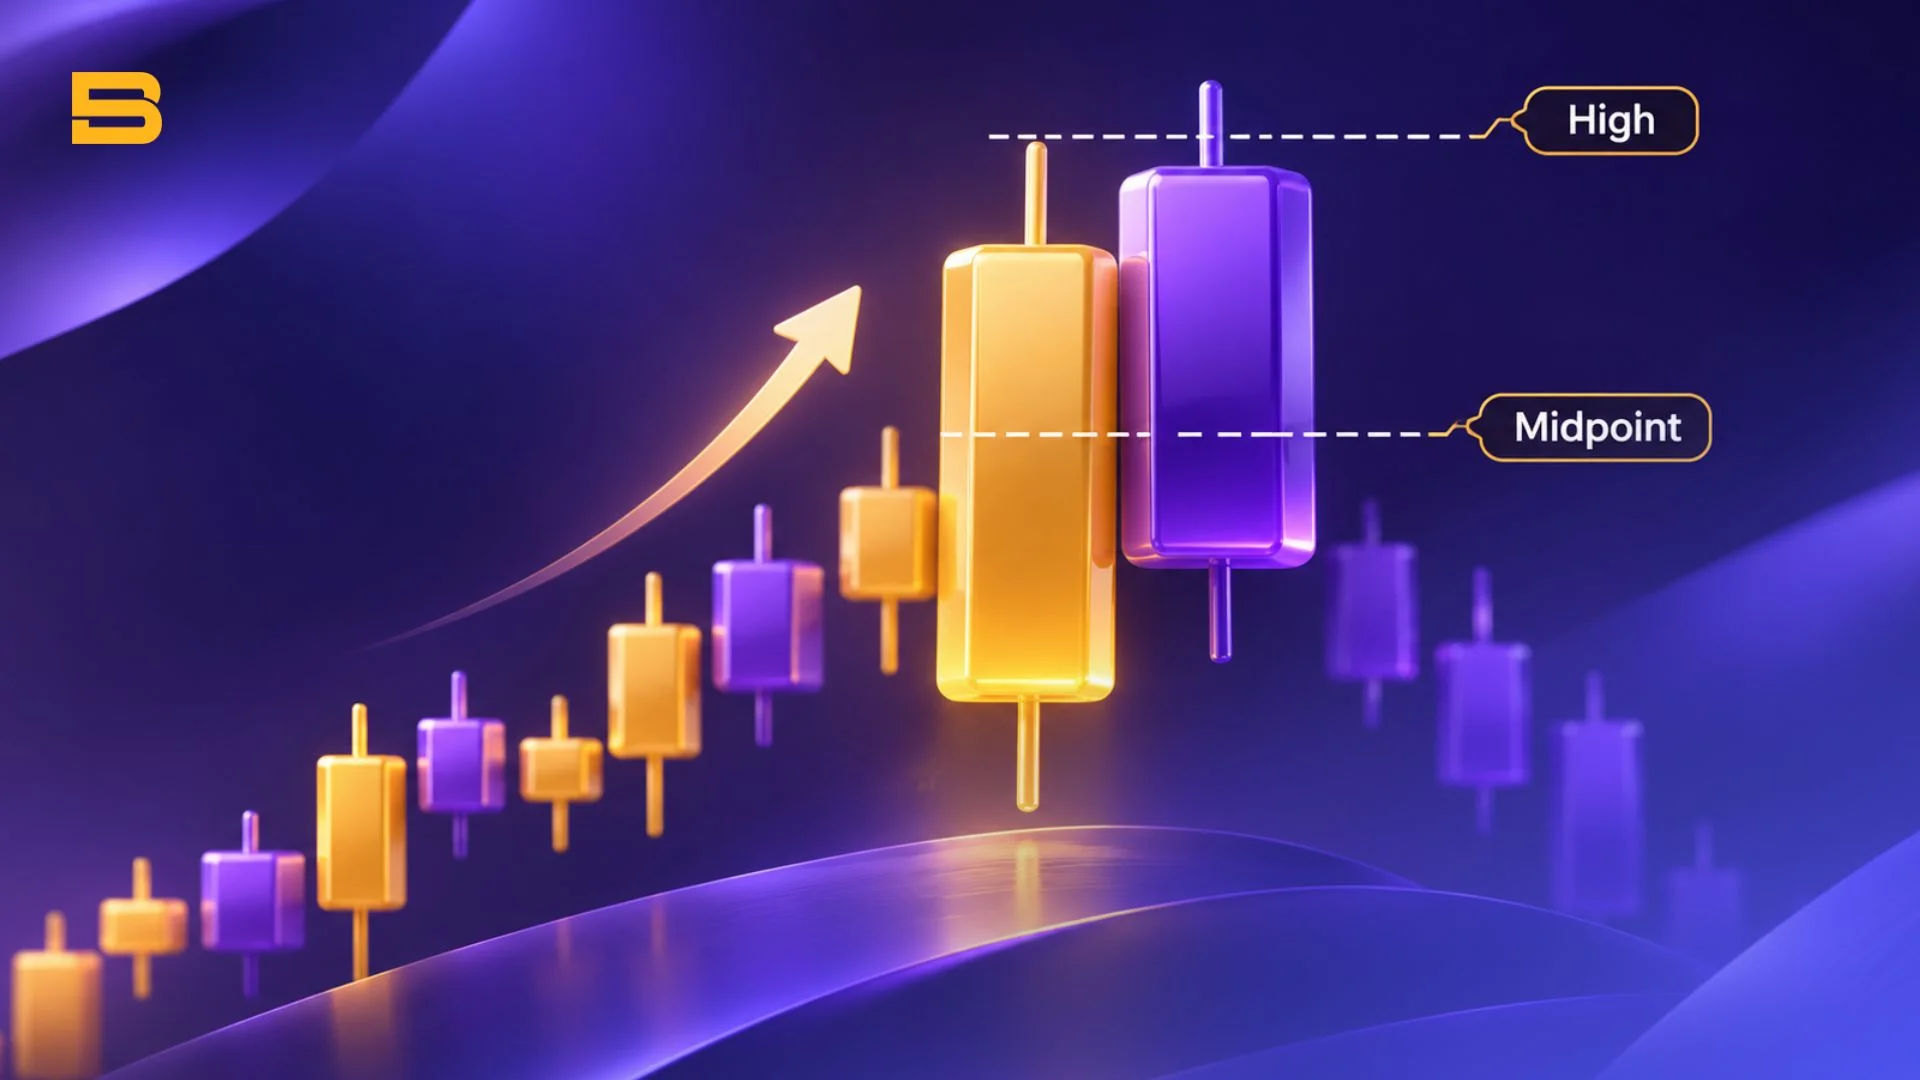
The dark cloud cover pattern is a two-candle bearish reversal formation where a strong bullish candle is followed by a bearish candle that opens higher and closes below the first candle’s midpoint. It appears after an established uptrend and signals that sellers have stepped in aggressively enough to overwhelm early buying enthusiasm.
Understanding the psychology behind these two candles helps you avoid chasing late rallies. On day one, buyers dominate from open to close, reinforcing optimism among trend followers. On day two, early buyers push the price even higher at the open, trapping late entrants when sellers flood the market and drive the close deep into the prior candle’s body.
Recognizing this shift matters because reversals rarely announce themselves cleanly. Rather than acting as an automatic sell button, the pattern alerts you to tighten risk on existing long positions or look for bearish confirmation near major support and resistance zones.
How to Identify the Dark Cloud Cover Candlestick Pattern
Spotting a valid dark cloud cover candlestick pattern requires checking four strict structural conditions rather than reacting to any red candle after a green one. Missing even one condition weakens the signal and increases the odds of entering prematurely against an intact uptrend.
- Prior uptrend: Price must be advancing over several sessions, making higher highs and higher lows before the two-candle formation appears.
- Strong first bullish candle: The first candle must have a large green or white body showing decisive buying pressure, often resembling a marubozu candlestick with minimal shadows.
- Higher second open: The second candle must open above the high or at least above the close of the first candle, reflecting initial bullish continuation.
- Bearish close past the midpoint: The second candle must close red or black below the 50% midpoint of the first candle’s real body, though it remains above the first candle’s open.
Each rule filters out routine pullbacks from genuine momentum shifts. A deeper close below the 50% threshold indicates stronger selling conviction, whereas a shallow close above the midpoint suggests buyers are still absorbing supply.
Session-Based Markets vs. 24-Hour Markets (Forex and Crypto)
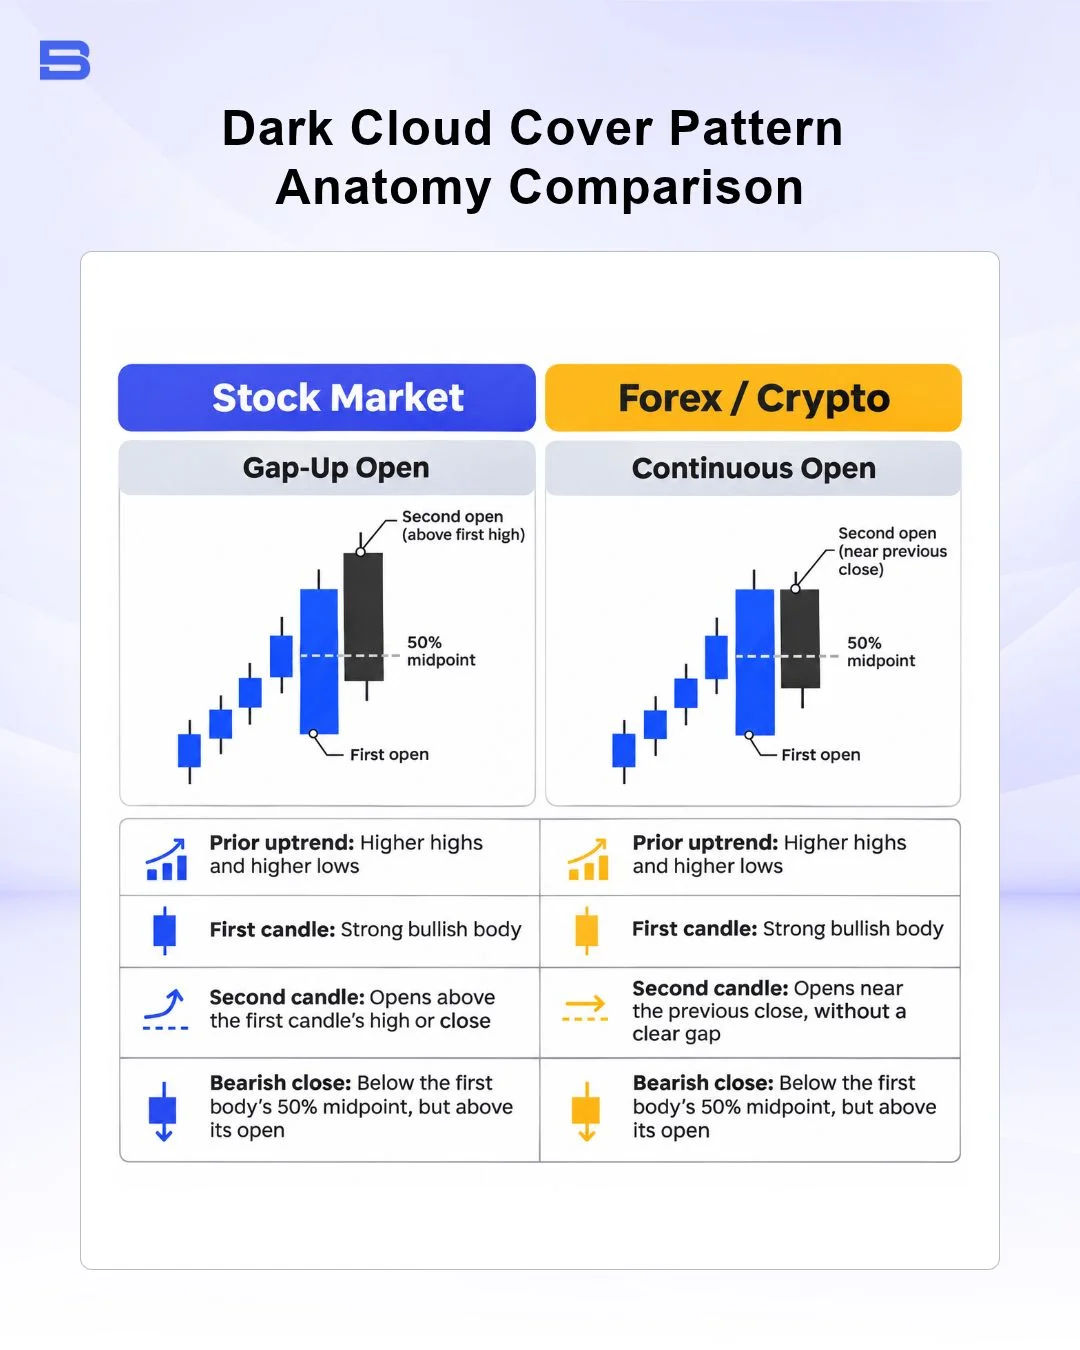
Traditional technical textbooks require the second candle to gap up above the first candle’s upper shadow. This gap rule is easier to apply in session-based equity markets such as Bursa Malaysia and the New York Stock Exchange (NYSE), where overnight news and accumulated buy or sell orders can create price imbalances that result in visible gaps when the market opens.
In continuous markets such as forex, which trades 24 hours a day, five days a week, and crypto, which trades 24/7, true price gaps rarely appear between consecutive daily or intraday candles, although forex can still gap when trading resumes after the weekend. When analyzing currency pairs or digital assets, traders adapt the rule by accepting a second candle that opens at or slightly above the prior candle’s close before rejecting higher prices and closing below the 50% midpoint.
Dark Cloud Cover vs. Bearish Engulfing Pattern
Traders frequently confuse dark cloud cover with the bearish engulfing pattern because both begin with a bullish candle followed by a sharp bearish rejection. Comparing their structural differences helps you gauge how aggressively sellers have seized control.
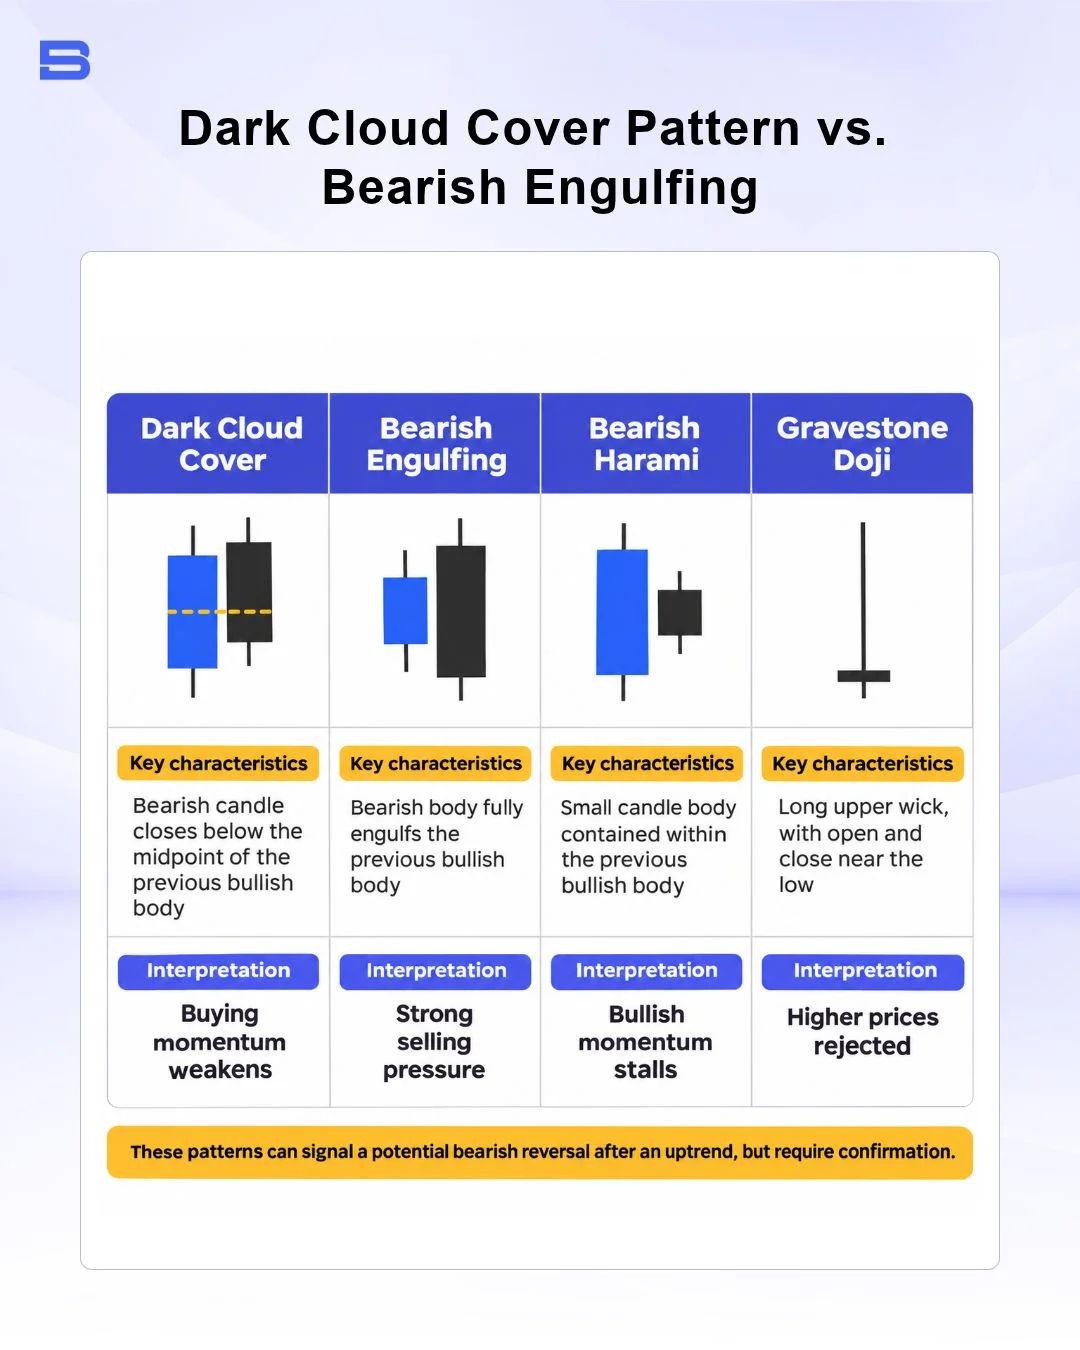
The primary distinction lies in penetration depth. While the dark cloud cover pattern closes past the 50% midpoint without wiping out the entire prior candle, a bearish engulfing candle opens above the previous close and closes completely below the first candle’s open, signaling stronger downward momentum.
Other bearish formations tell different stories about buyer exhaustion. A bearish harami features a small red candle contained entirely inside the prior green body, showing hesitation rather than immediate selling aggression, while a gravestone doji prints a single-candle rejection with a long upper wick and almost no real body.
Bullish Counterpart: The Piercing Line Pattern
Flipping the dark cloud cover pattern upside down produces the piercing line pattern, a two-candle bullish reversal that forms at the bottom of a downtrend. In a piercing line setup, a wide bearish candle is followed by a bullish candle that opens lower and closes above the 50% midpoint of the first candle’s body.
Just as bearish reversals come in varying strengths, traders pair the piercing line with other bottoming signals depending on market context. Single-candle rejections like the dragonfly doji or inverted hammer highlight sudden buying interest at lows, whereas two-candle formations such as the bullish harami and tweezer bottom show sellers gradually losing momentum before buyers step in.
How to Trade the Dark Cloud Cover Pattern Safely
Trading any two-candle formation in isolation exposes your account to frequent whipsaws, especially during choppy sideways ranges or strong macro uptrends. Risk-management principles discussed by the CFA Institute emphasize the importance of combining analytical judgment with broader market context and predefined risk limits, rather than relying on individual technical indicators alone.
Before acting on a dark cloud cover setup, check for at least two supporting filters:
- Key resistance confluence: Look for the pattern to form at a prior swing high, a major round number, or a descending trendline where sellers have previously defended price.
- Momentum divergence or overbought readings: A Relative Strength Index (RSI) reading above 70 or bearish divergence may indicate that the preceding rally is stretched.
- Third-candle confirmation: Wait for the next candle to close below the dark cloud cover’s low, or look for a bearish pin bar or inside bar breakdown before entering short.
Consider a practical position-sizing scenario on a $10,000 trading account where you risk a maximum of 1% ($100) per trade. Suppose a stock rallies into resistance at $50.00, prints a dark cloud cover peaking at $51.00, and confirms weakness when the third candle closes at $48.50.
You enter a short position at $48.50 and place your stop-loss at $51.50, just above the $51.00 pattern high, creating a $3.00 per-share risk. Dividing your $100 risk budget by $3.00 caps your position at 33 shares, while targeting prior support at $42.50 sets up a $6.00 per-share gain, or a 1:2 risk-to-reward ratio. Spreads, commissions, and overnight financing or stock borrowing fees reduce this potential gain and add to your loss if the stop is hit, so include them when you calculate your actual risk-to-reward ratio.
Even with clean confluence, false signals happen regularly when sudden news or institutional buying invalidates a resistance ceiling. Using leverage on CFDs or margin accounts magnifies gains when price drops as expected, yet it accelerates capital losses just as quickly if price gaps above your stop-loss, so keeping position sizes aligned with your investment plan remains essential.
Conclusion
The dark cloud cover pattern offers a clear visual clue that an uptrend may be losing momentum, especially when it appears near established resistance. Treating the formation as an early warning rather than a standalone trigger—and pairing it with third-candle confirmation and strict stop-loss sizing—helps you manage downside risk in both session-based equity markets and continuous forex and crypto markets.
- How to Build an Investment Plan That Actually Works for You?
- What Is the MACD Indicator and How to Use It
- What Is a Wedge Pattern in Trading?
- What Is Ichimoku Cloud Strategy? A Complete Trading System
- Mastering Elliott Wave Theory: Rules and Trading Strategies
- News Trading: Strategies, Execution Risks, and Risk Control
- What Is an Iron Condor Options Strategy?
- Backtesting Explained: What It Is and Why It Really Matters
- Grid Trading: Mechanics, Parameters, and Risk Strategies
- What Is Breakout Trading and How Does It Work?
- Mean Reversion: Technical Strategies and Risk Frameworks
- Momentum Trading: Indicators, Strategies, and Risk Control
- Hammer Candlestick: Structure, Meaning, and Strategy
- Doji Candlestick: Types, Signals, and Trading Strategies
- What Is the Sharpe Ratio and How to Calculate It
- What Is VWAP and How Do Traders Use It?
- Trade the Ascending Triangle: A Step-by-Step Practical Guide
- What Is the Stochastic Oscillator and How to Use It
- How to Trade the Descending Triangle Pattern
- High Frequency Trading: Speed, Algorithms, and Market Impact
- What Is Volume Profile and How to Use It in Trading
- What Is a Morning Star Pattern Candlestick?
- Trade with Parabolic SAR: A Practical Analysis Guide
- Evening Star Pattern: Structure, Rules, and Risk Controls
- Kelly Criterion: Formula, Position Sizing, and Risk
- What Is the NYSE Minimum Trading Price? Rules Explained
Disclaimer: The content on this page is intended for educational and informational purposes only. It does not constitute financial, investment, tax, or legal advice, and should not be interpreted as a recommendation to buy, sell, or hold any financial instrument or asset. Trading and investing involve significant risk, including the possible loss of your entire capital. Products such as forex, CFDs, and cryptocurrencies carry additional risks due to leverage, high volatility, and limited regulatory protection in some jurisdictions. Past performance of any financial instrument does not guarantee future results. Any market views, forecasts, or opinions expressed are those of the author at the time of writing and may not reflect current market conditions. Platform features, fees, and regulatory status are subject to change — always verify information directly with the relevant provider or regulator before making any financial decision. BrokerSpecs may receive compensation from third parties featured on this site. Always conduct your own due diligence and consider seeking advice from a licensed financial professional before investing. Portions of this article were prepared with the assistance of AI tools and reviewed by our editorial team before publication.